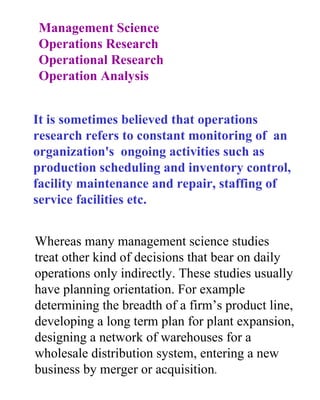
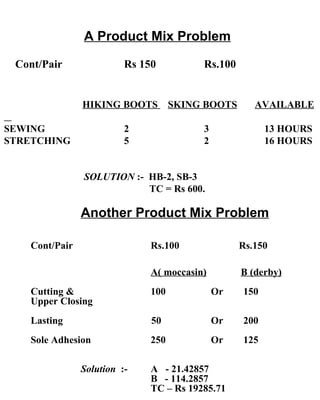
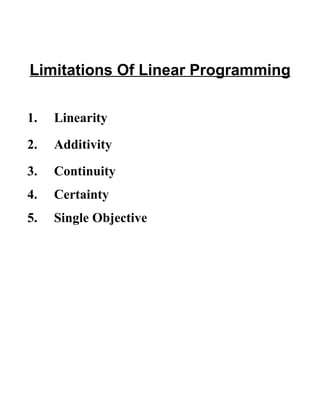
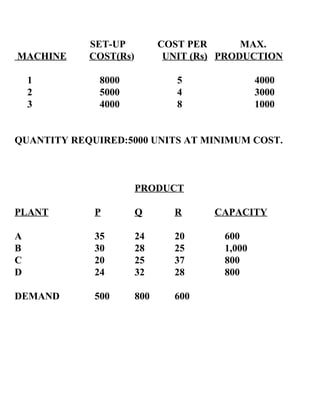
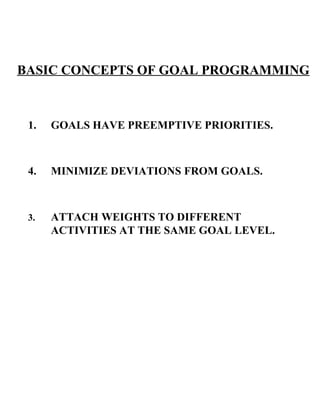
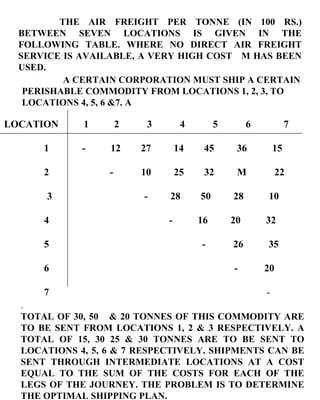
This document discusses operations research (OR) and its role in managerial decision making. It provides definitions of OR, describes common OR techniques like linear programming, and gives examples of OR applications in areas like production, marketing, finance, and personnel management. It also discusses the evolution of OR over multiple generations and limitations of linear programming as an OR technique. Several examples of linear programming problems in manufacturing and logistics settings are presented to illustrate the use of LP models.
This presentation is trying to explain the Linear Programming in operations research. There is a software called "Gipels" available on the internet which easily solves the LPP Problems along with the transportation problems. This presentation is co-developed with Sankeerth P & Aakansha Bajpai.
By:-
Aniruddh Tiwari
Linkedin :- http://in.linkedin.com/in/aniruddhtiwari
090528 Miller Process Forensics Talk @ Asqrwmill9716
Talk presented to local ASQ chapter. It dealt with process improvement: continuous measurement system validation and utilizing capability metrics for process forensics. Further, a program was introduced that\'s been used to optimize spare parts inventory based on a resampling approach to historical data.
International Journal of Computational Engineering Research (IJCER) is dedicated to protecting personal information and will make every reasonable effort to handle collected information appropriately. All information collected, as well as related requests, will be handled as carefully and efficiently as possible in accordance with IJCER standards for integrity and objectivity
This ppt will explain you the Defintion ,detailed explanation of phases with necessory diagrams, Applications ,Limitations and scope of Operations Research
A Study On the Effectiveness Of Lean Manufacturing Practices In MSME.jas16
It is a study done on finding the Effectiveness of lean Manufacturing Practices In MSME (Micro Small Medium Enterprises) with the help of cluster approach. the Study has primarily been done on 33 industrial units in Mohali Chandigarh.This study is very necessary for the Engineering and as well as Business Students and Entrepreneurs for the implementation of Lean Manufacturing Practice. it gives the whole ideas of perception on Lean.
Introduction to Operations Research with basic concepts along with Models in Operation Research also addressed.
Subscribe to Vision Academy YouTube Channel
https://www.youtube.com/channel/UCjzpit_cXjdnzER_165mIiw
2. Management Science Operations Research Operational Research Operation Analysis It is sometimes believed that operations research refers to constant monitoring of an organization's ongoing activities such as production scheduling and inventory control, facility maintenance and repair, staffing of service facilities etc. Whereas many management science studies treat other kind of decisions that bear on daily operations only indirectly. These studies usually have planning orientation. For example determining the breadth of a firm’s product line, developing a long term plan for plant expansion, designing a network of warehouses for a wholesale distribution system, entering a new business by merger or acquisition .
3.
4.
5. Characteristics Of O.R. 1. Inter-disciplinary Team Approach 2. Holistic Approach To The System 3. Focus On Decision Making
6.
7.
8.
9. Operations Research Software Available Bernard W.Taylor, Management Science, Prentice-Hall,Inc., Englewood Cliffs, New Jersey (Contains AB: QM 4.0 By Sang Lee), 1996. Hamdy A.Taha, Operations Research : An Introduction, Prentice-Hall Of India, New Delhi, (Contains Tora And SimmnetI1),1995. Sang M.Lee and Jung P.Shim, Micro Management Science, Allyn and Bacon, (Contains Micro Manager Version2.0),1990. Yih-long Chang, Quantitative Systems (QS) Version 3.0, Prentice-Hall, Inc., Englewood Cliffs, New Jersey, 1995. Yih-long Chang, Quantitative Systems For Business Plus (QSB+) Version 3.0, Prentice-Hall, Inc., Englewood Cliffs,NewJersey,1994.
10. The Five Generations Of OR Generation/ Time Frame Description First/ 1930s-1940s Emphasized The Applications Of The Scientific Methods To Problems Involving Operations Of Systems. OR Teams Were Interdisciplinary And Addressed Complex Problems. Second / 1950s Emphasized Mathematical/Optimization Techniques. Scientific Methods Still Employed And Computers Began To Be Integrated Into Tool Box. Third/ 1960s Those Who Emphasized Heuristics Programming And Ai-based Methodology Separated From OR, Thus Creating Two Approaches To “Satisficing.” Multiple Objective Optimization And Goal Programming Reflected The Change In OR. OR Associated With Quantitative; AI With Qualitative. Fourth/ 1970s- Present DSS And ES Methodologies Symbolize This Generation. ES Were Developed By AI In Response To Difficulties It Had Encountered; DSS By MS/OR. Decision Maker In Both Cases Becoming More Involved. Fifth/? There Is Now A Realization That To Solve A Larger Set Of “Real-World "problems, And So Make A Significant Impact On Decision Making Technology, One Needs To Employ A Much Larger Combination Of Techniques And Tools, Dependent Upon The Situation. Artificial Barriers And Constraints Of The Discipline; Should Not Be Inhibiting.
11.
12.
13. Janata fertilizers uses nitrates, phosphates, potash and an inert filler material for fertilizer manufacture. The firm mixes these four ingredients to make two basic fertilizers, 5-10-5 and 6-5-10 (nos. represent % wt. Of nitrates, phosphates and potash in each tonne of fertilizers). The contribution towards profits and overheads is Rs.300 and Rs.400 per tonne for (5-10-5) and (6-5-10) respectively. The firm has 120 tonnes of nitrates ,200 tonnes of phosphates, 150 tonnes of potash and unlimited filler material. They will not receive additional chemicals until next month. They believe that they can sell or store at negligible cost all fertilizer produced during the month. Determine optimal product mix.
20. SV COST Q 10 12 15 0 0 0 COEFF. Y 1 Y 2 Y 3 S 1 S 2 S 3 Y 3 15 2/5 0 3/5 1 -2/5 1/5 0 S 3 0 4/5 0 -4/5 0 1/5 -8/5 1 Y 1 10 9/5 1 1/5 0 1/5 -3/5 0 OC 1 4 3
21.
22.
23.
24.
25. 3. A FARMER HAS A 100- HECTARE FARM. HE CAN SELL ALL THE TOMATOES, LETTUCE, OR RADISHES HE CAN RAISE. THE PRICE HE CAN OBTAIN IS RE.1 PER KILOGRAM FOR TOMATOES, RE. 0.75 A HEAD FOR LETTUCE AND RS. 2 PER KILOGRAM FOR RADISHES. THE AVERAGE YIELD PER HECTARE IS 2,000 KILOGRAM OF TOMATOES, 3000 HEADS OF LETTUCE AND 1,000 KILOGRAMS OF RADISHES. FERTILIZER IS AVAILABLE AT RE. 0.50 PER KILOGRAM AND THE AMOUNT REQUIRED PER HECTARE IS 100 KILOGRAMS EACH FOR TOMATOES AND LETTUCE AND 50 KILOGRAMS FOR RADISHES. LABOUR REQUIRED FOR SOWING, CULTIVATING AND HARVESTING PER HECTARE IS 5 MAN-DAYS EACH FOR TOMATOES AND RADISHES AND 6 MAN-DAYS FOR LETTUCE. A TOTAL OF 400 MAN-DAYS OF LABOUR ARE AVAILABLE AT RS.20 PER MAN-DAY. FORMULATE THIS PROBLEM AS A LINEAR PROGRAMMING MODEL TO MAXIMIZE THE FARMER’S TOTAL PROFIT.
26. 4. FOUR PRDUCTS HAVE TO BE PROCESSED THROUGH THE PLANT, THE QUANTITIES REQUIRED FOR THE NEXT PRODUCTION PERIOD BEING: PRODUCT 1 2,000 UNITS PRODUCT 2 3,000 UNITS PRODUCT 3 3,000 UNITS PRODUCT 4 6,000 UNITS THERE ARE THREE PRODUCTION LINES ON WHICH THE PRODUCTS COULD BE PROCESSED. THE RATES FOR PRODUCTION IN UNITS PER DAY AND THE TOTAL AVAILABLE CAPACITY IN DAYS ARE GIVEN IN THE FOLLOWING TABLE. THE COST OF USING THE LINES IS RS. 600, RS. 500, RS. 400 PER DAY,RESPECTIVELY, ASSIGNMENT OF FOUR PRODUCTS: RATES OF PRODUCTION IN UNITS PER DAY. PRODUCTION PRODUCT MAX.LINE LINE 1 2 3 4 CAPACITY(DAYS) A 150 100 500 400 20 B 200 100 760 400 20 C 160 80 890 600 18 FORMULATE THE ABOVE AS A LINEAR PROGRAMMING PROBLEM TO MINIMIZE THE COST OF PRODUCTION .
27. 5. PRQ FEED COMPANY MARKETS TWO FEED MIXES FOR CATTLE. THE FIRST MIX, FERTILEX, REQUIRES AT LEAST TWICE AS MUCH WHEAT AS BARLEY. THE SECOND MIX, MULTIPLEX REQUIRES AT LEAST TWICE AS MUCH BARELY AS WHEAT. WHEAT COSTS RS.1.50 PER KG. AND ONLY 1,000 KG. ARE AVAILABLE THIS MONTH. BARLEY COSTS RS. 1.25 PER KG. AND 1200 KG. ARE AVAILABLE. FERTILEX SELLS FOR RS.1.80 PER KG. UPTO 99 KG, AND EACH ADDITIONAL KG. OVER 99 KG. SELLS FOR RS.1.65. MULTIPLEX SELLS AT RS. 1.70 PER KG. UPTO 99 KG. AND EACH ADDITIONAL KG.OVER 99 KG. SELLS FOR RS.1.55. BHARAT FARMS WILL BUY ANY AND ALL AMOUNTS OF BOTH MIXES PQR FEED COMPANY WILL MIX. SET UP THE LINEAR PROGRAMMING PROBLEM TO DETERMINE THE PRODUCE MIX THAT RESULTS IN MAXIMUM PROFITS .
28. A MANUFACTURER HAS CONTRACTED TO PRODUCE 2,000 UNITS OF A PARTICULER PRODUCT OVER THE NEXT EIGHT MONTHS. DELIVERIES ARE SCHEDULED AS FOLLOW: JANUARY 100 FEBRUARY 200 MARCH 300 APRIL 400 MAY 100 JUNE 100 JULY 500 AUGUST 300 TOTAL 2,000 THE MANUFACTURER HAS ESTIMATED THAT IT COSTS HIM RE. 1 TO STORE ONE UNIT OF PRODUCT FOR ONE MONTH. HE HAS A WAREHOUSE CAPACITY OF 300 UNITS. THE MANUFACTURER CAN PRODUCE ANY NUMBER OF UNITS IN A GIVEN MONTH, SINCE THE UNIT CAN BE PRODUCED MOSTLY WITH PART-TIME LABOUR, WHICH CAN BE EASILY OBTAINED. HOWEVER,THERE ARE THE COST OF TRANING NEW PERSONNEL AND COSTS ASSOCIATED WITH LAYING OFF PERSONNEL WHO HAVE BEEN HIRED. THE MANUFACTURER HAS ESTIMATED THAT IT COSTS APPOXIMATELY 75 PAISE PER UNIT TO INCRESE THE PRODUCTION LEVEL FROM ONE MONTH TO THE NEXT(E.G. IF PRODUCTION IN JANUARY IS 200 AND IS INCREASED TO 300 IN FEBRUARY, THE COST IS RS.75 FOR TRANING THE ADDITIONAL PEOPLE REQUIRED TO PRODUCE AT THE 300 UNIT LEVEL.)SIMILARLY IT COSTS 50 PAISE PER UNIT TO REDUCE PRODUCTION FROM ONE MONTH TO THE NEXT. (AT THE END OF EIGHT MONTHS, ALL EMPLOYEE WILL BE LAID OFF WITH THE CORRESPONDING PRODUCTION-REDUCTION COSTS). ASSUME THE PRODUCTION LEVEL BEFORE JANUARY IS ZERO . FORMULATE THE ABOVE AS A LINEAR PROGRAMMING PROBLEM.
29.
30.
31. AN ASSIGNMENT PROBLEM WORKERS I II III IV A 16 15 18 JOBS B 13 16 14 C 14 13 11 D 16 18 17 A ROUTING PROBLEM TO CITY A B C D E A - 4 7 4 FROM B 4 - 3 4 CITY C 7 6 - 7 D 3 7 - 7 E 4 5 7 - 160 10 60 80 80 110 A TRANSPORTATION PROBLEM WAREHOUSES 14 12 3 5 12 15 6 3 4 FACTORIES TO/ FROM D E F G CAPACITY A 42 48 38 37 160 B 40 49 52 51 150 C 39 38 40 43 190 REQD. 80 90 110 220 500/500
32.
33. The cutting division of the photo film corporation requisitions from stock control department plastic films of 85 feet (fixed unit length) which can be cut according to two patterns. First pattern will cut each film length into 35 feet pieces with the remaining 15 feet to scrap. Second pattern will cut each film length into a 35 feet piece and two 25 feet pieces with nothing to scrap. The present order from a customer is for 8 pieces of 35 feet length and 6 pieces of 25 feet length. What minimum number of plastic films of 85 feet should be cut to meet customer requirement?
34.
35. 2. ABC COMPANY HAS 4 INDEPENDENT INVESTMENT PROJECTS AND MUST ALLOCATE A FIXED CAPITAL TO ONE OR MORE OF THEM SO THAT THE COMPANY’S NET PRESENT VALUE IS MAXIMIZED. THE ESTIMATED NET PRESENT VALUE AND THE ANTICIPATED CASH OUTFLOWS ASSOCIATED WITH THESE PROJECTS IS GIVEN IN THE FOLLOWING TABLE: NPV CASH OUTFLOWS(RS.1000) PR. NO (RS. 1000) YEAR(I) YEAR(II) 1 100 50 150 2 50 105 30 3 140 318 143 4 90 100 68 IN SELECTING THESE PROJECTS, THE COMPANY IS CONSTRAINED TO LIMIT ITS EXPENDITURE IN THE FIRST YEAR TO RS.5, 15,000 AND IN THE SECOND YEAR TO RS. 6,38,000. IF PROJECTS 1 AND 3 ARE MCTUALLY EXCLUSIVE, HOW SHOULD THE INVESTMENT BE MADE SO THAT THE TOTAL NET PRESENT VALUE IS MAXIMIZED?
36. SET-UP COST PER MAX. MACHINE COST(Rs ) UNIT (Rs) PRODUCTION 1 8000 5 4000 2 5000 4 3000 3 4000 8 1000 QUANTITY REQUIRED:5000 UNITS AT MINIMUM COST. PRODUCT PLANT P Q R CAPACITY A 35 24 20 600 B 30 28 25 1,000 C 20 25 37 800 D 24 32 28 800 DEMAND 500 800 600
37.
38. NTC PRODUCES TWO TYPES OF MATERIALS, A STRONG UPHOLSTERY MATERIAL AND A REGULAR DRESS MATERIAL. THE UPHOLSTERY IS PRODUCED ACCORDING TO DIRECT ORDERS FROM FURNITURE MANUFACTURERS. THE DRESS MATERIAL ON THE OTHER HAND, IS DISTRIBUTED TO RETAIL FABRIC STORES. AVERAGE PRODUCTION RATES FOR THE TWO MATERIALS ARE IDENTICAL; 1000 METRES/HR. BY RUNNING TWO SHIFTS, NET OPERATIONAL CAPACITY OF THE PLANT IS 80 HOURS/WK. THE MARKETING DEPARTMENT REPORTS THAT THE MAXIMUM ESTIMATED SALES FOR THE FOLLOWING WEEK IS 70,000 M. OF UPHOLSTERY AND 45,000 M. OF DRESS MATERIAL. ACCORDING TO THE ACCOUNTING DEPARTMENT, THE APPROXIMATE PROFIT FROM A METRE OF UPHOLSTERY MATERIAL IS RS.2.50 AND FROM A METRE OF DRESS MATERIAL IS RS.1.50. THE M.D. OF THE COMPANY BELIVES THAT A GOOD EMPLOYER- EMPLOYEE RELATIONSHIP IS IMPORTANT IN BUSINESS. HENCE HE DECIDES THAT A STABLE EMPLOYMENT LEVEL IS A PRIMARY GOAL FOR THE FIRM. THEREFORE, WHENEVER THERE IS EXCESS DEMAND OVER NORMAL PRODUCTION, HE SIMPLY EXPANDS PRODUCTION CAPACITY BY PROVIDING OVERTIME. HOWEVER HE FEELS THAT OVERTIME OF MORE THAN 10 HOURS/WK. SHOULD BE AVOIDED – BECAUSE OF ACCELERATING COSTS. CONTD….P/2.
39.
40.
41.
42. LOCATION 1 2 3 4 5 6 7 1 - 12 27 14 45 36 15 2 - 10 25 32 M 22 3 - 28 50 28 10 4 - 16 20 32 5 - 26 35 6 - 20 7 - . TOTAL OF 30, 50 & 20 TONNES OF THIS COMMODITY ARE TO BE SENT FROM LOCATIONS 1, 2 & 3 RESPECTIVELY. A TOTAL OF 15, 30 25 & 30 TONNES ARE TO BE SENT TO LOCATIONS 4, 5, 6 & 7 RESPECTIVELY. SHIPMENTS CAN BE SENT THROUGH INTERMEDIATE LOCATIONS AT A COST EQUAL TO THE SUM OF THE COSTS FOR EACH OF THE LEGS OF THE JOURNEY. THE PROBLEM IS TO DETERMINE THE OPTIMAL SHIPPING PLAN. A CERTAIN CORPORATION MUST SHIP A CERTAIN PERISHABLE COMMODITY FROM LOCATIONS 1, 2, 3, TO LOCATIONS 4, 5, 6 &7. A THE AIR FREIGHT PER TONNE (IN 100 RS.) BETWEEN SEVEN LOCATIONS IS GIVEN IN THE FOLLOWING TABLE. WHERE NO DIRECT AIR FREIGHT SERVICE IS AVAILABLE, A VERY HIGH COST M HAS BEEN USED.