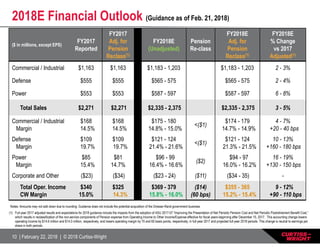
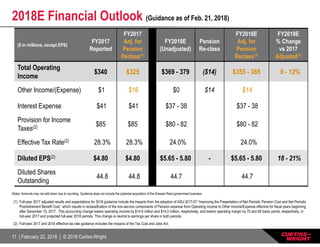
The document provides Curtiss-Wright's earnings results for 4Q and full year 2017, as well as their business outlook for 2018. Some key highlights include:
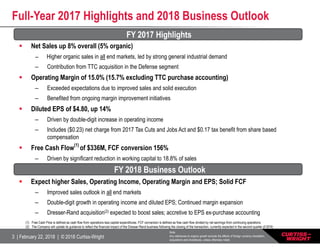
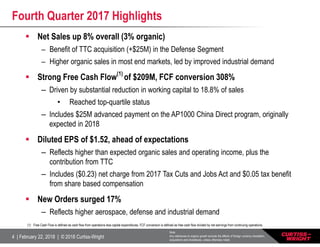
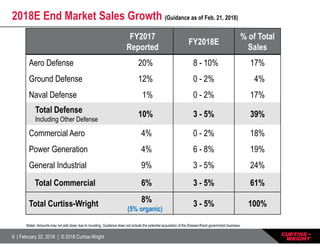
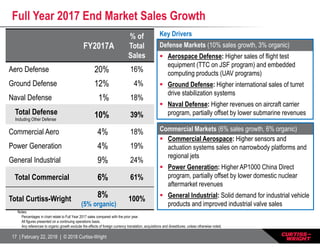
- Net sales grew 8% in 2017, with 5% organic growth and contribution from acquisitions
- Operating margin was 15.0% in 2017, exceeding expectations
- Diluted EPS grew 14% to $4.80 in 2017
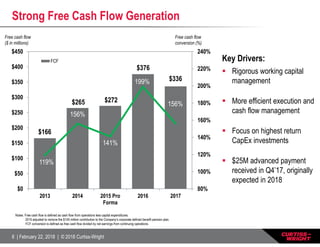
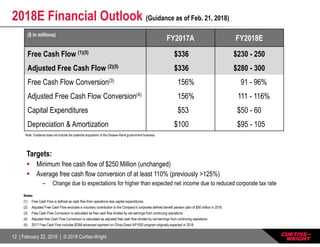
- Free cash flow was $336 million in 2017, with a conversion rate of 156%
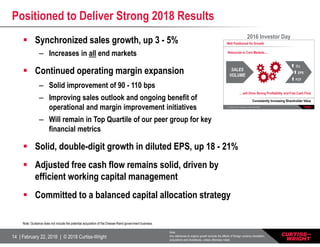
- For 2018, the company expects higher sales, operating income, margins and EPS, along with continued strong free cash flow.