The Houston industrial market saw 13 million square feet of new inventory added in 2019. Vacancy rates increased to 6.9% in the fourth quarter, though net absorption remained positive at 2.4 million square feet. Demand continues to be driven by logistics, distribution, and e-commerce users, though an oversupply of spec construction may challenge landlords in some submarkets. Overall, the Houston industrial market had a solid year with healthy absorption and job growth.
The document summarizes Houston's industrial real estate market performance in Q1 2020. It notes that vacancy increased to 7.9% from 6.9% in Q4 2019. Net absorption remained positive at 3.2M SF despite economic challenges from low oil prices and COVID-19. Rental rates increased slightly. The market faces short term uncertainty from the pandemic's economic impact, but the industrial sector is expected to outperform other commercial real estate over the long run due to growth in e-commerce, inventory stockpiling, and potential supply chain changes.
Retail Lives
Economic fundamentals continue to strengthen in the
U.S., a trend that is expected to endure through
mid-2019. With continued wage growth acceleration
and consumer confidence near an 18-year high, the
retail marketplace has registered solid spending.
Inflation-adjusted consumer expenditures show a
steady 2.5-3% year-over-year (YOY) growth pattern
since the beginning of 2016. eCommerce sales
accounted for approximately 11.5% of retail sales
(excluding auto sales) in 2017. While we expect that
penetration rate to climb to 14.0% by 2019, physical
stores remain vital to retailer survival in this evolving
retail climate. Despite what the media would lead you
to believe, the overall retail industry is still posting
gains even while it faces secular challenges.
Real estate investment in emerging Asian markets grew 49.3% in the first half of 2013 compared to the same period in 2012. Investment was driven mainly by increased land deals in China's tier 2 and 3 cities to support continued urbanization. While sentiment has improved, volatility remains from tapering risks and deficits. State-linked companies account for more investment in emerging markets than institutional investors due to a lack of grade assets. Overall, real estate investment in emerging Asian markets continues to evolve with ongoing assessment of transparency, access and political risks against long-term economic potential.
The document discusses the state of Houston's economy in June 2010. It notes that Houston added jobs for the third consecutive month in April 2010, reducing net job losses. Several sectors saw employment growth, including health care, administrative services, arts and entertainment. Home sales increased due to a federal tax credit and low mortgage rates. While the rig count and international air traffic increased, domestic flights and oil prices declined slightly. Overall, the document indicates that Houston's economy was continuing to recover from the recession in early 2010.
The Harris County Appraisal District mailed property value notices to most residential property owners and will follow with notices for commercial and industrial properties. While some property values increased, the chief appraiser noted many properties did not increase in value this year. Residential property values generally increased, with median home sale prices up 6.5% from last year. Commercial property values varied by sector, with office buildings adjusting due to economic changes and apartment rents remaining flat due to high inventory. Industrial property values depended on specific refining configurations and chemical industry demand.
Trump100 days- Implications for the Property Markets Guy Masse
PRESIDENT TRUMP'S ADMINISTRATION & ITS IMPLICATIONS FOR THE PROPERTY MARKETS
Measuring the success of a new Administration by its first 100 days is a tradition, and President Trump reaches his first key milestone with campaign promises to overhaul Washington and jump-start the economy. This special report provides a perspective on:
How key economic indicators (inflation, job growth) and commercial real estate are performing so far
The status of key policy proposals, including trade and defense
What to watch for beyond the first 100 days
Houston's office market saw positive net absorption of 715,000 SF in Q3 2013, with rental rates increasing citywide. Over 10.5M SF of new office space is under construction. The vacancy rate rose slightly to 15.4% due to new inventory delivery, though CBD vacancy declined. Strong job and economic growth are expected to continue driving demand for office space.
The document discusses commercial real estate lending trends in 2017. It provides an economic overview of 2016, noting that while global economies moderated, the US GDP maintained moderate growth. Consumer spending was the main driver of growth, while business investment declined. Employment gains were strongest in education, professional services, and leisure/hospitality. Lending conditions tightened for commercial real estate due to increased regulatory oversight.
Commercial Real Estate Market Trends - 2017cutmytaxes
The document summarizes commercial real estate market trends for the first quarter of 2017 according to a survey by the National Association of REALTORS. Key points include:
- Sales volume declined 4.4% year-over-year while prices rose 7.2%, indicating a tight market.
- Inventory shortage remained the top challenge.
- Leasing volume rose 2.3% quarter-over-quarter while rates increased 3.8% and concessions fell 11.1%.
- Financing availability returned as a top concern.
Paine Wetzel/TCN 2016 Q4 State of the Market: Central EditionMarc Hale
TCN Worldwide is a consortium of 1,500+ commercial real estate professionals providing services in over 200 markets worldwide. It manages approximately $38.8 billion in transactions and 80 million square feet of space annually. The US economy grew at a moderate 2.3-2.4% in 2017-2018 according to forecasts, with some fiscal stimulus in the short run under the new administration. Commercial real estate transaction volumes declined in the central US region in 2016, with office down 20.6%, industrial down 45.4%, and retail down 9.7% compared to the previous year.
The Vacancy Factor Index for Q2 2016 came in at 72% for June, indicating a marginal rise in vacant properties in high-end neighborhoods of Lagos. The rise was expected given GDP contraction and high rental defaults. Vacancy rates were highest in Lekki, which also has the most developments but few uncompleted projects. Victoria Island had the lowest vacancy due to mixed commercial and residential use. Declines in the index are only expected when GDP and business conditions improve to boost demand.
Houston’s retail market tightens in the second quarter as demand continues to outpace new supply. Avison Young releases 2Q15 retail Market Report. (www.avisonyoung.com/offices/houston)
The National Multifamily Index ranks major U.S. markets based on projected vacancy rates, rent growth, and employment gains. San Francisco and San Jose rank at the top due to strong job growth, low vacancy, and high rents. Markets in the Pacific Northwest and Northeast also rank highly. Atlanta and Riverside-San Bernardino moved into the top 20 due to improving economies and property performance. Midwest markets rank in the lower third despite favorable demand drivers. Supply growth will challenge some markets like Houston and Tampa.
U.S. MarketBeats provide an overview of quarterly CRE activity and trends, a snapshot of current economic and capital market conditions as well as market-level statistics on key metrics.
The U.S. economy in 2016 was characterized by steady growth in the face of uncertainty. The year began with steep declines in global equity markets in response to concerns about a slowdown in China, the Europe replaced Asia as the focal point of global anxiety after the Brexit vote. In the fourth quarter, the U.S. unexpectedly elected Donald Trump as President. Despite uncertainty, the economy continued to add an average of 180,000 jobs per month during 2016.
Houston's industrial market remains healthy, with low vacancy, stable rental rates, and positive absorption. In Q2 2012, net absorption reached 1.8 million SF, pushing the year-to-date total to 3.0 million SF. Leasing activity in Q2 was 3.8 million SF, bringing the mid-year total to 6.7 million SF. The average quoted industrial rental rate decreased slightly to $5.50 per SF NNN, though increased 3.0% year-over-year. With continued job and economic growth, demand for new industrial space is expected to remain high.
Provided geopolitical movement doesn’t derail his best laid predictions, Gordon Orr sees a year of slowing economic growth, headaches for multinationals, demographic anxiety, and buyer’s remorse for soccer tycoons.
Despite rising multifamily construction starts, the current stock of rental units is struggling to meet demand in some areas. This problem is particularly acute for affordable and workforce housing. High construction costs driven by rising land and material prices are inhibiting new supply, especially of more affordable units. Most new multifamily projects consist of high-end apartments, exacerbating the shortage of affordable rentals. To make projects profitable given high costs, developers have focused on acquiring premium sites and pricing new units at the higher end of the market. This concentration of high-cost units in large cities further squeezes the supply of affordable housing.
Houston's office market saw modest growth in Q2 2013, with 286,000 SF of positive net absorption. Absorption was lower than the previous year's quarter but is expected to increase as new developments deliver space later in the year. The overall vacancy rate increased slightly to 14.9% while average rental rates rose to $24.26 per SF. Job and economic growth in Houston remained strong, led by expansion in the energy sector. New office developments totaling over 9 million SF are planned or under construction to accommodate ongoing corporate growth.
This chapter discusses demand, supply, and market equilibrium. It defines key concepts such as demand and supply curves, quantity demanded and supplied, equilibrium price and quantity, excess demand and supply. The chapter explains the laws of demand and supply - that demand curves slope downward and supply curves slope upward. It discusses how individual demand and supply combine to form market demand and supply curves and how equilibrium is reached at the price where quantity demanded equals quantity supplied. The chapter also provides examples and diagrams to illustrate these concepts.
CANADIAN HOME SALES ACTIVITY IMPROVES IN JUNE - 16 JULY 2018Shawn Venasse
The document provides a summary of national residential real estate statistics in Canada. Some key points:
- National home sales rose 4.1% from May to June 2018 but were down 10.7% from June 2017.
- The national average home sale price edged down 1.3% year-over-year in June.
- The unemployment rate was 5.9% at the end of June 2018, trending near record lows.
- The Bank of Canada raised interest rates by 0.25% to 1.5% in July, signaling further hikes are likely.
The office supply-demand imbalance in Houston is expected to continue for at least the next 12 months due to ongoing low oil prices, additional sublease space availability, and sustained construction deliveries. The author notes that overall asking rent fell 1.1% this quarter while availability increased 0.8 percentage points as demand remains weak.
Key Market and Economic Indicators for Canada and United States - September 2016paul young cpa, cga
This presentation will look at both industry metrics as well as economic trends related to Canada and United States.
The presentation will provide information on the economy as part of companies looking for growth options within their business segments.
Houston's strong job growth and healthy economy boosted office leasing activity in 2012. Fourth quarter leasing reached 2.4 million square feet, pushing the annual total past 12.2 million square feet. Vacancy rates declined across the city while rental rates increased slightly. Major transactions included the $175 million sale of the KBR Tower and Modec International leasing 127,000 square feet at Energy Crossing II.
2010 Real Estate Market Forecast: Jed Smith Real Estate Roundtable PresentationKent Simpson
Real estate market forecast for the rest of 2010 provided by Jed Smith, economist for National Association of REALTORS - presented on the Real Estate RoundTable show on BlogTalkRadio March 5, 2010.
With the economy growing at its fastest pace in the current cycle, employers across industries are adding jobs, especially in urban and dense markets where talent is migrating. As a result, expansionary activity remained the dominant driver of leasing in the third quarter, accounting for 57.9 percent of lease transactions.
Houston's industrial market saw positive net absorption of 3 million square feet in the third quarter of 2017. Vacancy rates decreased slightly to 5.4% as demand for distribution and warehouse space continues to grow. Companies like Amazon, DHL, and FedEx absorbed over 1.5 million square feet by opening new distribution and logistics hubs. Over 5 million square feet of new industrial space is under construction, though vacancy rates remain low across several submarkets.
The document summarizes Houston's industrial real estate market performance in Q2 2017. Some key points:
- Vacancy rate increased slightly from 5.3% to 5.5% as absorption slowed.
- Over 1.5 million square feet of new industrial space was delivered in Q2. There is currently 4.2 million square feet under construction, with 77.2% pre-leased.
- Two large new petrochemical plants were announced, reflecting continued growth in that industry in the Houston area.
- Average industrial rental rates decreased slightly both quarterly and annually as more available space entered the market.
Houston's retail market saw negative absorption in the second quarter for the first time in years, driven by bankruptcies like Toys R Us closing stores. However, smaller neighborhood and strip centers saw positive absorption. While vacancies increased slightly, the city's strong job and population growth are expected to fuel retail expansion in the long run. Rents decreased slightly but Houston remains the third strongest retail market nationally due to its affordability and diversity.
Share or view online at colliers.com/houston
Houston’s industrial market continues to expand adding 3.4M SF of new inventory in Q1 2019 with an additional 16.2M SF under construction
Houston's retail market ended 2018 strong with a low vacancy rate of 5.3% and increased activity, though signs of a slowdown have begun to appear with available space and slowing deal flow. While the market remains healthy, existing retail centers will need to be leased before developers start new speculative projects. The pace of the retail market is expected to slow going forward as the cycle peaks, but Houston should remain a strong, vibrant retail market.
Houston's office market posted positive net absorption of 673,000 square feet in Q4 2017, the first positive figure in several years. However, the 2017 yearly total was still negative at -1.7 million square feet due to previous quarters of negative absorption. Vacancy rates decreased slightly to 19.1% from 19.3% over the quarter but remained higher than the 17.5% rate from Q4 2016. Rents for Class A office space decreased slightly to $34.97 per square foot on average.
The retail market in Houston saw a slight increase in vacancy rates in the third quarter of 2017 according to the document. Absorption decreased 66% from the previous quarter while net absorption was 438,000 square feet. Hurricane Harvey in August 2017 disrupted supply chains and retail spending but consumer spending increased in September to replace damaged items. The average quoted retail rental rate in Houston decreased slightly from the previous quarter.
BoyarMiller Breakfast Forum: The Houston Commercial Real Estate Markets – Wha...BoyarMiller
This document provides a summary of the 2018 Houston commercial real estate market outlook presented at the BoyarMiller Real Estate Forum. There is significant capital available for commercial real estate investment and the industrial, multifamily, and experiential retail sectors are expected to perform well. The office market faces challenges from sublease space but is seeing increased investment. The industrial market will continue growing due to e-commerce, new development, and petrochemical activity. Houston may face a multifamily unit shortage as population grows. Retail is adapting to e-commerce through integrated online/physical presences. Overall the outlook for Houston commercial real estate from outside investors remains positive.
This report summarizes Q1 2015 trends in the US national office sector real estate market. It finds that the overall national availability rate rose slightly to 17.0% as new construction increased supply in many markets like Houston and Dallas. Asking rental rates continued to increase nationally and in major cities like New York City and San Francisco driven by new construction and tight supply. The report also discusses how companies are increasingly expanding to lower cost Sunbelt markets in the South and West for access to talent at a lower cost while pursuing the American consumer population growth in these areas.
The document summarizes industrial real estate market trends in Houston, Texas for Q1 2018. It finds that industrial construction activity increased significantly over the quarter, with over 9.2 million square feet completed, driven by demand from companies like Amazon, Walmart, and FedEx. Absorption of occupied space was strong at over 1.5 million square feet during the quarter, while vacancy rates remained low. The industrial market continues to be supported by job and economic growth in the Houston area.
The document provides an analysis of the Austin office market in Q3 2019. It finds that the market saw negative net absorption of 1.1 million square feet, driven mainly by increased vacancies in Class A buildings. Vacancy rates increased across the city to 11.5% overall. Rental rates declined slightly. Absorption was positive in some suburban submarkets. Over 5.7 million square feet of new office space remains under construction, with over 2.6 million square feet already pre-leased. The report concludes that major tech employers continue to expand in Austin, driving the market's growth despite current challenges.
Houston's retail market remains healthy with a vacancy rate of 5.6% in Q1 2017. While some new retail space came online, it was over 60% pre-leased, indicating continued demand. Leasing activity decreased from the previous quarter but job growth in areas like entertainment and retail helped support the market. Developers continued plans for mixed-use and urban projects to attract shoppers.
Tech companies continue to drive growth in Austin's tight office market. Net absorption was 528,811 SF in Q2 2019 despite increasing vacancy. Rents rose to $35.74/SF citywide with several submarkets exceeding $50/SF. New supply is under construction but largely pre-leased, indicating demand will remain strong through 2020 barring economic slowdowns.
The Austin office market saw negative net absorption in Q3 2020, with vacancy rates increasing to 15.2%. Rental rates remained relatively stable but concessions are increasing. While construction remains high and demand is decreasing in the short term, Austin is still attracting companies and is well positioned to recover more quickly than other markets due to its business environment and quality of life.
The document provides an overview of the Austin office market in Q1 2020. It summarizes that the market saw 35,453 SF of negative net absorption in Q1, with large negative absorption in Class A buildings. Vacancy increased to 13.0% citywide. Rental rates increased slightly to $35.93 on average. The report also discusses the impacts of COVID-19 on the market and expectations for Q2 2020.
Austin's office market continues to see large leases for even larger developments. In Q1 2019, Austin reported 1,082 SF of negative net absorption, with major losses in the Class A Northwest submarket. However, the Southeast submarket saw positive absorption due to a large lease. Large leases signed in Q1 included Indeed taking 183,911 SF and Google leasing 150,000 SF. Austin's vacancy rate increased slightly to 10.6% as rental rates decreased to an average of $35.72/SF. Development remains active with over 3 million SF under construction, over half of which is pre-leased.
The Houston industrial market is strengthening in Q3 2010, with positive net absorption of 1.8 million square feet bringing the year-to-date total to 4.4 million square feet. Occupancy increased slightly to 93.9% while quoted rental rates decreased by 0.4% from the previous quarter but were 10.8% lower than Q3 2009 rates. Absorption was strongest in the Northwest and North corridors, while new construction remained limited at only 218,918 square feet under development. The market is expected to continue gradual improvement as the local economy recovers.
Austin's office market saw positive net absorption of 163,796 SF in Q4 2018, bringing the year-to-date net absorption to 29,762 SF. Vacancy rates declined to 10.3% as average rental rates increased to $36.19/SF. A major development was Apple's announcement of a 3,000,000 SF campus in North Austin, which will boost the submarket and Austin's economy. New construction is booming, with 4.26M SF under construction and expectations of continued growth in 2019.
The Austin office market remains fast, competitive, and expensive. Vacancy increased slightly in Q2 2018 while absorption decreased. Rental rates are trending upward, especially in the CBD and Eastside, due to high demand and rising construction costs. Several large leases were signed during the quarter, and more large deals are anticipated as new developments deliver space over the next two years.
JLL Global Market Perspective - November 2018Harrison West
Global real estate markets have exceeded expectations as we enter the final quarter of 2018, with investment and corporate occupier activity set to surpass 2017 and finish the year at their highest levels since 2007. However, there are signs that activity is slowing as we move into 2019 and volumes are likely to moderate next year.
Similar to Q4 2019 | Houston Industrial | Research & Forecast Report (20)
According to the document:
- Office activity has picked up significantly in the past quarter, with demand focused on newer Class A space in the CBD, South Central, and East areas of Austin. This has driven up rental rates in these core areas.
- Sublease space has received significant attention, with many subleases being occupied or nearing lease documentation. This allows tenants to avoid long construction timelines and realize substantial cost savings versus building out their own space.
- Overall vacancy remained at 19.3% as net absorption was negative, but delivery of new supply also slowed, suggesting continued strong demand. Rental rates across Austin increased slightly but remained flat in suburban areas.
The document summarizes commercial real estate market trends in Austin, TX in Q3 2021. Key points include:
- Vacancy rates decreased slightly to 19.2% while net absorption was positive at 705K SF
- Strong demand driven by corporate expansions and relocations is fueling investment in Austin commercial real estate
- Average citywide lease rates increased slightly to $46.16/SF, with higher rates in prime locations
- Over 4.5M SF of new construction is underway to meet continuing strong demand in the market
The industrial market in Austin, TX continued to experience tight supply and strong demand in the second quarter of 2021. Net absorption was 1,006,935 SF while vacancy dropped to 6.6%. However, the large development pipeline will not provide meaningful relief on vacancy until late 2021 and early 2022 as 2.3 million SF is currently under construction. With constrained supply across all size ranges, escalating rents and limited concessions are expected to continue through the rest of the year.
This document provides an overview of the industrial real estate market in Austin, TX for the first quarter of 2021. Key points include:
- Net absorption was 207K SF with vacancy at 7.9%, continuing the positive trends seen in late 2020.
- Population growth in Austin remains very strong at 184 people per day, fueling demand for industrial space from retailers, manufacturers, and logistics companies.
- Over 1.6M SF of new industrial space is under construction, but continued strong demand is expected to absorb space as it delivers through 2022.
The industrial real estate market in Austin saw tremendous growth and demand in 2020, driven primarily by e-commerce including Amazon expanding its footprint six-fold. Additionally, Tesla's announcement of a new gigafactory in Austin increased demand from suppliers. Available big box space over 100,000 SF became scarce as large requirements competed for limited supply. Developers responded by rapidly pursuing new developments to meet rising demand.
The Houston office market continued to contract in Q4 2020 with negative absorption of 836,140 square feet. Vacancy rates increased to 21.7% as the COVID pandemic continued to impact the market. Rental rates remained steady while landlord concessions became more aggressive. The outlook remains uncertain depending on vaccine distribution and return to office trends.
Austin's industrial market saw strong leasing activity and positive net absorption in Q3 2020 despite the effects of the COVID-19 pandemic. Net absorption was 887,476 square feet as large tenants occupied significant space. The vacancy rate decreased from 9.8% to 8.2% while average rental rates slightly decreased citywide. Construction activity also remained high with over 2.3 million square feet under construction across six projects.
The Woodlands office market posted negative net absorption of 130,960 SF in Q3 2020, pushing the year-to-date total to negative 915,333 SF. The average Class A rental rate decreased to $36.85 per SF while the Class B rate increased to $33.42 per SF. Sublease availability rose with 371,974 SF for Class A and 79,878 SF for Class B. Leasing activity declined 43% from the previous quarter.
The Fort Bend commercial real estate market saw modest improvements in the third quarter of 2020. The office vacancy rate declined slightly while absorption and rental rates decreased. Medical office vacancy rose slightly while rental rates increased. Industrial vacancy rose due to new inventory additions, though rental rates increased and absorption was positive. Retail vacancy and negative absorption increased while rental rates rose. Several new commercial projects are under construction.
The Woodlands office submarket in Houston, Texas recorded negative net absorption of 129,342 square feet in the second quarter of 2020, pushing the mid-year 2020 total net absorption to negative 239,835 square feet. Specifically, Class A space saw negative absorption due to a tenant vacating 134,000 square feet, while Class B space recorded negative absorption of 46,053 square feet. Rental rates for both Class A and B space remained stable despite the increase in vacancy rates caused by the negative absorption.
The Fort Bend commercial real estate market saw declines across most sectors in Q2 2020. The office vacancy rate rose to 11.8% with negative absorption, while average rents fell slightly. Medical office vacancy increased to 15.3% while rents rose. Industrial vacancy remained at 9.4% despite positive absorption as new inventory was added. Retail vacancy increased to 6.9% with negative absorption, as average rents grew slightly. Several new commercial projects are under construction across sectors totaling over 1.2 million square feet.
The document discusses how the COVID-19 pandemic has negatively impacted Houston's healthcare real estate market. Healthcare systems have seen their bottom lines impacted by the cancellation of profitable elective surgeries and costs associated with treating COVID-19 patients. As a result, previously planned expansions have been put on hold or scaled back as healthcare providers reduce expenses and medical office leasing activity has slowed. Some construction projects are still moving forward but larger, more ambitious capital projects have been delayed until the effects of the pandemic subside.
Austin's office market saw a large increase in sublease space availability in Q2 2020, with over 100,000 square feet added from several large companies. The sublease availability increased over 40% compared to the start of Q2, reflecting the economic challenges brought on by the COVID-19 pandemic. However, construction continued on projects like Google and Indeed's downtown towers, and Tesla announced plans for a new factory in Austin, showing signs that Austin remains an attractive market. Vacancy rates increased overall to 13.6% as net absorption turned negative, but some submarkets did see positive absorption.
Austin's industrial market posted negative net absorption in Q1 2020 due to space coming online, including at NorthTech Business Center and Amazon leasing a large space. Rental rates increased across flex/R&D and warehouse/distribution spaces. Over 1 million square feet of industrial space remains under construction, with over 800,000 square feet scheduled for delivery in Q2 2020. Vacancy increased slightly to 8.6% as large blocks of space came to the market.
The Woodlands Class A office market recorded positive net absorption of 277,596 square feet in Q1 2020, while Class B properties saw negative net absorption of 391,360 square feet. Rental rates for Class A properties were $38.58 per square foot on average in Q1 2020 compared to $32.18 for Class B. Vacancy rates for Class A were 7.3% compared to 18.6% for Class B.
Discover Yeni Eyup Evleri 2, nestled among the rising values of Eyupsultan, offering the epitome of modern living in Istanbul.
With its spacious living areas, contemporary architecture, and meticulous details, Yeni Eyup Evleri 2 is poised to be the star of your happiest moments. Situated in the new favorite district of Eyupsultan, claim your spot and unlock the doors to a peaceful life alongside your loved ones. Nestled next to the historical and natural beauties of Eyupsultan, embrace the comfort of modern living and rediscover life.
Social Amenities:
Yeni Eyup 2 offers a life filled with joy with its green landscaping areas, gym, sauna, children’s play areas, café, outdoor pool, and basketball court. Reserve your place for unforgettable moments!
Reliable Structure:
With 1+1, 2+1, and 3+1 apartment options, Yeni Eyup Evleri 2 is designed with first-class materials and craftsmanship. The doors to a safe and comfortable life are here! Choose the option that suits you best and step into your dream home.
Project:
Yeni Eyup 2 is conveniently located, with Istanbul Airport just 26 minutes away, the Mecidiyeköy Metro Line 4 minutes away, and the Tram Stop 5 minutes away, making your life easier with its central location.
Location:
Your home is positioned in a privileged location, providing easy access to the city center, shopping malls, restaurants, schools, and other important places.
Yeni Eyup 2 offers 1+1, 2+1, and 3+1 apartment options designed to meet different needs. Find an option suitable for every lifestyle and open the doors to a comfortable life in your dream home.
https://listingturkey.com/property/yeni-eyup-evleri-2/
The SVN® organization shares a portion of their new weekly listings via their SVN Live® Weekly Property Broadcast. Visit https://svn.com/svn-live/ if you would like to attend our weekly call, which we open up to the brokerage community.
Recent Trends Fueling The Surge in Farmhouse Demand in IndiaFarmland Bazaar
Embarking on the journey to acquire a farmhouse for sale is just the beginning; the real investment lies in crafting an environment that contributes to our mental and physical well-being while satisfying the soul. At Farmlandbazaar.com, India’s leading online marketplace dedicated to farm land, farmhouses, and agricultural lands, we understand the importance of transforming a humble farmland into a warm and inviting sanctuary. Let's explore the fundamental aspects that can elevate your farmhouse into a tranquil haven.
AVRUPA KONUTLARI ESENTEPE - ENGLISH - Listing TurkeyListing Turkey
Looking for a new home in Istanbul? Look no further than Avrupa Konutlari Esentepe! Our beautifully designed homes provide the perfect blend of luxury and comfort, making them the perfect choice for anyone looking for a high-quality home in the city.
With a wide range of apartment types available, from 1+1 to 4+1, we have something to suit every need and budget. Each apartment is designed with attention to detail and features spacious and bright living areas, making them the perfect place to relax and unwind after a long day.
One of the things that sets Avrupa Konutlari Esentepe apart from other developments is our focus on creating a community that is both comfortable and convenient. Our homes are surrounded by lush green spaces, perfect for enjoying a peaceful stroll or having a picnic with friends and family. Additionally, our complex includes a variety of social and recreational amenities, such as swimming pools, sports fields, and playgrounds, making it easy for residents to stay active and socialize with their neighbors.
https://listingturkey.com/property/avrupa-konutlari-esentepe/
BEST FARMLAND FOR SALE | FARM PLOTS NEAR BANGALORE | KANAKAPURA | CHICKKABALP...knox groups real estate
welcome to knox groups real estate company in Bangalore. best farm land for sale near Bangalore and madhugiri . Managed farmland near Kanakapura and Chickkabalapur get know more details about the projects .Knox groups is a leading real estate company dedicated to helping individuals and businesses navigate the dynamic real estate market. With our extensive knowledge, experience, and commitment to excellence, we deliver exceptional results for our clients. Discover the perfect foundation for your agricultural aspirations with KNOX Groups' prime farm lands. These aren't just plots; they're the fertile grounds where vibrant crops flourish, livestock thrives, and unique agricultural ventures come to life. At KNOX, we go beyond selling land we curate sustainable ecosystems, ensuring that your journey toward agricultural success is seamless and prosperous.
Serviced Apartment Ho Chi Minh For RentalGVRenting
GVRenting is the leading rental real estate company in Vietnam. We help you to find a serviced apartment for rent in Ho Chi Minh & Saigon. Discover our broad range of rental properties in Vietnam.
For more details https://gvrenting.com/
Q4 2019 | Houston Industrial | Research & Forecast Report
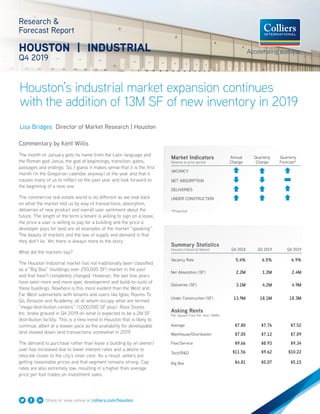
1. Share or view online at colliers.com/houston
Houston’s industrial market expansion continues
with the addition of 13M SF of new inventory in 2019
Research &
Forecast Report
HOUSTON | INDUSTRIAL
Q4 2019
Lisa Bridges Director of Market Research | Houston
Commentary by Kent Willis
The month of January gets its name from the Latin language and
the Roman god Janus, the god of beginnings, transition, gates,
passages and endings. So, I guess it makes sense that it is the first
month (in the Gregorian calendar anyway) of the year and that it
causes many of us to reflect on the past year and look forward to
the beginning of a new one.
The commercial real estate world is no different as we look back
on what the market told us by way of transactions, absorption,
deliveries of new product and overall user sentiment about the
future. The length of the term a tenant is willing to sign on a lease,
the price a user is willing to pay for a building and the price a
developer pays for land are all examples of the market “speaking”.
The beauty of markets and the law of supply and demand is that
they don’t lie. Yet, there is always more to the story.
What did the markets say?
The Houston Industrial market has not traditionally been classified
as a “Big Box” (buildings over 250,000 SF) market in the past
and that hasn’t completely changed. However, the last few years
have seen more and more spec development and build-to-suits of
these buildings. Nowhere is this more evident than the West and
Far West submarkets with tenants and users like Igloo, Rooms To
Go, Amazon and Academy, all of whom occupy what are termed
“mega-distribution centers” (1,000,000 SF plus). Ross Stores
Inc. broke ground in Q4 2019 on what is expected to be a 2M SF
distribution facility. This is a new trend in Houston that is likely to
continue, albeit at a slower pace as the availability for developable
land slowed down land transactions somewhat in 2019.
The demand to purchase rather than lease a building by an owner/
user has increased due to lower interest rates and a desire to
relocate closer to the city’s inner core. As a result, sellers are
getting reasonable prices and that segment remains strong. Cap
rates are also extremely low, resulting in a higher than average
price per foot trades on investment sales.
Summary Statistics
Houston Industrial Market Q4 2018 Q3 2019 Q4 2019
Vacancy Rate 5.4% 6.5% 6.9%
Net Absorption (SF) 2.2M 1.2M 2.4M
Deliveries (SF) 3.1M 4.2M 4.9M
Under Construction (SF) 13.9M 18.1M 18.3M
Asking Rents
Per Square Foot Per Year (NNN)
Average $7.80 $7.76 $7.52
Warehouse/Distribution $7.05 $7.12 $7.09
Flex/Service $9.66 $8.93 $9.34
Tech/R&D $11.56 $9.62 $10.22
Big Box $4.81 $5.07 $5.15
Market Indicators
Relative to prior period
Annual
Change
Quarterly
Change
Quarterly
Forecast*
VACANCY
NET ABSORPTION
DELIVERIES
UNDER CONSTRUCTION
*Projected
2. Change in Sales (Year over Year)
Average Price Per SF
$40
$50
$60
$70
$80
$90
$100
United States Houston
Average CAP Rate
4.0%
4.5%
5.0%
5.5%
6.0%
6.5%
7.0%
7.5%
8.0%
8.5%
United States Houston
-100.0%
-50.0%
0.0%
50.0%
100.0%
150.0%
200.0%
250.0%
300.0%
Houston United States
2 Houston Research & Forecast Report | Q4 2019 | Industrial | Colliers International
Sales Activity
Source: Real Capital Analytics Q4 2019
NO. OF PROPERTIES: 31
SALES VOLUME: $244.4M
AVERAGE $/SF: $79
AVERAGE CAP RATE: 6.8%
Job Growth & Unemployment
(not seasonally adjusted)
UNEMPLOYMENT 11/18 11/19
HOUSTON 3.8% 3.6%
TEXAS 3.5% 3.3%
U.S. 3.5% 3.3%
Oilfield pain….
As everyone knows, oil is king in Texas and Houston is known around the globe
as the Energy Capital of the World. And nowhere in the world has more oilfield
service companies than Houston. 2019 will be known as a year of consolidation
in the industry. The price of oil in 2019 rose from $45.15 per barrel (12/2018) to
$61.66 per barrel (12/2019). In November of 2019, the US became a net exporter
of all oil products, including both refined petroleum products and crude oil and
the resulting effect has been a stable oil price hovering around $60 per barrel.
Capital expenditures in the oilfield have tightened, meaning layoffs. Consolidations
that occurred resulted in companies eliminating redundancies in their operations,
which for the industrial real estate market meant downsizing and merging of
facilities.
Overbuilt?
The main thing you will hear almost unanimously across town is that spec
development of bulk distribution space has outpaced demand and that is cause
for some worry among real estate professionals. As of January 2020, there
is about 21M SF under construction in Houston. While many brokers noticed a
slowdown in deal volume over the summer and the early fall of 2019, most agree
that Q4 2019 saw an increase in tenants actively searching for space, which is
thankfully carrying over into 2020. The Far East and Baytown submarkets (and
other submarkets where large spec developments have occurred) will force
Landlords to “get creative”, which means readjusting their proformas or getting
very aggressive on lease rates and incentives- essentially becoming a Tenants
market as they say.
In Summary…
Here is a quick way to “put the pieces together” and summarize the state of the
Houston Industrial market:
According to NAIOP, 60% of the total U.S. demand for industrial space is
coming from just five industries: logistics and distribution, food and beverage,
e-commerce distribution, third party logistics (or 3PL’s), and traditional retailers.*
Hence, the emergence of Katy/Brookshire area as a Big Box market, as discussed
above.
Now couple that with the continued low cost of feedstocks for the petrochemical
industry that has driven demand on the Port of Houston and East side markets
and the need for plastics and packaging materials. Once products are produced
and packaged, they need to be shipped. But the 3PL’s cannot do all the work,
which has led to an “explosive 84% year-over-year growth” of “in-house and
distribution demand” according to the NAIOP report. *This bodes well for
Houston’s Industrial market in the coming months, albeit with some caution. The
good news is that recent history tells us that Houston seems to have been less
affected by the past recessions than the rest of the country and likely could do so
in the face of another one.
The mythical god Janus was often depicted in statues and drawings as having
two faces, looking to the past, but also to the future. The general sentiment from
other brokers around Houston is that 2019 was a “healthy” and overall solid year
with a decent amount of active requirements in the market today.
JOB GROWTH
Annual
Change
# of Jobs
Added
HOUSTON 2.7% 85.5K
TEXAS 2.7% 343.0K
U.S. 1.5% 2.2M
3. Change in Sales (Year over Year)
Average Price Per SF
$40
$50
$60
$70
$80
$90
$100
United States Houston
Average CAP Rate
4.0%
4.5%
5.0%
5.5%
6.0%
6.5%
7.0%
7.5%
8.0%
8.5%
United States Houston
-100.0%
-50.0%
0.0%
50.0%
100.0%
150.0%
200.0%
250.0%
300.0%
Houston United States
3 Houston Research & Forecast Report | Q4 2019 | Industrial | Colliers International
Sales Activity
Source: Real Capital Analytics Q4 2019
NO. OF PROPERTIES: 31
SALES VOLUME: $244.4M
AVERAGE $/SF: $79
AVERAGE CAP RATE: 6.8%
Job Growth & Unemployment
(not seasonally adjusted)
UNEMPLOYMENT 11/18 11/19
HOUSTON 3.8% 3.6%
TEXAS 3.5% 3.3%
U.S. 3.5% 3.3%
Vacancy & Availability
On an annual basis, Houston’s average industrial vacancy rate increased 150
basis points from 5.4% in Q4 2018 to 6.9% in Q4 2019 and by 40 basis points
quarterly from 6.5% in Q3 2019. At the end of the fourth quarter, Houston had
38.8M SF of vacant industrial space for direct lease and an additional 2.2.M SF of
vacant space for sublease. Among the major industrial corridors, the Inner Loop
Corridor had the lowest vacancy rate at 4.5%, followed by the South Corridor at
5.3%. The submarket with the largest percentage of vacant space is the North
Corridor, which had a 8.4% vacancy rate.
Absorption & Demand
Houston’s industrial market posted 2.4M SF of positive net absorption in the
fourth quarter, pushing the year-end total absorption to 8.7M SF. Some of the
tenants that relocated or expanded in Q4 2019 include COE Distributing, moving
into 238,000 SF in the Northwest Corridor, Daxwell Distribution moving into
171,700 SF in the Northwest Corridor and Exclusive Furniture moving into
156,000 SF in the Southwest Corridor.
The majority of fourth-quarter positive net absorption occurred in the Northwest
Corridor, recording 2.2M SF. The North, Northeast and South Corridors also
reported positive net absorption in the fourth quarter of 2019. The Inner Loop,
Southeast and Southwest Corridors recorded negative net absorption. 4.9M SF
of new inventory delivered during the quarter. The North Corridor had the most
significant amount of new inventory, 1.7M SF, delivered during the fourth quarter.
Rental Rates
According to our data service provider (CoStar Property), Houston’s citywide
average quoted industrial rental rate for all product types decreased from $7.76
per SF NNN to $7.52 per SF NNN over the quarter. According to Colliers’ internal
data, actual lease transactions are in the $4.68 – $5.28 per SF NNN range for
newer bulk industrial spaces, while flex rates range from $7.20 to $10.80 per
SF NNN depending on the existing improvements or the allowance provided for
tenant improvements and the age and location of the property.
Based on data from our data service provider, the average quoted NNN rental
rates by property type are as follows: $7.09 per SF for Warehouse Distribution
space, $9.34 per SF for Flex/Service space, Tech/R&D space averaging $10.22
per SF and $5.15 per SF for Big Box.
JOB GROWTH
Annual
Change
# of Jobs
Added
HOUSTON 2.7% 85.5K
TEXAS 2.7% 343.0K
U.S. 1.5% 2.2M
4. 4 Houston Research & Forecast Report | Q4 2019 | Industrial | Colliers International44
Q4 2019 Industrial Lease Transactions over 100,000 SF
BUILDING NAME/ADDRESS SUBMARKET SF TENANT LEASE DATE
Victory Commerce Center East-Southeast Outlier 349,050 Wholesome Sweetners1,2
Dec-19
West Ten Business Park - Bldg 3 Northwest Outlier 238,000 Amazon.com Services1
Oct-19
300 S Sheldon East I-10 Outer Loop 180,000 Gerber Plumbing Fixtures1
Oct-19
1403 Gillingham Ln - Bldg 1 Sugar Land 148,921 Scope Imports1
Nov-19
Claymoore Distribution Center Northwest Inner Loop 124,050 Owens & Minor3
Oct-19
Pinto Business Park North Fwy/Tomball Pky 123,330 BGI1
Dec-19
Allied Power Building Northwest Hwy 6 113,000 Allied Power Group3
Oct-19
5901 Griggs Rd South Inner Loop 101,707 Supply Chain Warehouse LLC1
Oct-19
Leasing Activity
According to our data service provider (CoStar Property), Houston’s industrial leasing activity decreased over the quarter from 7.2M SF
in Q3 2019 to 5.7M SF in Q4 2019. The decrease in leasing activity can be attributed to more owner/users in the market. Most of the Q4
2019 transactions consisted of leases for 50,000 SF or less; however, there were several larger deals that occurred. The table below
highlights some of the larger transactions that closed in Q4 2019.
1
Direct/New
Under Construction
Currently, 18.3M SF of industrial space is under construction in Houston with 38.9% of this space pre-leased. The largest project
under construction is a 1,300,000-SF distribution warehouse for Medline Industries which is being developed by Clay Development &
Construction. The majority of projects under construction are located in the Southeast, Southwest and North Corridor submarkets and are
between 25,000-150,000 SF. Below is a partial list of the largest buildings currently under construction.
2
Colliers International Transaction 3
Expansion/Renewal
Q4 2019 Industrial Under Construction - 300,000 SF or greater
BUSINESS PARK/ADDRESS SUBMARKET RBA
% LEASED/
OWNED
DEVELOPER/CONTRACTOR
DELIVERY
DATE
BUILDING DESCRIPTION
31207 Kingsland Blvd Sugar Land/Brookshire 2,165,000 100% Ross Stores Inc Feb-21 Ross Distribution Center
Pederson Distribution Park Northwest Outlier 1,300,000 100% Clay Development & Construction Dec-20 Medline Industries
Pinto Business Park North Fwy/Tomball Pky 1,000,000 100% Hines Feb-20 BTS Coca-Cola Southwest
Beverages
Conroe Park North Industrial
Park
The Woodlands/Conroe 860,000 100% Ryan Companies US, Inc. Dec-20 BTS Five Below
Bay Area Business Park East-Southeast Far 784,000 0.0% Stream Realty Jun-20 Spec Warehouse
Grand National Business Park -
Fallbrook Dr
Hwy 290/Tomball Pky 770,640 100% Hines Apr-20 BTS Home Depot Distribution
Center
Generation Park Northeast Hwy 90 648,720 0% Lincoln Property Company Sep-20 Spec Distribution
Cedar Port Logistics East-Southeast Far 644,000 0.0% Avera Companies May-20 Spec Warehouse
Bayport South Business Park -
10591 Red Bluff Rd
East-Southeast Far 642,994 0.0% Panattoni Development Company Mar-20 Spec Warehouse
1919 S Fm 565 Rd East-Southeast Far 604,800 100% DVO Jun-20 BTS Katoen Natie
Kennedy Greens Distribution
Center I
North Outer Loop 524,160 0.0% Clay Development & Construction Feb-20 Spec Distribution Warehouse
I-10 & Pin Oak Rd Northwest Outlier 498,700 100.0% American Furniture Warehouse Mar-20 American Furniture Warehouse
Park 249 - Bldg 1 Hwy 290/Tomball Pky 443,520 0.0% Panattoni Apr-20 Spec Distribution Warehouse
Clay 99 - Bldg 5 Northwest Outlier 433,200 0.0% Duke Realty Corporation Feb-20 Spec Distribution
Ella Logistics Center North Fwy/Tomball Pky 358,567 0.0% Hines Jan-20 Spec Distribution Warehouse
Deerwood Glen Business Park East-Southeast Far 308,225 100% Clay Development & Construction Mar-20 BTS CAP Barbell
7. 7 Houston Research & Forecast Report | Q4 2019 | Industrial | Colliers International7
Our philosophy
revolves around the fact
that the best
possible results come
from linking our global
enterprise with
local advisors who
understand your
business, your market,
and how to
integrate real estate
into a successful
business strategy.
C O L L I E R S I N T E R N A T I O N A L G L O B A L L O C A T I O N S
COMMERCIAL REAL ESTATE SECTORS REPRESENTED
OFFICE
INDUSTRIAL
LAND
RETAIL
HEALTHCARE
MULTIFAMILY
HOTEL
$127BTRANSACTION VALUE
2BSF UNDER MANAGEMENT
$3.3BIN REVENUE
438OFFICES
17,300PROFESSIONALS
340ACCREDITED MEMBERS
68COUNTRIES
SIOR
ADVANTAGE
Colliers International (NASDAQ, TSX: CIGI) is a leading global real estate services
and investment management company. With operations in 68 countries, our 14,000
enterprising people work collaboratively to provide expert advice and services to
maximize the value of property for real estate occupiers, owners and investors. For
more than 20 years, our experienced leadership team, owning more than 40% of our
equity, have delivered industry-leading investment returns for shareholders. In 2018,
corporate revenues were $2.8 billion ($3.3 billion including affiliates), with more than
$26 billion of assets under management.
Colliers professionals think differently, share great ideas and offer thoughtful and
innovative advice to accelerate the success of its clients. Colliers has been ranked
among the top 100 global outsourcing firms by the International Association of
Outsourcing Professionals for 13 consecutive years, more than any other real estate
services firm. Colliers is ranked the number one property manager in the world by
Commercial Property Executive for two years in a row.
PROPERTY POSITIONING
& MARKETING
REAL ESTATEINVESTMENT
VALUATION&
ADVISORY
CORPORATE
SOLUTIONS
MANAGEMENT
REALESTATE
REPRESENTATION
LANDLORD
REPRESENTATION
TENANT
LOCA
TION
INTELLIGENCE
M
A
RKET
RESEARCH&
MARKETS
PROJECT
MANAGEMENT
COLLIERS
SPECIALIZATIONS
and
REAL ESTATE SERVICE
REPRESENTATION
DATACENTERS
HE
ALTHCARE
HOTELS & HOSPITALITY SERVICES
IN
DUSTRIAL
LAND
HOUSING&MULTIFAMILY
SER
VICES
MARINA, LEISURE & GOLF COURSE
OFFICE
RETAIL
SPECIALPURPOSE