Welcome to the Cushman & Wakefield Atlas Outlook 2016,
an update on the International Investment Atlas that reviews
how the market performed last year and, more particularly,
what we should anticipate for the year ahead.
We have examined a series of questions when approaching this publication:
what are the key forces driving and transforming the global market? Who will be
the winners in this volatile environment? How should a subsequent investment
strategy be most advantageously aligned?
Of course, in a highly uncertain but fast changing world, the need for insightful
research is increased – but the task of delivering a robust and well-considered
view is made more difficult. By bringing together expert opinion from across our
capital markets, occupier and research teams around the world, we have sought
to answer this challenge and hope you agree we have delivered a concise but
thoughtful review of the state of the market and the outlook for the year ahead.
-U.S. Office Market Was Driven by the Tech
Sector in the Fourth Quarter of 2018
-Absorption exceeds construction completions, vacancy
declines and the pipeline grows
-Tech markets tighten
-Rents rise, but the pace slows:
Retail Lives
Economic fundamentals continue to strengthen in the
U.S., a trend that is expected to endure through
mid-2019. With continued wage growth acceleration
and consumer confidence near an 18-year high, the
retail marketplace has registered solid spending.
Inflation-adjusted consumer expenditures show a
steady 2.5-3% year-over-year (YOY) growth pattern
since the beginning of 2016. eCommerce sales
accounted for approximately 11.5% of retail sales
(excluding auto sales) in 2017. While we expect that
penetration rate to climb to 14.0% by 2019, physical
stores remain vital to retailer survival in this evolving
retail climate. Despite what the media would lead you
to believe, the overall retail industry is still posting
gains even while it faces secular challenges.
U.S. MarketBeats provide an overview of quarterly CRE activity and trends, a snapshot of current economic and capital market conditions as well as market-level statistics on key metrics.
The U.S. economy in 2016 was characterized by steady growth in the face of uncertainty. The year began with steep declines in global equity markets in response to concerns about a slowdown in China, the Europe replaced Asia as the focal point of global anxiety after the Brexit vote. In the fourth quarter, the U.S. unexpectedly elected Donald Trump as President. Despite uncertainty, the economy continued to add an average of 180,000 jobs per month during 2016.
Trump100 days- Implications for the Property Markets Guy Masse
PRESIDENT TRUMP'S ADMINISTRATION & ITS IMPLICATIONS FOR THE PROPERTY MARKETS
Measuring the success of a new Administration by its first 100 days is a tradition, and President Trump reaches his first key milestone with campaign promises to overhaul Washington and jump-start the economy. This special report provides a perspective on:
How key economic indicators (inflation, job growth) and commercial real estate are performing so far
The status of key policy proposals, including trade and defense
What to watch for beyond the first 100 days
Another Year Another Medal
U.S. industrial absorption is on track to finish 2018 with its third
strongest net occupancy growth, behind only 2016 and 2014.
Considering the strong economic fundamentals, there is no
indication that demand will soften in the final quarter of 2018.
This means that the three strongest years of industrial
occupancy growth since the 1980s will have occurred in the last
five years. Looking forward, the combination of limited new
product and high utilization rates of existing footprints will
translate to strong performance for Class A product and
improved performance for Class B and C product.
Capital Markets Insights: Credit Availability for the Middle Market Remains R...Duff & Phelps
Recent trimming in first lien debt appetite resulted in a higher proportion of second lien and junior debt in capital structures. The fuller covenant packages typical of the private market, combined with unabated growth in private investor capital formation, have served to differentiate middle market conditions from those of the broader liquid markets. While the weighted average cost of debt for middle market issuers has increased modestly, credit availability — both in terms of leverage multiples and cost — is robust.
The world’s dominant commercial real estate markets have moved into 2014 in better shape than at any time since the Global Financial Crisis of 2008-2009.
Capital markets are exhibiting remarkable strength and the disconnect, that has emerged over the past two years between a more cautious occupational market, is showing signs of narrowing.
The U.S. Tech sector’s new record high has brought back memories of the dot-com bubble. But unlike then,
today’s Tech sector is not propped up by fanciful talk. It’s led by companies that are truly transforming the
economy and our lives.
The overall outlook for 2017 Canadian M&A activity remains moderately positive, despite the decrease in the number of Canadian companies sold in 2016. Corporate balance sheets are flush with cash, with corporations actively looking for quality investments. Interest rates remain low, and oil prices are showing signs of improvement. Private Equity firms also have large cash holdings and often see Canadian firms as good "bolt-on" opportunities. Read the report for more detail on trends, public market performance and deal activity.
Carter Jonas New Homes Residential View - Winter 2016Lee Layton
What type of new homes are we building, where are we building them and are they the right type of property for their local market? These are three important questions that we
aim to answer in the latest edition of the Carter Jonas New Home Residential View.
Welcome to the Cushman & Wakefield Atlas Outlook 2016,
an update on the International Investment Atlas that reviews
how the market performed last year and, more particularly,
what we should anticipate for the year ahead.
We have examined a series of questions when approaching this publication: what are the key forces
driving and transforming the global market? Who will be the winners in this volatile environment?
How should a subsequent investment strategy be most advantageously aligned?
Of course, in a highly uncertain but fast changing world, the need for insightful research is
increased – but the task of delivering a robust and well-considered view is made more difficult. By
bringing together expert opinion from across our capital markets, occupier and research teams
around the world, we have sought to answer this challenge and hope you agree we have delivered a
concise but thoughtful review of the state of the market and the outlook for the year ahead.
Naturally, any research can only be enhanced by further industry insight. To help us continuously
improve our Atlas Outlook, we would value your thoughts, comments or suggestions. Feel free to
share these via our Cushman & Wakefield social media
channels or by contacting our capital markets or research teams directly.
WINNING IN GROWTH CITIES /ACushman & Wakefield Capital Markets Research Publi...Guy Masse
This report has been prepared by the Research and
Capital Markets teams at Cushman & Wakefield to
identify the winning cities in today’s international real
estate investment market. The executive summary
looks at the largest and fastest growing cities in
investment terms and the differences in pricing,
as well as demand and activity between sectors.
Read and follow the top economic indicators for Vietnam, M&A activity, and major developments in finance, banking, and legal. Published Monthly with contribution from LNT & Partners Law Firm.
China Q12014 Macro Update - tracking key economic statisticsElias Glenn
China in Numbers – Macro Update, 1Q14 Review
March Data vs. Consensus Estimates
Tertiary Industry Accounts for Nearly Half of GDP – Most in Over 20 Years
Investment Growth Declines, Trade Data Disappoints
CPI Ticks Up, Money Supply Growth Slows
Domestic stock markets decline in 1Q
Key Data : NBS, NDRC, China Customs, Brokers, CapitalVue
Microclimates of opportunity - Real estate & construction report 2014Misbah Hussain
This report draws on more than 700 interviews with business leaders in 45 economies to understand how the real estate & construction sector is recovering from the financial crisis, where the opportunities lie and what businesses are doing to keep their operations running
smoothly and free from fraud.
North America Industrial Construction Cost Guide 2023Guy Masse
North America Industrial Construction Cost Guide 2023.
An essential tool to guide capital expense decisions for industrial real estate
Cushman & Wakefield’s Industrial Construction Cost Guide provides an indication of the construction costs in the industrial sector for 43 key cities in the United States, Canada and Mexico. The Guide, compiled by our Project & Development Services team, gives insight into the factors driving the industrial real estate market, and gives insight for capital planning.
While the North American industrial sector faces the challenges of rising costs, material shortages and labor shortages, demand for industrial space remains strong. The sector may face a potential cooling down in the long term, but the construction pipeline is expected to remain robust, with a focus on modern, efficient facilities that can meet the needs of a changing market.
Highlights of the report:
Economic Overview
Strong demand for industrial properties driven by e-commerce
Competition for materials and inflationary pressures driving construction costs higher
March 2022 Labour Market Survey Highlights
• Employment rose by 73,000 in March, driven by an increase in full-time work.
• Employment rose in both the services-producing and the goods-producing sectors.
• Total hours worked rose 1.3% in March.
• The unemployment rate fell 20 basis points to 5.3% in March, the lowest rate on record since comparable data became available in 1976.
• The proportion of workers who report that they usually work exclusively from home continued to decline, down 180 basis points to 20.7%.
Cushman & Wakefield Toronto Americas Marketbeat Office Q1 2019 Guy Masse
Outlook
Given low availability, robust demand, and little relief from new
supply, the office story in Downtown Toronto is expected to remain
one of historically tight conditions and rising rental rates. On the
suburban front, availability is expected to trend upward in GTA
West as over 800,000 square feet (sf) hits the market in the second
half of 2019. GTA East will continue to see a moderate performance
with less than 200,000 sf of space tracked to become available this
year.
Outlook
While not as robust as 2018, the market is expected to
maintain its momentum over the course of 2019. Although
market conditions are increasingly becoming landlord
favourable, the market remains quite competitive. Large
occupiers seeking space in the Central area are now looking
to new developments to satisfy their needs as there are very
few large contiguous blocks of available space left in the
market. In the Financial Core, only six options for tenants
seeking 50,000+ sf of space remain. Despite the
disappearance of large available space options and the
significant downward pressure on vacancy rates, landlords
have only marginally increased rent expectations at
approximately 2% annually. A slight year-over-year increase in
average net asking rates is anticipated as a result of Class
AAA deliveries; however, the range of rates is not expected to
change
The hottest CBD markets saw overall expansionary momentum easing back of over the first quarter, consistent with what is happening in the overall economy. Interestingly, suburban markets saw a significant uptick in expansionary momentum. This shifting momentum is due to a lack of available space within key gateway central markets, where demand has outpaced supply for some time.
KEY HIGHLIGHTS
• Vancouver’s tight CBD markets saw Class A availability hit a historic low of 1.4%.
• Montreal saw expansionary growth drive CBD Class A availability to a cycle low of 5.9%. Way to go Montreal!
• Downtown Toronto saw negative absorption over the first quarter of 2019.
• Toronto’s downtown market has close to 12 million square feet of new supply in the pipeline, arriving between now and 2024.
• With limited options available in Vancouver and Toronto’s CBD markets, many tenants are committing to available space now to secure their future expansionary growth.
Cushman & Wakefield's Canadian Office Statistical Summary Q4 2018Guy Masse
Q4 2018
Canadian Office Statistical Summary
Driven by buoyant demand from technology companies, extremely tight CBD markets in both Vancouver and Toronto got even tighter over the final quarter of the year, helping drive the National CBD vacancy rate to 8.7% - its lowest point since Q3 2015!
KEY HIGHLIGHTS
• Canadian CBD Class A markets saw absorption of 3.6 msf in 2018, with a fourth quarter contribution of 1.5 msf. This is the strongest premium space growth since 2011.
• The arrival and partial occupancy of Stantec Tower helped drive Q4 2018 absorption in Edmonton’s downtown market to above 800,000 sf, with a final year-end 2018 tally of 1.2 msf.
• Although Calgary continues to see modest momentum in its CBD market, Suburban markets had a strong year with absorption reaching 337,000 sf. This drove vacancy to 16.9% from 19.4% one-year-ago.
• Vacancy in Downtown Toronto reached an incredibly tight 1.9% in Q4, a vacancy rate not seen in over 35 years. Conditions are expected to remain extremely tight until late 2020 when the first in a 10.7 msf wave of new developments will begin to hit the downtown market.
• Downtown Vancouver, another hot market driven by technology growth, saw its vacancy decline to 2.3% in Q4; its lowest point since Q2 2008. Like Toronto, little relief for tenants is not anticipated until the next wave of downtown new supply begins to arrive in late 2020.
C&W REAL ESTATE MARKET REPORTS : WORKPLACE 2025 #CREGuy Masse
Visualizing the workplace in 2025 starts with the realization that planning for that reality starts today. People today can work from anywhere, at any time so offices now must compete with other workplace options. When workers do go into the office they want a work environment to complement their work-life experience – and in a place where they feel valued, connected and supported. It’s all about people – and it’s closer than you think.
Cushman & Wakefield Q12018 Canadian Office Statistical SummaryGuy Masse
Q1 2018 Canadian Office Statistical Summary
Turning Up the Heat
The summer arrived about nine years ago for many Canadian office markets, marking one of the longest growth cycles on record. With CBD availability rates plunging as low as 2.5% in Toronto and 4.3% in Vancouver, the heat has intensified. Meanwhile, oil-producing markets are seeing the first signs of recovery.
KEY HIGHLIGHTS:
• After enduring a grinding bust cycle, top oil-producing markets -- Calgary, Edmonton, and St. John’s -- reached high-water CBD availability marks of 23.7%, 14.1%, and 26.7%, respectively. CBD Edmonton will see the Stantec Tower arrive in Q3 2018, pushing availability towards 20%.
• With oil prices gaining some buoyancy in recent months and CBD Calgary expected to hit peak availability by early 2019, expectations are growing that absorption will begin shifting to the positive side over the next few quarters.
• Remarkably, CBD Toronto saw the strongest absorption of the quarter, reaching close to 300,000 square feet (sf). Both Toronto and Vancouver downtown markets will remain notoriously tight until at least 2021.
• Of the major markets, Vancouver did it again, posting the strongest suburban expansionary momentum in the country, totaling about 300,000 sf. The runner up, surprisingly, was Calgary, where suburban absorption hit 115,000 sf over the quarter. Green shoots!
U.S. MarketBeats provide an overview of quarterly CRE activity and trends, a snapshot of current economic and capital market conditions as well as market-level statistics on key metrics.
The U.S. economy in 2016 was characterized by steady growth in the face of uncertainty. The year began with steep declines in global equity markets in response to concerns about a slowdown in China, the Europe replaced Asia as the focal point of global anxiety after the Brexit vote. In the fourth quarter, the U.S. unexpectedly elected Donald Trump as President. Despite uncertainty, the economy continued to add an average of 180,000 jobs per month during 2016.
Rixos Tersane Istanbul Residences Brochure_May2024_ENG.pdfListing Turkey
Tersane Suites Residences is a luxurious real estate project located in the heart of Istanbul, next to the beautiful Golden Horn. This unique development offers hotel concept residences with Rixos management, making it the perfect choice for both homeowners and investors.
The Tersane Suites Residences offers a wide range of options, from studio apartments to spacious four-bedroom units, all designed to the highest standard. The suites are finished with high-quality materials and feature modern, open-plan living spaces, fully-equipped kitchens, and large balconies with stunning views of the city and sea.
One of the standout features of Tersane Suites Residences is the Rixos management, which provides a truly exclusive and upscale living experience. Residents will have access to a range of luxury amenities, including a fitness center, spa, and indoor and outdoor swimming pools. Plus, the on-site restaurants and cafes provide a taste of the local and international cuisine.
The Tersane Suites Residences also offers a great opportunity for investors, as it provides a rental guarantee program. This means that investors can enjoy a steady income stream, with the peace of mind that their property is being managed by a reputable and experienced team.
The location of Tersane Suites Residences is also unbeatable, with easy access to the city’s main transportation links and within close proximity to the historic center, making it the perfect base for exploring all that Istanbul has to offer.
Rams Garden Bahcelievler - Istanbul - ListingTurkeyListing Turkey
Implemented by Rams Global in Bahcelievler, the Rams Garden Bahcelievler Apartments includes 796 residences of different types from 2+1 to 5+1.
Next to the project, which will have 33 thousand square meters of green area, there will be 42 thousand 300 square meters of woodland. There will also be a 210-meter-long pond in the landscape of the project. There are 94.5 square meters of green space per flat.
Rams Garden Bahcelievler Apartments, which has 8 times more green space than the average of Istanbul with its 33 thousand square meters of green area located within a total of 75 thousand square meters, offers various housing options from 2+1 to 5+1.RAMS Garden has brought a lifeline to the construction industry.
Rams Global, which has signed projects in many places from Dubai to Phuket and delivered more than 20 thousand residences, is now starting new projects in Istanbul.
Rams Garden Bahcelievler is located 9 minutes from Metroport AVM, 5 minutes from Marmara Forum AVM, 12 minutes from Kazlıçeşme beach, 9 minutes from Yıldız Technical University, 7 minutes from Istinye University, 9 minutes from Ramada Hotel and Medicana Hospital.
https://listingturkey.com/property/rams-garden-bahcelievler-apartments/
Recent Trends Fueling The Surge in Farmhouse Demand in IndiaFarmland Bazaar
Embarking on the journey to acquire a farmhouse for sale is just the beginning; the real investment lies in crafting an environment that contributes to our mental and physical well-being while satisfying the soul. At Farmlandbazaar.com, India’s leading online marketplace dedicated to farm land, farmhouses, and agricultural lands, we understand the importance of transforming a humble farmland into a warm and inviting sanctuary. Let's explore the fundamental aspects that can elevate your farmhouse into a tranquil haven.
Serviced Apartment Ho Chi Minh For RentalGVRenting
GVRenting is the leading rental real estate company in Vietnam. We help you to find a serviced apartment for rent in Ho Chi Minh & Saigon. Discover our broad range of rental properties in Vietnam.
For more details https://gvrenting.com/
Keep Your Home Naturally Cool and Warm Out Change in Seasons
Vinra Construction is a private limited company registered under the ROC. The management has an experience of over 15 years of understanding the needs and delivering apt solutions to the end users We are providing turnkey solutions in construction fields. like Construction, Interior Designing Facility Management, Plantation Management, etc..
Vinra Construction Tech Enabled Company for Eco-Friendly Home Construction
Contact With Vinra for a Greener Future >>> Call us @ 888 4898 765
The KA Housing - Catalogue - Listing TurkeyListing Turkey
Welcome to KA Housing, a distinguished real estate development nestled in the heart of Eyüpsultan, one of Istanbul’s most promising districts.
Just 10 minutes from the bustling city center, Eyüpsultan offers a serene escape with the convenience of urban living. The direct metro line ensures seamless connectivity to all parts of Istanbul, making it an ideal location for residents who seek both tranquility and vibrancy.
KA Housing boasts unparalleled accessibility, with proximity to Istanbul Airport only 30 minutes away, facilitating easy international travel. Effortless city access is guaranteed by direct metro and transportation links to Istanbul’s cultural and commercial hubs. Quick access to key metro lines connects you to every corner of the city within minutes, making commuting and exploring the city hassle-free.
The development offers luxurious living spaces with a range of unit layouts from 1+1 to 4+1, designed with meticulous attention to detail. Each unit features balconies or terraces, providing stunning vistas of Istanbul and enhancing the living experience. High-quality materials and superior craftsmanship ensure durability and elegance, while sound-proof insulation and high ceilings (2.95 m) offer comfort and sophistication.
Residents of KA Housing enjoy exclusive on-site amenities, including a state-of-the-art gym, outdoor swimming pool, yoga area, and walking paths. Entertainment options abound with a private cinema, children’s playground, and a variety of dining options including a café and restaurant. Security and convenience are paramount with 24/7 security, a dedicated carpark garage, and an IP intercom system.
KA Housing represents a prime investment opportunity with limited availability in a high-demand area, ensuring enduring value and potential for lucrative returns. Homes in this development provide exceptional value without compromising on quality, offering affordable luxury for discerning buyers. The construction is of the highest quality, built to the latest seismic and disaster resistance standards, ensuring safety and resilience.
The community and surroundings of KA Housing are enriched by close proximity to prestigious universities such as Haliç University, Bilgi University, and Istanbul Ticaret University, making it an ideal location for students and academics. The development is adjacent to the Alibeyköy stream leading into the Halic waters, offering serene natural escapes amidst lush greenery. Residents can enjoy the cultural richness of the area, surrounded by historical and cultural landmarks that blend leisure, nature, and culture seamlessly.
https://listingturkey.com/property/the-ka-housing/
The SVN® organization shares a portion of their new weekly listings via their SVN Live® Weekly Property Broadcast. Visit https://svn.com/svn-live/ if you would like to attend our weekly call, which we open up to the brokerage community.
Discover Yeni Eyup Evleri 2, nestled among the rising values of Eyupsultan, offering the epitome of modern living in Istanbul.
With its spacious living areas, contemporary architecture, and meticulous details, Yeni Eyup Evleri 2 is poised to be the star of your happiest moments. Situated in the new favorite district of Eyupsultan, claim your spot and unlock the doors to a peaceful life alongside your loved ones. Nestled next to the historical and natural beauties of Eyupsultan, embrace the comfort of modern living and rediscover life.
Social Amenities:
Yeni Eyup 2 offers a life filled with joy with its green landscaping areas, gym, sauna, children’s play areas, café, outdoor pool, and basketball court. Reserve your place for unforgettable moments!
Reliable Structure:
With 1+1, 2+1, and 3+1 apartment options, Yeni Eyup Evleri 2 is designed with first-class materials and craftsmanship. The doors to a safe and comfortable life are here! Choose the option that suits you best and step into your dream home.
Project:
Yeni Eyup 2 is conveniently located, with Istanbul Airport just 26 minutes away, the Mecidiyeköy Metro Line 4 minutes away, and the Tram Stop 5 minutes away, making your life easier with its central location.
Location:
Your home is positioned in a privileged location, providing easy access to the city center, shopping malls, restaurants, schools, and other important places.
Yeni Eyup 2 offers 1+1, 2+1, and 3+1 apartment options designed to meet different needs. Find an option suitable for every lifestyle and open the doors to a comfortable life in your dream home.
https://listingturkey.com/property/yeni-eyup-evleri-2/
Presentation to Windust Meadows HOA Board of Directors June 4, 2024: Focus o...Joseph Lewis Aguirre
Presentation to Windust Meadows HOA Board of Directors June 4, 2024: Focus on Public Safety as Job #1, Engagement, Wealth of HOA, Branding, Communication, Culture, Civic Responsibility
Sense Levent Kagithane Catalog - Listing TurkeyListing Turkey
Sense Levent offers a luxurious living experience in the heart of Istanbul’s vibrant Levent district.
This cutting-edge development seamlessly integrates modern design with natural elements, featuring live evergreen plants maintained by an advanced irrigation system, ensuring lush greenery year-round.
The building’s elegant ceramic balconies are both stylish and durable, enhancing the overall aesthetic and functionality. Residents can enjoy the 700m Sky Lounge, which provides breathtaking views of Istanbul and a perfect space to relax and unwind.
Sense Levent promotes a healthy and active lifestyle with a full gym, swimming pool, sauna, and steam room, all available in the building. The interiors are crafted with high-quality materials, ensuring a luxurious and inviting living space.
Designed with young professionals in mind, Sense Levent features 1+1 and 2+1 units with smart floor plans and balconies. The project promises high investment returns, with an expected annual return of 6.5-7%, significantly above Istanbul’s average ROI.
Located in the rapidly growing and highly desirable Levent area, the development benefits from ongoing urban regeneration projects. Its prime location offers proximity to shopping malls, municipal buildings, universities, and public transportation, adding immense value to your investment.
Early investors can take advantage of discounted units during the construction phase, with an expected capital appreciation of +45% USD upon completion. Property Turkey provides comprehensive rental management services, ensuring a seamless and profitable investment experience.
Additionally, robust legal support and significant tax advantages are available through Property Turkey’s licensed Real Estate Investment Fund. Levent is a dynamic urban hub, ideal for young professionals with its numerous corporate headquarters and shopping malls.
Sense Levent is more than just a residence; it’s a place where dreams and opportunities come to life. Contact us today to secure your place in this exclusive development and experience the best of Istanbul living. Sense Levent: Sense the Opportunity. Live the Dream.
https://listingturkey.com/property/sense-levent/
1. EMERGING MARKETS
IN ASIA PACIFIC
A Cushman & Wakefield Research Publication
NOVEMBER 2013
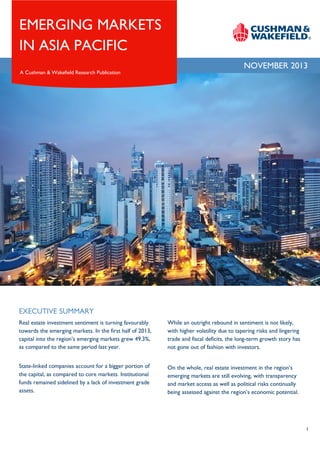
EXECUTIVE SUMMARY
Real estate investment sentiment is turning favourably
towards the emerging markets. In the first half of 2013,
capital into the region’s emerging markets grew 49.3%,
as compared to the same period last year.
While an outright rebound in sentiment is not likely,
with higher volatility due to tapering risks and lingering
trade and fiscal deficits, the long-term growth story has
not gone out of fashion with investors.
State-linked companies account for a bigger portion of
the capital, as compared to core markets. Institutional
funds remained sidelined by a lack of investment grade
assets.
On the whole, real estate investment in the region’s
emerging markets are still evolving, with transparency
and market access as well as political risks continually
being assessed against the region’s economic potential.
1
2. EMERGING
MARKETS IN
ASIA PACIFIC
NOVEMBER 2013
EMERGING MARKETS IN ASIA PACIFIC
A Cushman & Wakefield Research Publication
EMERGING MARKETS OVERVIEW
Real estate investment sentiment in Asia Pacific has turned
favourably towards the emerging markets. In the first half of 2013,
capital into the region’s emerging markets grew 49.3%, as
compared to the same period last year.
Deals in the emerging markets have mainly surged due to the
amount of capital being invested into development land sites in
China’s tier two and three cities. The majority of land deals were
done in the second and third tiered Chinese cities, where
development opportunities, especially in residential developments,
drove investments.
Land sales in these markets increased by 60.7% year-on-year as
compared to the first half of 2012. Despite the clampdown in credit
growth, rapid urbanization and infrastructure needs will drive
growth in these lower-tiered cities, where an estimated 200 million
people is expected to flock to the cities in the next decade.
Excluding land sales, investment volume fell 49.6% across the
region. The fall was experienced across the region, save for
Vietnam, which saw some sizable deals struck for its retail and
hotel assets.
All sectors, save for industrial properties, declined. The increased
outlay into the industrial sector was seen across the region.
Investor interest into the region’s industrial sector this year is
palpable, driven by increasing intra-Asian trade, which spurs
demand for logistical infrastructure, in addition to the higher yields
that industrial assets provide, as compared to those in the office or
retail sector.
Foreign capital comprises about 5.6% of total capital invested in the
region’s emerging markets, down from the 7-9% achieved in
previous quarters. An overwhelming majority, at 90.7%, was
ploughed into development land sites, of which the bulk was bound
for the Chinese cities. Hospitality and retail investments made up
slightly more than 2% of foreign investments each. The bulk of
foreign investments were largely from within the region.
Similar to core markets, developers still remain the largest investor
group in the emerging markets; state-linked companies account for
a bigger portion of the capital, as compared to core markets. Statelinked companies ploughed in US$26.5 billion into emerging
markets’ real estate, an increase of 13.3% from the same period in
2012, which formed 23% of the capital invested. Institutional funds
remained sidelined by a lack of investment grade assets.
While an outright rebound in sentiment is not likely, with higher
volatility due to tapering risks and lingering trade and fiscal deficits,
the long-term growth story has not gone out of fashion with
investors. Capital raisings for Asia-focused funds have increased
from 2012 and the region continues to dominate in the emerging
market space.
On the whole, real estate investments in the region’s emerging
markets are still evolving, with transparency and market access as
well as political risks continually being assessed against the region’s
long-term economic potential as well as a deep structural shortage
of real estate. The challenge and the solution, to a certain extent,
lies in structuring investments, while positioned for the longer
term, mitigates medium-term uncertainty.
INVESTMENT VOLUME
120
US$bn
100
80
60
40
20
0
Core
Emerging
Source: Real Capital Analytics, Cushman &Wakefield Research
STATS ON THE GO (FIGURES IN USD MILLION)
SECTOR
H1 2012
HI 2013
Y-O-Y CHANGE
94,440.65
151,426.35
60.3%
3,678.55
1,883.24
-48.8%
249.79
395.46
58.3%
Retail
4,497.68
2,400.89
-46.6%
Residential
1,198.54
189.43
-84.2%
Hospitality
967.53
467.75
-51.7%
Development Site
Office
Industrial
Source: Real Capital Analytics, Cushman & Wakefield Research
INVESTMENT VOLUME (BY COUNTRY AS OF H1 2013)
India 14%
Vietnam
12%
China 62%
Malaysia 7%
Thailand 4%
Macau 1%
Indonesia
0.3%
Philippines
0.3%
Source: Real Capital Analytics, Cushman & Wakefield Research
NB: excludes land
2
3. EMERGING
MARKETS IN
ASIA PACIFIC
NOVEMBER 2013
EMERGING MARKETS IN ASIA PACIFIC
A Cushman & Wakefield Research Publication
CHINA
Thirdly, although it is less sophisticated and sustainable for a city’s
development, land transfer still remains as the major channel of
income for most local governments.
INVESTMENT CLIMATE/ECONOMIC OVERVIEW
China’s real estate investment landscape has been impacted by the
government’s clampdown on credit and cooling measures
implemented in the residential sector. In order to curb soaring
property prices, China’s securities watchdog stopped reviewing any
fundraising proposals from Chinese developers. The new
administration has signaled it is ready to tolerate a slower pace of
growth to remain on a long-term path of sustainable expansion. In
June, attempts to rein in the shadow banking system sparked a mini
credit crunch. Still, land transactions have rebounded this year in
tandem with the rise in property prices, as many went overseas to
source for funding sources.
In recent years, to accelerate the urbanization process, many local
governments start large-scale constructions simultaneously through
debt financing. According to the auditing of local governments of
provincial cities last year, nine of them bore a debt ratio which was
higher than 100%. Approaching the due date of debts, land transfer
become the most effective way of reimbursement of debt.
Therefore, land transactions are becoming even more active this
year
STATS ON THE GO (FIGURES IN USD MILLION)
SECTOR
H1 2012
HI 2013
Y-O-Y CHANGE (%)
92,324.43
148,381.08
60.7
2633.56
944.76
-64.1
40.14
222.10
4.5
4,284.89
1,918.76
-55.2
Residential
811.18
105.29
-87.0
Hospitality
459.45
109.47
-76.2
Development Site
TRANSACTIONS OVERVIEW
In the first half year of 2013, in addition to the durative upswing of
the first-tier cities’ land market, the second and third-tier cities
have also witnessed a higher growth rate in land transaction, in
terms of covered area and transfer fee. For example, in June, four
well-located parcels in Wuhan were sold at a bidding price of
RMB2.5 billion, among which one parcel was won by Yangtze River
Land at RMB512 million – a new historic high in the city.
The fast growth of land transactions in the second and third-tier
cities is promoted by three major stimuli. First of all, the
implementation of the sustainable urbanization policy has
encouraged the development of the second and third-tier cities and
the expectation of a rigid demand in real estate market. In the face
of stiff competition and limited land supply in the first-tier cities,
more investments of developers have been attracted to markets in
the second and third-tier cities.
Secondly, with the influence of the policy of “New State 5” being
absorbed by the market gradually and the gradual recovery of the
global and domestic economies, a favorable expectation is
generated for the real estate market and real estate investment still
remains as an effective means for the maintenance or increase of
value.
With cheaper price and more effective supply, more individual and
institutional investors have been attracted to the second and thirdtier cities, promoting the development of local real estate market
and the increase of land transactions.
Office
Industrial
Retail
Source: Real Capital Analytics, Cushman & Wakefield Research
INVESTMENT VOLUME (TOP CITIES AS OF H1 2013)
US$m
10,625
Land
8,500
Others
6,375
4,250
2,125
0
Source: Real Capital Analytics, Cushman & Wakefield Research
SELECTED MAJOR TRANSACTIONS (YTD)
PROPERTY NAME
PROPERTY
TYPE
PROVINCE/CITY
PURCHASER
SELLER
CONSIDERATION / PURCHASE PRICE
RMB$ MILLION
US$ MILLION
UNIT PRICE
US$/SF (NLA)
Huangpu Avenue
Devt site
Guangzhou
Greenland Group
Govt
6,400.0
1,028.1
1,640.7
Section G Gailanxi Group
Devt site
Chongqing
China Vanke
Govt
5,372.2
875.6
288.1
Yunpu Industrial Park
Devt site
Guangzhou
Kaisa
Govt
4,556.6
742.7
361.7
Govt
3,990.0
640.9
2,545.3
Huangpu Avenue
Devt site
Guangdong
Changjiang Enterprise
Group
Shenzhen Century Place (27 Flrs)
Office
Shenzhen
Bank of Communications
Hutchison Whampoa
4,000.0
642.8
1,012.2
Tianjin City Tower
Office
Tianjin
China Pacific Insurance
City Developments
585.0
94.8
248.3
Suzhou CS INCITY
Retail
Suzhou
Carlyle Group
SCP Group
2,312.9
183.8
256.2
Source: Real Capital Analytics, Cushman & Wakefield Research
3
4. EMERGING
MARKETS IN
ASIA PACIFIC
NOVEMBER 2013
EMERGING MARKETS IN ASIA PACIFIC
A Cushman & Wakefield Research Publication
INDIA
CORPORATE TRANSACTIONS
INVESTMENT CLIMATE/ECONOMIC OVERVIEW
Though the first five months of the year saw net foreign
institutional investor inflows, there has been a large exodus of
capital from stock markets since June due to the likelihood of
tapering by the US Fed, which led to global markets being in
turmoil.
A high trade deficit on account of petroleum and gold imports
caused the current account deficit to touch a record high of 4.5%
of GDP at US$87.8 billion in 2012-13 according to Reserve Bank
of India. This led the government to reduce non-essential imports
by imposing restrictions as well as raising duties. The deficit was
further compounded from May to June as the Rupee depreciated
by approximately 10% against the US Dollar since the beginning of
the year.
Meanwhile, in order to revive investor interest in Special
Economic Zones (SEZ), minimum land requirements were reduced
by half, while they were done away with for IT-ITeS SEZ during
the first half year. The government also permitted the transfer of
ownership of SEZ units through sale. Other regulatory reforms
saw a relaxation in the norms for availing External Commercial
Borrowings by housing finance companies. Additionally, FDI norms
were enhanced in a number of sectors such as insurance, aviation,
defense production, etc.
TRANSACTIONS OVERVIEW
In contrast to private equity transactions, corporate transactions
in real estate increased by 8% over the same quarter last year, to
hit US$614 million in the first half of 2013. Both the number and
quantum of transactions increased over the last quarter. NCR saw
the highest amount of transactions worth US$253 million due to a
single transaction in the peripheral location.
OUTLOOK
Investments in the real estate sector are expected to be stable in
the next six months, as many investors remain cautious due to the
rupee’s weakness. However, they are still committed to investing
in the Indian markets as developers continue to face liquidity
issues and are in dire need of funding. In addition, incomegenerating assets are expected to remain popular with funds.
Structured deals involving debt financing is also being embraced by
investors to take indirect stakes in projects, which mitigates shortterm risk and allows long-term exposure to one of the world’s
emerging giants.
STATS ON THE GO (FIGURES IN USD MILLION)
SECTOR
H1 2012
HI 2013
Y-O-Y CHANGE
Development Land
945.5
612.7
-35.28
Office
421.4
193.4
-54.1
Hospitality
78.2
-
NA
Residential
306.9
152.2
-50.4
20.2
-
NA
Others
PRIVATE EQUITY INVESTMENTS
While private equity (PE) investments in real estate, which reached
US$276 million in the first half of 2013, fell 46% as compared to
first half of 2012, PE funds continue to show keen interest in the
market with a number of deals in discussion. This decline in the
quantum of PE investments was essentially due to the lower
number of deals (13 in the first half of 2013), as the average ticket
size of deals remained same.
The total value of investments in the residential segment reached
US$156 million in the first half of 2013, a drop of 48% over last
year. The total value of investments in the office segment was also
lower at US$118.1 million. However, investments in ready office
space are strong, reflected by the continuous growth of core
investors with over US$1.3 billion invested in ready office spaces
during the last three years. In 2013, the highest value of PE
investments was in Pune at US$131.6 million, followed by Mumbai
at US$67.5 million, NCR at US$38.8 million and Bengaluru at
US$16.9 million.
Source: Real Capital Analytics, Cushman & Wakefield Research
INVESTMENT VOLUME (TOP CITIES AS OF H1 2013)
US$m
300
250
200
150
100
50
0
NCR
Pune
Mumbai
PE
Chennai
Hyderabad Bengaluru
Others
Corporate Transactions
Source: Real Capital Analytics, Cushman & Wakefield Research
Note: USD 1 = INR 59.27
SELECT MAJOR TRANSACTIONS (H1 2013)
PROPERTY NAME
PROPERTY TYPE
CITY
PURCHASER
SELLER
CONSIDERATION / PURCHASE PRICE
INR MILLION
US$ MILLION
DLF Hyderabad
Devt Site
Hyderabad
Suvarnabhoomi Developers
DLF
6,500
109.6
NA
Chennai Project
Devt Site
Chennai
Ceebros
Viceroy
4,800
80.9
NA
Eon Free Zone
Office
Pune
Blackstone
Panchshil Realty/Ireo Mgmt Ltd.
4,500
75.9
NA
Pune
IDFC Alternatives
Paranjape Schemes
2,500
42.1
NA
Blue Ridge
Office
UNIT PRICE
US$/SF (NLA)
Source: RCA, Cushman & Wakefield Research
4
5. EMERGING
MARKETS IN
ASIA PACIFIC
NOVEMBER 2013
EMERGING MARKETS IN ASIA PACIFIC
A Cushman & Wakefield Research Publication
VIETNAM
increasing at a local level and will be the focus of investment
activity in the short to medium term.
INVESTMENT CLIMATE/ECONOMIC OVERVIEW
However, distressed assets have not been in abundance despite
the ongoing Non-Performing Loans of local banks. Lack of liquidity
in the financial markets will mean there will be more forced sales
in 2014.
As of the end of the first half of 2013, there have not been clear
signals of market recovery although a period of stabilization has set
in. Growth in second quarter GDP remained at 4.9%, similar to
that in the first quarter and is expected to pick up speed in the
later part of the year, while inflation is expected to slow to 6.8%
this year from 9.3% in 2012. Despite recent volatility in emerging
market currencies, the Dong has remained relatively stable.
Although the interest rate is on a downward trend, currently at
12-13%, bank loans in real estate developments are still limited.
MARKET OVERVIEW
Vietnam has witnessed the most active first six months of a year in
the property investment market since the Global Financial Crisis,
signaling a rebounding foreign investment appetite into Vietnam
and an increasingly more sophisticated market.
The uncertain legal infrastructure continues to contribute to a lack
of transparency in the market, as do the opaqueness of domestic
firms. The government’s move to establish a state company, the
Vietnam Asset Management Company, to mop up the financial
sector’s soured loans has not had an immediate impact, and its
effectiveness remains to be seen.
STATS ON THE GO
SECTOR
H1 2012
HI 2013
Office
133.3
50.2
-62.3%
Hospitality
179.2
246.0
37.3%
-
319.3
NA
11.9
34.7
191.6%
Retail
Investments into Vietnam’s real estate market for the half year
through June more than doubled from a year ago to reach
US$669.4 million. This was mainly due to the sale of Vincom
Centre A, which was snapped up by Vietnam Infrastructure and
Property Development Group for US$313.97 million.
Y-O-Y CHANGE
Residential
Source: Real Capital Analytics
Operating assets, particularly office buildings, are the most popular
investment targets for foreign investors, notably Singaporean,
Japanese and Korean organizations that are reducing their
construction and leasing exposure on new developments.
However, there remains a distinct lack of good quality, wellmanaged saleable stock in both HCMC and Hanoi.
Well-situated development sites in both major cities remain
sought after. However, prospective developers anticipate a 30-40%
correction in land values before taking on green field development
investments. This shift has not been evident, despite the recent
correction in the market, and as a result, a lot of development
projects still remain unfeasible.
OUTLOOK
INVESTMENT VOLUME
US$m
800
700
600
500
400
300
200
100
0
2008
2013 will likely see the highest transaction volumes in operating
assets to date. There is an expectation that regional and
international investor interest will gain as the real estate market
reaches the bottom of the cycle. Merger and acquisition activity
2009
2010
2011
2012
H1 2013
Source: Real Capital Analytics, Cushman & Wakefield Research
SELECTED MAJOR TRANSACTIONS (YTD)
PROPERTY NAME
PROPERTY TYPE
CITY
PURCHASER
SELLER
CONSIDERATION/PURCHASE PRICE
VND MILLION
US$ MILLION
UNIT PRICE
US$/SM (NLA)
Centre Point
Office
HCMC
Mapletree Investments
Japan Asia Land
52
1,900
Vincom A
Complex
HCMC
VIPD
Vingroup
470
NA
Sheraton Nha Trang (66% stake)
Hotel
Nha Trang
Kinh Do Corp
VinaLand
42
NA
Life Resort Hoi An
Resort Hotel
Hoi An
MINT
IBUS
9.6
NA
Life Resort Quy Nhon
Resort Hotel
Quy Nhon
MINT
IBUS
6.4
NA
Source: Real Capital Analytics, Cushman & Wakefield Research
5
6. EMERGING
MARKETS IN
ASIA PACIFIC
NOVEMBER 2013
EMERGING MARKETS IN ASIA PACIFIC
A Cushman & Wakefield Research Publication
SOUTHEAST ASIAN CITIES
INVESTMENT MARKET OVERVIEW/OUTLOOK
JAKARTA
REGIONAL OVERVIEW
The success of the region in weathering the impact of 2008’s
financial crisis has awoken the world to the economic potential of
Southeast Asia. Favorable demographics and a large domestic
consumption base have enabled economies like Indonesia and the
Philippines, to remain relatively insulated to the drop in external
demand. With costs in China spiraling after more than two decades
of its economic liberalization, industrialists are also looking to plant
their factories in the Indochinese economies.
However, while prospects of the Fed tapering have exposed the
current account deficits that some economies are running, the
consensus is that another 1997 Asian-styled crisis is unlikely to
occur, due to the region’s better macroeconomic fundamentals.
Investments will likely see a pullback in the short term, as asset
returns will be impacted by further depreciation of currencies.
Real estate investments in the Southeast Asia region will remain
dominated by intra-regional investors and funds with higher risk
profiles. Operating assets in the retail sector have attracted the
bulk of capital since 2008, due to the consumption story. However,
the region’s potential goes beyond that and as investors look to
diversify, along with rising foreign investments, the industrial sector
should gain some traction. Investments into the region’s real estate
markets are expected to be sustained, as its long-term
fundamentals are played out, supported by intra-Asian capital flows.
STATS ON THE GO
SECTOR
H1 2012
HI 2013
Y-O-Y CHANGE
Development Site
1,189.42
2,225.38
87.1%
Office
264.49
301.91
14.1%
Industrial
209.66
90.87
-56.7%
Retail
191.14
448.12
134.4%
Residential
53.90
74.29
37.8%
Hospitality
418.38
358.28
-14.4%
Source: Real Capital Analytics
US$ Million
3,900
2,600
1,300
0
2008
2009
Kuala Lumpur
Bangkok
Source: Real Capital Analytics
2010
Manila
However, most economists believe it is too early to see the
current developments as a threat to longer-term growth. Policymakers have responded promptly. In August, Indonesia announced
a package of fiscal and monetary policies in response to the
pressures in the financial and trade markets. The central bank, Bank
Indonesia, also increased interest rates to 7.25% in September.
The continuing economic growth, Rupiah currency’s stability,
increasing household incomes, and potential market growth
continues to be a pre-requisite to foreign property investors, even
though the fundamentals for property demand and supply in Jakarta
have not altered greatly.
Political uncertainty is becoming a concern to foreign investors.
Even though the government has started to show its commitment
for clean and pro-market governance, the real results of this
initiative remain to be seen. Next year, Indonesia will hold a
parliamentary election in April and a presidential election in July. In
the past, the impact of these elections had proved temporary with
little impact on the property market. Given the recent volatility in
the emerging markets, investors are likely to adopt a wait-and-see
attitude.
Limited investment transactions were recorded in Jakarta. While
foreign investors are cautious, the lack of deals is also a result of
the lack of good investment projects, rising land prices, and pending
infrastructure improvements. As with the capital values, investment
yields of the Jakarta property markets have been relatively stable.
There are still some opportunities for cash-rich investors, those
who have secured reliable sources of finance or those who have
secured prime lands for property development; they will still
benefit from the property markets at various stages of the property
cycles.
Local investors have been more successful in acquiring property
assets in Jakarta, especially land, high-end residential and office
buildings, as they are generally better acquainted with local
conditions. Whereas Bali and Jakarta remain the preferred
investment destination for hotels among foreign investors, very few
deals have been struck. The limitation is only deal sizes as very few
can secure local deals of more than US$100 million.
INVESTMENT VOLUME H1 2013
5,200
Unexpectedly, there are signs of pressure in the Indonesia
economy. Until the first quarter of 2013, the economy seemed to
be doing well. But growth, as of September 2013, has slowed from
6.4% to 5.9%; inflation is rising while the balance of payments is
under pressure along with a weakened Rupiah.
2011
Ho Chi Minh City
2012
Jakarta
In addition, the slow disbursement of the state budget for
infrastructure development is threatening growth, which has
already been held up by a decline in the country’s exports. This
condition and the lack of investors for public infrastructure
developments, coupled with the associated problems in land
acquisition and clearance, have caused uncertainty with regard to
the completion schedule of planned infrastructure projects, and
hence made property investment decisions difficult.
6
7. EMERGING
MARKETS IN
ASIA PACIFIC
NOVEMBER 2013
EMERGING MARKETS IN ASIA PACIFIC
A Cushman & Wakefield Research Publication
MANILA
The economy continued to perform well in the second quarter of
2013, growing by 7.5% in the same period, spurred by aggressive
government spending, increased investments in fixed capital, and
high consumer expenditure. With the expected growth in demand
for office spaces not only in Metro Manila but in provincial areas as
well, investments in office properties are expected to continue
through 2014. In 2012, foreign investments in real estate activities
totaled US$163.5 million, up from 2011’s US$135.2 million. As of
May 2013, foreign investments attributed to real estate activities
already amounted to US$105.9 million, more than half of what was
accumulated in 2012.
Recent investment upgrades by international rating agencies, the
latest of which was Moody’s, have boosted business confidence in
the country. Reasons for these upgrades include the country’s
ability to moderate inflation, its economic resilience, improvement
in fiscal management, and a strong policy-making framework.
There have been numerous development projects happening in
different areas in the Philippines. These projects are visible not only
within Metro Manila, but in other provincial areas as well.
Developers have been snapping up opportunities to develop
properties which have long been in the land bank, and newly
acquired properties which have the potential to attract investments.
One of the more aggressive real estate developers, Ayala Land Inc.
(ALI), has been investing in development land for commercial
districts development. One of the significant investment projects of
ALI is Vertis North, a mixed-use project located in Quezon City,
where the company is investing PHP65 billion.
Another ALI investment project, the Circuit Makati, a
redevelopment of the Sta. Ana race track, would entail an
investment of PHP20 billion on the entertainment complex. Both of
these developments are expected to be completed between 2015
to 2016. Moreover, another real estate developer, Megaworld, has
recently increased its programmed investment project in the Iloilo
Business Park to PHP35 billion, making it its single largest project
located outside Metro Manila.
It is evident that most real estate developers are focused on
investing in development land, and converting it to a mixed-use
community, usually comprising office, residential and leisure
developments.
With the economy on a firmer footing, investments into the
country have become more viable. The Real Estate Investment
Trust law, once passed, would also further strengthen the country’s
real estate investment market. However, there are several key
issues, such as stringent tax rules, which are blocking its
implementation.
institutional funds looking for core assets to park their money in.
However, Malaysia’s legal system and lack of a capital gains tax
(after holding a property for five years) are plus points, as well as
its open-door policy to foreign investments.
For the first of the year, development sites attracted the bulk of
the capital spent on investment deals, at US$565.0 million. The
largest transaction was WCT’s acquisition of land, which the
company intends to develop an integrated-use property.
Foreign capital came in the form of Mitsui Fudosan’s joint venture
with Malaysian developer, E&O, to develop The Mews Services
Residence in the heart of the capital’s CBD, a stone’s throw from
the KLCC precinct. The city is reportedly to be on the radar of
Japanese investors, who are looking to diversify from China and its
home market.
Investments into the capital’s real estate market will likely gain
momentum in the second half, after the country’s general election
saw the ruling coalition retain power. As the government’s
Economic Transformation Program revs into its mid-term,
investments could pick up, due to multiplier effects from
infrastructure projects. However, the program has elevated the
country’s debt levels, which would probably weigh on some of the
government’s plans in the short term.
One of the favored sectors in the capital is the retail sector, as the
push towards a high-income economy is expected to boost wages
and increase consumption; its urban population is also expected to
increase. The city’s well-managed malls will continue to attract the
entry of major international retailing brands.
BANGKOK
Bangkok’s real estate market has remained resilient, weathering the
uncertain global economic climate as well as a volatile domestic
political situation. Still, investments into the capital’s real estate
sector recovered somewhat in 2011, after the last election installed
the current ruling party.
Having been through at least a coup in each decade since 1932,
political instability remains a legitimate concern for investors in the
kingdom. Other major bugbears include regulatory lags and political
inertia, which frequently delay the implementation of policies and
create uncertainty for investors, especially foreign capital, delaying
funding for vital infrastructure projects which Bangkok’s real estate
needs.
Still, there are number of positives for Thailand and its capital city.
KUALA LUMPUR
The city’s popularity as a tourist destination means investors view
hotel assets favorably, and the fundamentals are improving. Tourist
arrivals to the country are expected to increase to 24 million this
year, up by an expected 20% and a huge leap from the 3 million
achieved 12-15 years ago. So far, occupancies and RevPAR figures
are increasing, which would lead to higher room rates.
The capital remains the country’s most attractive real estate
market, which is relatively well-regulated but is much more
affordable when compared to the developed markets in the region.
For Kuala Lumpur’s real estate, the biggest impediment to more
investments is transparency, which has discouraged most foreign
So far, foreign institutional funds have mostly banked on the prime
residential sector in Bangkok, where development land is in short
supply, placing upward pressure on prices and rentals of existing
stock. In contrast, office investments remain relatively low, due to a
lack of investable assets.
7
8. EMERGING
MARKETS IN
ASIA PACIFIC
NOVEMBER 2013
EMERGING MARKETS IN ASIA PACIFIC
A Cushman & Wakefield Research Publication
In the first half of this year, the only foreign presence was a
US$23.3 million investment in units of a condominium project,
located in an expatriate community, by Aramis Capital.
However, expectations for a REIT framework to be introduced by
next year should catalyze and transform real estate investment in
Thailand. While there seems to be still some tax hurdles to clear,
developers are already expanding their sources of rental incomes,
to be injected into REITs when the framework is successfully
implemented. Big scale infrastructural projects should also give the
real estate market a boost once they get off the planning stages.
SELECTED MAJOR TRANSACTIONS Q2
PROPERTY NAME
PROPERTY TYPE
COUNTRY/CITY
PURCHASER
SELLER
CONSIDERATION / PURCHASE PRICE
LCY MILLION
US$ MILLION
Liberty Square
Office
Bangkok/Thailand
KSL Group
NA
1800.0
60.5
140.5
Bang Chalong
Industrial
Bangkok/Thailand
WHA Fund
WHA
1615.0
52.7
74.6
Ideo Thonburi
Dev Site
Bangkok/Thailand
Ananda Devt
NA
738.7
24.3
230.8
Epicentrum Plot
Dev Site
Jakarta/Indonesia
BSD City
Bakrieland
868,930.0
90.0
278.6
Mixed Development
Office
Jakarta/Indonesia
GIC Singapore
Ragawali Group
3,486,000
350.0
NA
Jalan Awan Cina (future
Mixed Development)
Dev Site
Kuala Lumpur/
Malaysia
WCT Bhd
Eng Lian Enterprise
450.0
147.2
58.8
Icon at Tun Tazak-East
Wing
Office
Top Glove
Law Tein Sing/Datin Saw
Geo
226.0
72.9
262.2
Tower 6 Horizon Phase 2
Office
Lembaga Tabung Haji
UOA Group
102.2
33.4
229.0
Midas Hotel
Hospitality
LRWC
Eco Leisure & Hospitality
750.0
18.3
149,000/key
Kuala Lumpur/
Malaysia
Kuala Lumpur/
Malaysia
The Phillippines/
Manila
UNIT PRICE
US$/SF
Source: Real Capital Analytics, Cushman & Wakefield Research
8