The Houston industrial market is strengthening in Q3 2010, with positive net absorption of 1.8 million square feet bringing the year-to-date total to 4.4 million square feet. Occupancy increased slightly to 93.9% while quoted rental rates decreased by 0.4% from the previous quarter but were 10.8% lower than Q3 2009 rates. Absorption was strongest in the Northwest and North corridors, while new construction remained limited at only 218,918 square feet under development. The market is expected to continue gradual improvement as the local economy recovers.
The document summarizes Houston's industrial real estate market performance in Q2 2017. Some key points:
- Vacancy rate increased slightly from 5.3% to 5.5% as absorption slowed.
- Over 1.5 million square feet of new industrial space was delivered in Q2. There is currently 4.2 million square feet under construction, with 77.2% pre-leased.
- Two large new petrochemical plants were announced, reflecting continued growth in that industry in the Houston area.
- Average industrial rental rates decreased slightly both quarterly and annually as more available space entered the market.
Houston's industrial market saw positive net absorption of 3 million square feet in the third quarter of 2017. Vacancy rates decreased slightly to 5.4% as demand for distribution and warehouse space continues to grow. Companies like Amazon, DHL, and FedEx absorbed over 1.5 million square feet by opening new distribution and logistics hubs. Over 5 million square feet of new industrial space is under construction, though vacancy rates remain low across several submarkets.
The Houston industrial market ended the fourth quarter of 2016 with positive net absorption of 1.9 million square feet. However, this was substantially lower than the previous quarter's absorption of 6.3 million square feet, which was driven largely by a single large tenant. The average industrial vacancy rate in Houston increased slightly over the quarter to 5.6% while rental rates increased 3.3% citywide. Approximately 70% of new space delivered in the quarter was pre-leased, and 78% of space under construction is also pre-leased.
Houston's industrial market remains healthy with low vacancy, stable rental rates, and positive net absorption. In Q2 2013, Houston posted 336,000 SF of net absorption, bringing the YTD total to 2.6M SF. The average vacancy rate increased slightly to 5.1% while average quoted rental rates rose 4.2% year-over-year. Demand for new industrial space continues to drive development, with 4.3M SF currently under construction, mostly speculative projects. Houston's economy is expected to remain strong due to continued expansion in the energy industry.
Houston's office market posted positive net absorption of 673,000 square feet in Q4 2017, the first positive figure in several years. However, the 2017 yearly total was still negative at -1.7 million square feet due to previous quarters of negative absorption. Vacancy rates decreased slightly to 19.1% from 19.3% over the quarter but remained higher than the 17.5% rate from Q4 2016. Rents for Class A office space decreased slightly to $34.97 per square foot on average.
The document summarizes industrial real estate market trends in Houston, Texas for Q1 2018. It finds that industrial construction activity increased significantly over the quarter, with over 9.2 million square feet completed, driven by demand from companies like Amazon, Walmart, and FedEx. Absorption of occupied space was strong at over 1.5 million square feet during the quarter, while vacancy rates remained low. The industrial market continues to be supported by job and economic growth in the Houston area.
The Houston industrial market felt the effects of falling oil prices in the fourth quarter of 2015. Absorption slowed and vacancy increased slightly, though remained low overall. Asking rental rates leveled off after significant growth in 2015. Notable activity included large lease renewals by Exel and Michelin and a new 800,000 square foot FedEx facility under construction. Trends to watch include slowing job growth and the impact of lower energy sector employment on industrial submarkets.
The industrial market in Houston continues to strengthen. Net absorption in Q4 was 1.5 million SF, bringing annual absorption to 4.4 million SF. Vacancy decreased to 5.2% in Q4. Quoted rental rates increased slightly. The construction pipeline grew significantly to 2.9 million SF total, with 1.8 million SF being spec development. With continued job and economic growth expected, demand for industrial space in Houston is projected to remain solid.
The document summarizes industrial real estate trends in Houston, Texas in Q2 2018. Vacancy rates increased slightly to 5.5% as some tenants relocated from older buildings to newer, higher-quality space. Absorption turned negative as tenants left older buildings, though the overall market remains healthy. Over 12 million square feet of new industrial space is under construction, with several large distribution centers planned or underway. Job and economic growth in Houston continues to outpace national averages.
Houston’s Industrial Market Records 10.2M SF of Positive Net Absorption in 2014.
During the fourth quarter, 1.9M SF of Houston’s industrial inventory was absorbed, pushing year-end net absorption to 10.2M SF. Industrial leasing activity, which includes renewals, reached 3.4M SF in Q4.
1.4M SF of new product delivered in the fourth quarter, bringing the year-end total to over 8.6M SF. Additionally, almost 8.0M SF of industrial space is currently under construction and all but 650,000 SF is scheduled to deliver in 2015.
Houston’s average industrial vacancy rate decreased from 4.9% to 4.8% between quarters, and decreased from 5.3% over-the-year. The citywide average quoted industrial rental rate decreased 0.8% between quarters from $6.15 to $6.20 per SF NNN, and increased 4.0% on a year-over-year basis from $5.96 per SF NNN.
Houston’s industrial investment sales market is benefiting from the foreign capital that is pouring into the U.S. According to a recent survey by the Association of Foreign Investors in Real Estate (AFIRE), Houston ranked #3 in the top five U.S. cities for foreign investors.
The Houston metropolitan area created 120,600 jobs between October 2013 and October 2014, an annual increase of 4.3% over the prior year’s job growth. Sectors creating most of the jobs contributing to the annual increase include mining and logging, construction, transportation, warehousing and utilities, and health care and social assistance. Houston’s unemployment rate fell to 4.7% from 5.9% one year ago.
Industrial & distribution floorspace todayColin Harrop
The key points from the document are:
1) Available industrial floorspace in Great Britain declined for the first time in five years during the first half of 2010, totaling 23.791 million square meters as of June 2010.
2) Demand from occupiers improved and the rate of secondhand stock returning to the market slowed, contributing to the overall decline in available space.
3) Speculative development increased modestly, with 96,498 square meters under construction across 48 schemes as of July 2010, suggesting a tentative uplift in developer confidence.
The summary is:
1) Austin's industrial market saw another quarter of negative net absorption in Q2 2017, though rental rates continued to increase across the market.
2) Vacancy rates increased across most submarkets and reached 9.0% citywide.
3) Over 1 million square feet of new industrial space is under construction, with several large projects set to deliver new supply in the second half of 2017.
Austin's industrial market saw negative absorption in Q3 2017, with vacancy rates rising to 9.9%. Rental rates decreased across the board, with the average dropping to $10.66/SF NNN. Major tenants moved out of large spaces, contributing to over 260,000 SF of negative absorption. Looking ahead, over 500,000 SF of new industrial space is scheduled for completion in Q4 2017.
Austin's industrial market posted negative net absorption in Q1 2020 due to space coming online, including at NorthTech Business Center and Amazon leasing a large space. Rental rates increased across flex/R&D and warehouse/distribution spaces. Over 1 million square feet of industrial space remains under construction, with over 800,000 square feet scheduled for delivery in Q2 2020. Vacancy increased slightly to 8.6% as large blocks of space came to the market.
Houston's office market saw positive absorption of 84,750 SF in Q2 2018, rebounding from negative absorption in Q1 2018. Vacancy rates decreased slightly to 21.7% overall but increased year-over-year. Large companies like Occidental Petroleum are downsizing space and subleasing hundreds of thousands of square feet. Rental rates have remained relatively stable while leasing activity decreased compared to prior periods.
Houston's office market saw positive net absorption of 715,000 SF in Q3 2013, with rental rates increasing citywide. Over 10.5M SF of new office space is under construction. The vacancy rate rose slightly to 15.4% due to new inventory delivery, though CBD vacancy declined. Strong job and economic growth are expected to continue driving demand for office space.
Houston's industrial market remains strong due to growth in the oil and gas industry. In Q2 2014, the market absorbed 1.6 million square feet of space. Year-to-date net absorption was positive 3.3 million square feet. Vacancy rates remained unchanged at 5.5% while average rental rates decreased slightly. The industrial construction pipeline includes 3.9 million square feet currently under construction. Houston's economy is expected to remain strong in 2014 due to continued job and energy sector growth.
Austin's industrial market saw positive net absorption for the first time in 2017, with 324,922 SF absorbed in Q4. Vacancy rates decreased to 8.7% as several large tenants moved into new spaces, including Free Speech Systems taking 32,000 SF. Over 500,000 SF of new construction is expected to deliver in Q1 2018, with over 1 million SF under construction overall, as demand remains strong. Rental rates saw marginal decreases across the board but activity remained high, with over 1 million SF leased in Q4.
Houston's industrial market remains healthy, with positive net absorption of 1.1 million square feet in Q3 2013, bringing the year-to-date total to 4.5 million square feet. The vacancy rate increased slightly to 5.3% due to new space added. Rental rates increased both quarterly and year-over-year. Demand for new industrial space remains high, spurring 5.7 million square feet currently under construction, with over half in speculative developments.
Houston's industrial market remains healthy, with low vacancy, stable rental rates, and positive absorption. In Q2 2012, net absorption reached 1.8 million SF, pushing the year-to-date total to 3.0 million SF. Leasing activity in Q2 was 3.8 million SF, bringing the mid-year total to 6.7 million SF. The average quoted industrial rental rate decreased slightly to $5.50 per SF NNN, though increased 3.0% year-over-year. With continued job and economic growth, demand for new industrial space is expected to remain high.
The industrial real estate market in the Greater Montreal Area saw improvements in the second quarter of 2015. New industrial construction starts nearly doubled compared to the beginning of the year, signaling continued market recovery. While unemployment rose, full-time employment increased with gains in manufacturing and transportation jobs. Absorption of industrial space rose over 1 million square feet, indicating more space was leased during the quarter. The availability rate increased slightly due to new space added to the market.
Houston's industrial market remains healthy with low vacancy of 5%, positive net absorption of 1.3 million square feet in Q1 2013, and increasing rental rates. New construction totaling 2.7 million square feet was underway to meet continued demand driven by job and population growth. The Houston metro area added over 118,000 jobs in the last year, lowering the unemployment rate to 6.3%, which supported increased industrial leasing activity of 3.3 million square feet in Q1 2013.
Houston's industrial market remains healthy with low vacancy of 5%, positive net absorption of 1.3 million square feet in Q1 2013, and increasing rental rates. New construction totaling 2.7 million square feet was underway to meet continued demand from companies expanding in or relocating to the Houston area. The Houston metro area added over 118,000 jobs in the last year, lowering the unemployment rate and boosting home sales, ensuring continued economic growth for Houston.
Houston's industrial market remains healthy with low vacancy of 5%, positive net absorption of 1.3 million square feet in Q1 2013, and increasing rental rates. New construction totaling 2.7 million square feet was underway to meet continued demand driven by job and population growth. The Houston metro area added over 118,000 jobs in the last year, lowering the unemployment rate to 6.3%, which supported increased industrial leasing activity of 3.3 million square feet in Q1 2013.
The Houston industrial market saw 13 million square feet of new inventory added in 2019. Vacancy rates increased to 6.9% in the fourth quarter, though net absorption remained positive at 2.4 million square feet. Demand continues to be driven by logistics, distribution, and e-commerce users, though an oversupply of spec construction may challenge landlords in some submarkets. Overall, the Houston industrial market had a solid year with healthy absorption and job growth.
Austin's industrial market posted positive net absorption of 382,166 SF in Q1 2018. Rental rates increased slightly citywide and in submarkets. Vacancy decreased to 7.6% overall. Several large leases were signed, including XPO Last Mile taking 57,500 SF. Over 500,000 SF of new product is set to deliver in Q2 2018, with over half being build-to-suit. Construction continued with over 1 million SF under construction.
- Two new office buildings were delivered in Hanoi in Q1 2016, adding over 65,600 sqm of new office space. Overall office vacancy rates increased slightly, while average asking rents decreased year-over-year.
- Twelve new office projects totaling approximately 170,500 sqm are expected to be completed in Hanoi in 2016, with most located outside the CBD.
- The retail market saw no new supply in Q1 2016, with overall vacancy rates decreasing year-over-year. Average asking rents increased moderately both quarter-over-quarter and year-over-year. Over 175,000 sqm of new retail space is forecasted for 2016.
Share or view online at colliers.com/houston
Houston’s industrial market continues to expand adding 3.4M SF of new inventory in Q1 2019 with an additional 16.2M SF under construction
The document summarizes Houston's industrial real estate market performance in Q1 2020. It notes that vacancy increased to 7.9% from 6.9% in Q4 2019. Net absorption remained positive at 3.2M SF despite economic challenges from low oil prices and COVID-19. Rental rates increased slightly. The market faces short term uncertainty from the pandemic's economic impact, but the industrial sector is expected to outperform other commercial real estate over the long run due to growth in e-commerce, inventory stockpiling, and potential supply chain changes.
Houston's industrial market saw slowing absorption and rising vacancy in Q4 2015 as the effects of low oil prices began to impact the market. Absorption fell to under 1 million square feet for the first time since 2011, though over 8.9 million square feet was still absorbed for the year. Vacancy rose 40 basis points to 4.6% as new deliveries outpaced absorption. Asking rental rates leveled off after significant growth in 2015, and are expected to remain flat in 2016. Construction activity declined slightly with 9.1 million square feet under construction, led by Daikin Industries' new 4 million square foot facility.
Austin's industrial market posted positive net absorption of 539,820 square feet in Q4 2018, bringing the annual total to 1,222,219 square feet. Rental rates increased both quarterly and annually, with the average citywide rate reaching $10.98 per square foot. New construction remained active with 11 buildings delivered and 14 new projects commenced, totaling over 861,000 square feet added in the quarter. The industrial market outlook for Q1 2019 includes over 1.3 million square feet of space expected to deliver and over 330,000 square feet of pre-leased space across 10 blocks over 10,000 square feet.
Houston's office market saw modest growth in Q2 2013, with 286,000 SF of positive net absorption. Absorption was lower than the previous year's quarter but is expected to increase as new developments deliver space later in the year. The overall vacancy rate increased slightly to 14.9% while average rental rates rose to $24.26 per SF. Job and economic growth in Houston remained strong, led by expansion in the energy sector. New office developments totaling over 9 million SF are planned or under construction to accommodate ongoing corporate growth.
The industrial market in Austin saw positive net absorption and increased construction in Q3 2019:
- Net absorption was 116,788 square feet as large tenants occupied significant space.
- Average rental rates increased slightly citywide while flex/R&D rates decreased slightly.
- Over 1.6 million square feet of industrial space was under construction across 23 projects.
- Vacancy rates increased slightly to 8.6% due to new developments posting vacant space.
- Absorption remained high and rental rates increased modestly as demand continued.
Austin's industrial market saw strong leasing activity and positive net absorption in Q3 2020 despite the effects of the COVID-19 pandemic. Net absorption was 887,476 square feet as large tenants occupied significant space. The vacancy rate decreased from 9.8% to 8.2% while average rental rates slightly decreased citywide. Construction activity also remained high with over 2.3 million square feet under construction across six projects.
Houston's industrial market remains strong with positive net absorption of 2.1 million square feet in Q4 2013, bringing total net absorption for the year to 7 million square feet. The average vacancy rate remained low at 5.2% as demand outpaced new supply. Rental rates increased both quarter-over-quarter and year-over-year due to low vacancy. New development is robust with 4.4 million square feet under construction to meet ongoing demand driven by job and population growth in Houston.
The Austin office market closed out 2019 with continued strong growth and development. Vacancy increased slightly to 11.9% as net absorption was negative and new construction increased. Rental rates also increased, with Class A CBD rents reaching $53.33 per square foot. The market remains strong with 7.15 million square feet under construction and major developments planned in downtown and the surrounding areas.
Austin's office market continues to see large leases for even larger developments. In Q1 2019, Austin reported 1,082 SF of negative net absorption, with major losses in the Class A Northwest submarket. However, the Southeast submarket saw positive absorption due to a large lease. Large leases signed in Q1 included Indeed taking 183,911 SF and Google leasing 150,000 SF. Austin's vacancy rate increased slightly to 10.6% as rental rates decreased to an average of $35.72/SF. Development remains active with over 3 million SF under construction, over half of which is pre-leased.
Houston's office market saw slowing leasing activity and absorption in Q1 2013 compared to the previous year, with vacancy increasing slightly to 13.9%. However, rental rates increased overall and job growth in Houston remained strong at 4.5% annually. While leasing slowed in the short term due to limited available space, absorption is expected to increase later in the year when 9.4 million square feet of new office space under construction comes online.
Q1 2017 Austin Industrial Research & Forecast Report Kaitlin Holm
Austin's industrial market saw a large quarter of negative net absorption in Q1 2017, with vacancy rates rising. Two large tenants moving out accounted for much of the 622,956 square feet of negative absorption, though they may renew their leases. Rental rates decreased slightly on average but increased for warehouse/distribution spaces. Five new buildings delivered during the quarter totaling 742,165 square feet. Vacancy increased in most submarkets except Northwest where it declined significantly.
Austin's office market is leveling out after a period of high growth and rental rate increases. Net absorption was steady in 2016 around 1 million square feet absorbed, while average rental rates and vacancy remained largely unchanged. New construction is slowing down with over half of current space under construction already preleased. Sublease space is increasing due to new co-working options and a changing workforce seeking flexible space near amenities. The market is expected to remain stable in the next 12-18 months barring major changes from large tech firms or a slowdown in the tech sector.
Austin's office market finished 2017 strongly, with Q4 net absorption of 319,028 SF bringing total 2017 absorption to 886,556 SF. Vacancy decreased to 11.5% as demand remained high, especially in the North/Domain submarket. Rental rates increased slightly citywide to $34.92/SF and more significantly in the CBD, where Class A rates rose to $50.97/SF. With limited new supply coming online, the tight market is expected to continue into 2018.
Similar to Houston industrial market report 3 q 10 (16)
The document summarizes research on working from home (WFH) trends and implications. It finds that WFH has increased 6-fold during the pandemic and is stabilizing at around 30% of workdays. Most employees prefer a hybrid model that allows some choice over WFH days. Managing hybrid teams well requires coordinating in-person office days to promote collaboration. Offices are not expected to significantly cut space but may redesign to add meeting rooms and lounge seating. Support services may increasingly offshore under long-term hybrid models.
HORIZON TOWER
520,094 RSF
17-story medical + biomedical space
13-level parking garage; 2,700 stalls
Under Construction and
On-Schedule for 4Q2023 Delivery
This document summarizes a webinar hosted by Occupier Services on May 14th discussing strategies for leading occupiers in the "new normal". The webinar featured a panel of real estate executives from Nokia, Nestle, ServiceNow and PepsiCo discussing topics like portfolio management, transaction strategies and workplace strategies in light of COVID-19. Survey results were presented showing most occupiers anticipate a decrease in future office space needs and a preference among employees to work from home at least one day a week going forward. The webinar provided insights into how large occupiers are adapting their real estate strategies in response to the pandemic.
Houston Methodist and Colliers International HoustonCoy Davidson
Colliers International has provided real estate and advisory services to Houston Methodist Hospital since 2001. Houston Methodist is one of the largest health systems in the US, consisting of 7 hospitals and over 120 locations across the Greater Houston area. Colliers International assists Houston Methodist with services such as site selection, acquisitions, property management, and tenant representation. Some of Colliers' accomplishments for Houston Methodist include selecting and acquiring sites for new hospitals in The Woodlands and Katy, Texas, as well as five emergency care centers, and representing Houston Methodist in leasing over 230,000 square feet across 23 locations.
Despite strong demand and low vacancy rates in 2016, the healthcare industry faces uncertainties in 2017. The repeal of the Affordable Care Act and its replacement details are unknown, which may delay real estate decisions. Additionally, new Medicare reimbursement rules will challenge off-campus projects' viability and cause providers to reevaluate expansion plans. Rising costs are putting pressure on providers' operating margins as the aging population increases demand for healthcare. While fundamentals remain solid, the industry will need to make nuanced real estate decisions based on the changing policy and consumer landscape.
Colliers International Houston Trends 2017Coy Davidson
This document contains multiple charts and graphs summarizing real estate market trends in Houston, Texas from 2001 to 2016. It shows that drilling permits and rig counts in Texas peaked in the late 2000s and declined sharply after 2014. Houston gained over 100,000 jobs annually from 2009 to 2013 but saw job losses in the energy sector after 2014. Office vacancy rates in Houston doubled from the early 1980s to late 1980s during a period of rapid office development. The industrial, retail, multifamily, and construction sectors are also analyzed with statistics on vacancies, rents, absorption, construction projects, and sales.
This document summarizes economic indicators and trends in Houston, Texas. It finds that while Houston added over 15,000 jobs in 2015, growth has slowed significantly since the dramatic fall in oil prices in late 2014. The energy sector, particularly upstream exploration and production, has been hardest hit, though other industries like healthcare and trade have provided job gains. Population growth remains strong at over 2.5% annually. Despite challenges from low oil prices, Houston's diverse economy, large port and medical sector position it for continued importance.
2016 Healthcare Real Estate MarketplaceCoy Davidson
Healthcare real estate continues strong performance, with demand for medical office space expected to increase due to rising healthcare spending and an aging population. Vacancy rates have declined to 9.5% nationally as absorption remains positive, while rental rates have increased slightly. Medical office building sales volumes hit a new peak in 2015, contributing to downward pressure on capitalization rates. The outlook for 2016 is continued strong fundamentals and demand in the healthcare real estate sector.
Houston Healthcare Real Estate Market Report - Year End 2015Coy Davidson
The Texas Medical Center in Houston announced plans to expand its life science research campus by 30 acres and $1.5 billion to establish Houston as a new life science hub. Additionally, Baylor College of Medicine and CHI St. Luke's Hospital plan to develop a $1.1 billion medical campus featuring a medical school, cardiovascular research institute, and nationally recognized hospital. The expansions aim to solidify Houston's position as a leader in human health and medical research.
The office market fundamentals continued to improve in Q4 2015, with rents rising and vacancies falling in the core areas of the top 10 markets. Absorption trends were generally positive, though leasing slowed in some markets due to low availability. Tech tenants remain an important driver of leasing activity, though corporate relocations and professional services are also contributing. Rents are below prior peaks in most markets, suggesting further potential for growth in 2016 as the US economy continues moderate expansion.
This document provides a summary of the crude oil market in early 2016. It notes that crude oil prices had fallen dramatically to around $30/barrel from over $100/barrel previously. It analyzes factors contributing to lower oil prices such as increased US shale oil production, the lifting of the US oil export ban, and the market share war being waged by Saudi Arabia. The document also examines projections for global oil supply and demand in 2016-2017 and the expected impacts on production levels from US shale declines, OPEC, and potential increased exports from Iran.
This document provides information on sponsors, partners, and leadership for CRE // Tech events. It lists lead sponsors and national media sponsors. It also lists the board of advisors and regional chairs that provide leadership for CRE // Tech. Finally, it thanks sponsors and supporters for making the events possible.
The document summarizes the Q4 2014 office market report for San Francisco. Key points include:
- The vacancy rate remained flat at 7.5% due to new construction, though it has decreased 51% since 2010.
- Leasing activity was strong with 1.5 million sq ft leased in Q4 and a total of 8.1 million sq ft for the year, exceeding the annual average.
- The market posted its 18th consecutive quarter of positive absorption, with over 257,000 sq ft absorbed in Q4 and over 2.8 million sq ft for the year.
- Average rents increased to $64.79 per sq ft, a 16.2% increase over the previous
Houston Medical Office Report and Healthcare CommentaryCoy Davidson
This document summarizes healthcare real estate trends in the Houston area in 2014. It notes that the population is growing rapidly and demand for healthcare services is increasing. As a result, major hospital systems are expanding by constructing new facilities and medical office buildings in the suburbs to improve access. In the Texas Medical Center, several large hospital projects were underway or completed in 2014 that will add over a million square feet of new space. Freestanding emergency departments are also proliferating as another strategy to expand access and capture market share. Overall, the healthcare sector in Houston showed no signs of slowing down despite a downturn in the energy industry.
Despite uncertainty around the Affordable Care Act, demand for healthcare real estate continues to increase due to growth in the insured population and an aging baby boomer generation. Medical office vacancy rates are at their lowest since the recession and declining further, while modern, flexible spaces in good locations see the highest demand. Both new construction and space under construction have remained low since the recession. Healthcare industry consolidation is accelerating due to the ACA and cost pressures.
The document summarizes updates to BOMA standards for measuring and calculating rentable area in commercial real estate. It outlines revisions to Method A (legacy method) and the introduction of Method B (single load factor method) for more consistent rentable area calculations. It also discusses new enclosure requirements to provide consistent boundaries for measuring interior space. Abel Design Group presented on these updates to assist clients with applying the current BOMA standards.
North American Industrial Outlook Q4 13Coy Davidson
This document discusses trends in the North American industrial real estate market in Q4 2013. It notes that vacancy rates declined slightly to 7.69% due to strong absorption in the US market. While construction of new industrial space increased, absorption exceeded new supply, indicating no overbuilding risk. The document advocates thinking in "3D" by considering factors beyond traditional supply and demand like the impact of e-commerce, changing manufacturing processes, and transportation infrastructure on industrial real estate.
The document provides an overview and summary of Colliers' first national medical office report. It discusses key drivers of the medical office building (MOB) market, including the aging baby boomer population and Affordable Care Act. It also summarizes trends in the healthcare industry such as employment growth in outpatient care and widespread industry growth across US geographies. Healthcare real estate trends are also examined, like stable MOB vacancy rates and declining construction activity in recent years.
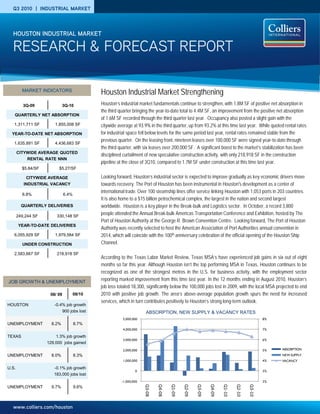
1. www.colliers.com/houston
Q3 2010 | INDUSTRIAL MARKET
Houston Industrial Market Strengthening
Houston’s industrial market fundamentals continue to strengthen, with 1.8M SF of positive net absorption in
the third quarter bringing the year-to-date total to 4.4M SF, an improvement from the positive net absorption
of 1.6M SF recorded through the third quarter last year. Occupancy also posted a slight gain with the
citywide average at 93.9% in the third quarter, up from 93.2% at this time last year. While quoted rental rates
for industrial space fell below levels for the same period last year, rental rates remained stable from the
previous quarter. On the leasing front, nineteen leases over 100,000 SF were signed year-to-date through
the third quarter, with six leases over 200,000 SF. A significant boost to the market’s stabilization has been
disciplined curtailment of new speculative construction activity, with only 218,918 SF in the construction
pipeline at the close of 3Q10, compared to 1.7M SF under construction at this time last year.
Looking forward, Houston’s industrial sector is expected to improve gradually as key economic drivers move
towards recovery. The Port of Houston has been instrumental in Houston's development as a center of
international trade. Over 100 steamship lines offer service linking Houston with 1,053 ports in 203 countries.
It is also home to a $15 billion petrochemical complex, the largest in the nation and second largest
worldwide. Houston is a key player in the Break-bulk and Logistics sector. In October, a record 3,800
people attended the Annual Break-bulk Americas Transportation Conference and Exhibition, hosted by The
Port of Houston Authority at the George R. Brown Convention Centre. Looking forward, The Port of Houston
Authority was recently selected to host the American Association of Port Authorities annual convention in
2014, which will coincide with the 100th anniversary celebration of the official opening of the Houston Ship
Channel.
According to the Texas Labor Market Review, Texas MSA’s have experienced job gains in six out of eight
months so far this year. Although Houston isn’t the top performing MSA in Texas, Houston continues to be
recognized as one of the strongest metros in the U.S. for business activity, with the employment sector
reporting marked improvement from this time last year. In the 12 months ending in August 2010, Houston’s
job loss totaled 18,300, significantly below the 100,000 jobs lost in 2009, with the local MSA projected to end
2010 with positive job growth. The area’s above-average population growth spurs the need for increased
services, which in turn contributes positively to Houston’s strong long-term outlook.
3Q-09 3Q-10
QUARTERLY NET ABSORPTION
1,311,711 SF 1,855,008 SF
YEAR-TO-DATE NET ABSORPTION
1,635,891 SF 4,436,683 SF
CITYWIDE AVERAGE QUOTED
RENTAL RATE NNN
$5.84/SF $5.27/SF
CITYWIDE AVERAGE
INDUSTRIAL VACANCY
6.8% 6.4%
QUARTERLY DELIVERIES
249,244 SF 330,148 SF
YEAR-TO-DATE DELIVERIES
6,055,929 SF 1,979,584 SF
UNDER CONSTRUCTION
2,583,667 SF 218,918 SF
RESEARCH & FORECAST REPORT
HOUSTON INDUSTRIAL MARKET
JOB GROWTH & UNEMPLOYMENT
MARKET INDICATORS
08/ 09 08/10
HOUSTON -0.4% job growth
900 jobs lost
UNEMPLOYMENT 8.2% 8.7%
TEXAS 1.3% job growth
129,000 jobs gained
UNEMPLOYMENT 8.0% 8.3%
U.S. -0.1% job growth
183,000 jobs lost
UNEMPLOYMENT 9.7% 9.6%
2%
3%
4%
5%
6%
7%
8%
Q3-08
Q4-08
Q1-09
Q2-09
Q3-09
Q4-09
Q1-10
Q2-10
Q3-10
-1,000,000
0
1,000,000
2,000,000
3,000,000
4,000,000
5,000,000
ABSORPTION
NEW SUPPLY
VACANCY
ABSORPTION, NEW SUPPLY & VACANCY RATES
2. RESEARCH & FORECAST REPORT | Q3 2010 | HOUSTON INDUSTRIAL MARKET
Occupancy & Availability
Houston’s industrial market averaged
93.9% occupancy in the third quarter, 60
basis points (bps) higher than the previous
quarter, and 70 bps above the 93.2%
recorded in the same quarter last year.
Over the past eight quarters, Houston’s
industrial market has consistently
maintained occupancy levels above 90%
for all major corridors, outperforming all
other commercial real estate property
sectors citywide.
At the end of the third quarter, Houston
posted 29.3M SF of vacant industrial
space citywide. Among the major
industrial corridors, the Northwest held the
largest amount of vacant space with 7.8M
SF (6.0% vacancy), followed by the
Southeast with 6.3M SF vacant (7.8%
vacancy), the Southwest with 4.3M SF
vacant (6.8% vacancy), and the North with
4.3M SF vacant (6.5% vacancy).
Developers have responded to current
Absorption & Demand
Houston’s industrial market posted
positive net absorption of 1.9M SF in the
second quarter, an improvement over the
positive net absorption of 1.3M SF in the
same quarter last year. This marked the
fourth consecutive quarter of gains,
bringing the year-to-date positive net
absorption to 4.4M SF. By comparison,
the annual net absorption for all four
quarters of 2009 was 1.8M.
Among Houston’s major industrial
corridors, the Northwest and Southwest
continued to outperform other industrial
sectors at midyear. The Northwest
posted the highest positive net absorption
for the third quarter with 979,302 SF,
and 2.2M SF year-to-date. The North
followed with positive net absorption of
669,127 SF in the third quarter, and
850,697 SF year-to-date. The
Southwest posted 123,757 SF of positive
net absorption, with 1.9M SF year-to-
2010 INDUSTRIAL LEASES
Igloo Products Corp***
777 Igloo Road
May-10 914,195 SF
Ashley Furniture*
Airtex Industrial Center
Mar-10 303,000 SF
Frontier Logistics
3005 State Highway 225
Feb-10 300,000 SF
Trans-Hold
8905 Spikewood
Jun-10 251,600 SF
Gulf Winds International**
South Loop Business Park
Jun-10 212,961 SF
Williamsport Distribution Center
11503 Highway 225
Apr-10 210,000 SF
Portsmith
21202 Park Row
Aug-10 180,000 SF
COLLIERS INTERNATIONAL | P. 2
Developers have responded to current
market conditions by halting all major
speculative industrial construction projects
in Houston, leaving only 208,918 SF in the
construction pipeline at the end of the third
quarter. The largest project under
construction is a 34,125-SF office/
warehouse in the West Outer Loop
scheduled for delivery by December 2010.
Speculative construction is expected to
remain limited over the next 6 to 12
months.
Rental Rates
Houston’s average quoted industrial rental
rates decreased by 0.4% between
quarters, and by 10.8% on a year-over-
year basis. The overall $5.27 NNN/SF in
the third quarter fell from $5.84 NNN/SF at
this time last year. By property type,
warehouse distribution space was $4.76
NNN/SF (down $0.14/SF); bulk space
stood at $4.23 NNN/SF (up $0.25/SF); and
flex space was $7.96 NNN/SF (up
$0.04/SF).
date.
Major tenant move-ins contributing to net
absorption gains in the third quarter
included Portsmith’s 180,000-SF lease at
21202 Park Row (Northwest), and
Furniture Brands’ 109,386-SF lease at
Airtex Industrial Center (North).
Leasing
Houston’s industrial market recorded
nineteen (19) leases over 100,000 SF –
including six (6) leases over 200,000 SF
– year-to-date through the third quarter
2010, which includes the 914,195-SF
sale-leaseback for Igloo Products.
Overall, industrial leasing activity
reached 4.0M SF in the third quarter,
compared to 5.0M SF recorded in the
same quarter last year. For a select list
of Houston’s top industrial leases signed
to date, please see the column at left.
Aug-10 180,000 SF
FedEx
Ellington Trade Center I
Jun-10 146,792 SF
Xpedx***
10300 North Loop Freeway
Apr-10 139,871 SF
Exel**
8607 Citypark Loop
May-10 127,900 SF
Transportation Consultants
Bay Area Business Park
July-10 120,000 SF
CVS Pharmacy**
301 S. Trade Center Parkway
Jun-10 113,175 SF
Furniture Brands*
Airtex Industrial Center
July-10 109,386 SF
*Colliers International transaction
** Renewal
*** Sale-Leaseback
3. RESEARCH & FORECAST REPORT | Q3 2010 | HOUSTON INDUSTRIAL MARKET
COLLIERS INTERNATIONAL | P. 3
Sales Activity
Houston’s industrial investment activity
remained below pre-recession levels
with year-to-date activity through the
third quarter posting $93.8M in total
volume with a combined total of 5.0
MSF and an average $44/SF.
Although industrial properties less than
50,000 SF continued to account for
the majority of transactions to date,
some larger Q3 sales included:
Albert H Powers acquired the 62,246-
SF Cummins Southern Plains
warehouse located at 7045 N Loop
Fwy E from Charter SW Seven, LP.
Built in 2001, the property sold for
$8.67M or $139/SF.
HOUSTON INDUSTRIAL MARKET SUMMARY
Year-to-date 2010
Total volume: $93.8M
# of transactions:
76
Total SF: 5,101,014
Price/SF: $44
Average Cap: 8.0%
Source: Costar Comps
PGI International Manufacturing
16101 Vallen Drive
HOUSTON INDUSTRIAL INVESTMENT SALES
Western Well Tool, Inc. acquired the
174,139-SF 16101 Vallen Drive
manufacturing warehouse from
Khoshbin Company for $13M or
$75/SF in an owner-user sale.
Donovan Investment Co. acquired the
98,850-SF 19423 Aldine Westfield
warehouse for $9.7M or $98/SF from
A.E.N. Farrell, LP. The building is
100% occupied by LKQ Corporation.
Granite Properties Inc. began
marketing its entire industrial portfolio
during the third quarter. The Dallas-
based developer is selling the 17-
property portfolio, which includes 14
single and multi-tenant properties in
Houston which contain a total of 1.95M
SF and are 89.3 percent leased.
Market Rentable Area
Direct
Vacant SF
Direct
Vacancy
Rate
Sublet
Vacant SF
Sublet
Vacancy
Rate
Total
Vacant SF
Total
Vacancy
Rate
3rd Qtr Net
Absorption
YTD Net
Absorption
3rd Qtr
Completions
YTD
Completions
SF Under
Construction
Greater Houston Total 473,516,005 29,290,284 6.2% 762,210 0.2% 30,125,025 6.4% 1,855,008 4,436,683 330,148 1,979,584 218,918
NW Inner Loop 11,447,633 553,590 4.8% 53,034 0.5% 679,154 5.5% (9,202) 110,455 - - -
CBD 34,380,936 2,171,501 6.3% - 0.0% 2,171,501 6.3% (252,607) (123,264) - - -
North Inner Loop 5,619,637 532,738 9.5% - 0.0% 532,739 9.5% 30,500 (56,032) - - -
SW Inner Loop 9,079,323 218,838 2.4% 13,164 0.1% 232,002 2.6% 73,722 155,428 - - -
Total Inner Loop 60,527,529 3,476,667 5.7% 66,198 0.1% 3,615,396 6.0% (157,587) 86,587 - - -
North Fwy/Tomball Pky 13,231,183 1,229,979 9.3% 9,975 0.1% 1,239,954 9.4% 153,023 101,806 - - 10,000
North Hardy Toll Rd 24,319,203 1,694,388 7.0% 127,992 0.5% 1,822,380 7.5% 670,311 881,349 - 195,100 -
North Outer Loop 17,349,599 836,649 4.8% - 0.0% 836,649 4.8% (72,909) (23,083) 67,250 67,250 -
The Woodlands/Conroe 11,403,524 581,509 5.1% 29,880 0.3% 611,389 5.4% (81,298) (109,375) - - -
Total North Corridor 66,303,509 4,342,525 6.5% 167,847 0.3% 4,510,372 6.8% 669,127 850,697 67,250 262,350 10,000
Northeast Hwy 321 1,068,683 - 0.0% - 0.0% - 0.0% 0 7,700 - - -
Northeast Hwy 90 15,839,459 494,672 3.1% 68,680 0.4% 563,352 3.6% (106,260) (249,101) - - -
Northeast I-10 3,274,197 - 0.0% - 0.0% - 0.0% - - - - -
Northeast Inner Loop 11,344,182 818,314 7.2% - 0.0% 818,314 7.2% (26,961) (220,698) - - 148,793
Total Northeast Corridor 31,526,521 1,312,986 4.2% 68,680 0.2% 1,381,666 4.4% (133,221) (462,099) - - 148,793
Hwy 290/Tomball Pky 16,200,541 990,116 6.1% 16,024 0.1% 1,006,140 6.2% 34,536 300,312 204,800 -
Northwest Hwy 6 4,234,555 815,703 19.3% - 0.0% 815,703 19.3% 17,099 170,906 65,000 -
Northwest Inner Loop 60,849,381 3,106,913 5.1% 196,745 0.3% 3,303,658 5.4% 534,457 826,713 - 25,760 -
Northwest Near 16,272,442 985,839 6.1% 13,550 0.1% 999,389 6.1% 132,393 113,989 - - -
Northwest Outlier 11,199,421 399,787 3.6% - 0.0% 399,787 3.6% 235,573 378,446 180,000 180,000 -
West Outer Loop 21,225,037 1,476,795 7.0% 3,678 0.0% 1,480,473 7.0% 25,244 394,636 - 101,650 34,125
Total Northwest Corridor 129,981,377 7,775,153 6.0% 229,997 0.2% 8,005,150 6.2% 979,302 2,185,002 180,000 577,210 34,125
East I-10 Outer Loop 14,956,245 413,345 2.8% 70,000 0.5% 483,345 3.2% 40,000 (18,422) - - -
East-SE Far 43,138,260 5,289,505 12.3% 37,500 0.1% 5,327,005 12.3% 275,732 142,478 - - -
SE Outer Loop 22,090,334 564,339 2.6% - 0.0% 564,339 2.6% 85,095 (104,553) - - -
Total Southeast Corridor 80,184,839 6,267,189 7.8% 107,500 0.1% 6,374,689 7.9% 400,827 19,503 - - -
South Highway 35 28,485,232 1,420,141 5.0% 11,000 0.0% 1,431,141 5.0% (59,158) (325,149) - - 26,000
South Inner Loop 13,597,795 397,878 2.9% - 0.0% 397,878 2.9% 31,961 161,187 - - -
Total South Corridor 42,083,027 1,818,019 4.3% 11,000 0.0% 1,829,019 4.3% (27,197) (163,962) - - 26,000
Highway 59/Highway 90 22,560,202 1,342,944 6.0% 66,607 0.3% 1,409,551 6.2% 67,764 599,259 62,898 62,898 -
Southwest Far 9,536,167 612,328 6.4% - 0.0% 612,328 6.4% 39,485 119,366 - - -
Southwest Outer Loop 13,508,772 1,140,786 8.4% - 0.0% 1,140,786 8.4% 10,170 108,680 - - -
Fort Bend County/Sugar Land 17,304,062 1,201,687 6.9% 44,381 0.3% 1,246,068 7.2% 6,338 1,093,650 20,000 1,077,126 -
Total Southwest Corridor 62,909,203 4,297,745 6.8% 110,988 0.2% 4,408,733 7.0% 123,757 1,920,955 82,898 1,140,024 -
4. RESEARCH & FORECAST REPORT | Q3 2010 | HOUSTON INDUSTRIAL MARKET
COLLIERS INTERNATIONAL | P. 4
Industrial Projects Under Construction
Select 2010 Industrial Deliveries
Submarket Building Name Building Address RBA % Leased Developer
Estimated
Delivery
West Outer Loop 11987 FM 529 Warehouse 11987 FM-529 34,125 0 Texas Development Company Dec-10
South Highway 35 80 White Road Warehouse 80 White Rd 26,000 0 Holt Lundsford Commercial Oct-10
Total u/c industrial projects listed above 60,125
Submarket Building Park Building Name Building Address RBA % Leased Developer Name Delivered
Sugar Land Ind Rooms To Go Distribution Center 31111 Miller Rd 1,057,126 100 Houston Associates LLC Mar-10
Hwy 290/Tomball Pky Ind Jake's Finer Foods HQ 13400 Hollister Dr 180,000 100 n/a Feb-10
Northwest Outlier Primewest Business Park Pointsmith HQ 21202 Park Row 180,000 100 n/a Aug-10
West Outer Loop Ind 15300 Hempstead Highway Warehouse II 15300 Hempstead Hwy 150,000 82.67 The National Realty Group May-10
North Hardy Toll Road Ind LKQ Corporation 19423 Aldine Westfield Rd 98,850 100 n/a Feb-10
North Hardy Toll Road Ind AMB IAH Logistics Center III Forward Air 19220 Kenswick Dr 96,250 100 AMB Property Corporation Jan-10
North Outer Loop Ind 13627 W Hardy Warehouse 13627 W Hardy Rd 67,250 0 The National Realty Group Jun-10
Northwest Hwy 6 Ind Hempstead 1960 Business Park 20220 Hempstead Warehouse 20220 Hempstead Rd 65,000 0 Capital RE Commercial Mar-10
Northwest Inner Loop Ind 1557 W Sam Houston Industrial Flex 1557 W Sam Houston Pky 25,760 17.39 Caldwell Companies Feb-10
Hwy 290/Tomball Pky Ind Beltway 249 Business Park Beltway 249 BP, bldg. A 15825 Tx-249 Hwy 24,800 0 Capital RE Commercial Mar-10
North Fwy/Tomball Pky Ind FM 2920 Business Park FM 2920 BP, Bldgs. 1 & 2 5045 FM 2920 10,000 100 The National Realty Group May-10
Northeast I-10 Ind 9835 Wallisville Warehouse 9835 Wallisville Rd 7,800 100 n/a Mar-10
Total year-to-date industrial deliveries listed above 1,962,836
5. RESEARCH & FORECAST REPORT | Q3 2010 | HOUSTON INDUSTRIAL MARKET
480 offices in
61 countries on
6 continents
United States: 95
Canada: 17
Latin America: 17
Asia Pacific: 52
EMEA: 85
Accelerating success.
COLLIERS INTERNATIONAL | HOUSTON
1300 Post Oak Boulevard
Suite 200
Houston, Texas 77056
MAIN +1 713 222 2111
COLLIERS INTERNATIONAL | P. 5