SlideShare a Scribd company logo
Share or view online at colliers.com/texas/houstonindustrial
Houston’s industrial market sees growth in distribution
space and logistic hubs
Research &
Forecast Report
HOUSTON | INDUSTRIAL
Q3 2017
Lisa Bridges Director of Market Research | Houston
During the third quarter of 2017, 3.0M SF of Houston’s industrial
inventory was absorbed, pushing the 2017 year-to-date total to
6.2M SF. Although Houston’s economy slowed significantly in 2015
and remained weak in 2016, the demand for consumer products
continues to spur growth in the industrial sector. Companies like
Amazon, DHL and FedEx are just some of the tenants in the market
leasing or building distribution and logistics hubs. Companies such
as Ikea, Daikin, Lowes and Home Depot that manufacture and/or
distribute buildings supplies for new developments, as well as now
for rebuilding Harvey impacted properties, have expanded their
footprint in the market as well.
The average vacancy rate has remained low for several years now,
hovering between 5.5% and 5.3%. Over the quarter, the average
vacancy rate decreased marginally from 5.5% to 5.4%. A little
over 2.5M SF of new product delivered during the third quarter
bringing the 2017 new inventory total to over 7.6M SF. Currently,
5.3M SF of industrial space is under construction of which 30.7%
is pre-leased.
In addition to the Industrial distribution and warehouse space under
construction, two large petrochemical plants are in the planning
stages. Brazil-based Braskem’s $675 million polypropylene
plant is scheduled to start construction near year-end 2017, with
completion targeted for the first quarter of 2020. LyondellBasell
plans to build a $2.4 billion petrochemical plant, the largest factory
of its kind in the world near the Houston Ship Channel.
According to the U.S. Bureau of Labor Statistics, the Houston MSA
created 53,500 jobs (not seasonally adjusted) between August
2016 and August 2017, an annual growth rate of 1.8%. Industry
sectors that added jobs include: Mining and Logging, Manufacturing,
Professional and Business Services, Health Care and Social
Assistance, and Educational Services.
Summary Statistics
Houston Industrial Market Q3 2016 Q2 2017 Q3 2017
Vacancy Rate 5.2% 5.5% 5.4%
Net Absorption (SF) 6,515,187 -53,222 3,035,998
New Construction (SF) 6,291,802 1,442,223 2,542,549
Under Construction (SF) 9,690,224 4,227,300 5,291,835
Asking Rents
Per Square Foot Per Year
Average $6.97 $6.89 $6.90
Warehouse/Distribution $6.57 $6.56 $6.55
Flex/Service $11.18 $10.76 $10.08
Tech/R&D $11.78 $12.03 $10.95
Market Indicators
Relative to prior period
Annual
Change
Quarterly
Change
Quarterly
Forecast*
VACANCY
NET ABSORPTION
NEW CONSTRUCTION
UNDER CONSTRUCTION
*Projected
Change in Sales (Year over Year)
©2016 Real Capital Analytics, Inc. All Rights Reserved. Data belie
revision
-100.0%
-50.0%
0.0%
50.0%
100.0%
150.0%
200.0%
250.0%
300.0%
Q3 '13 Q3 '14 Q3 '15 Q3 '16 Q3 '17
Average Price Per SF
©2016 Real Capital Analytics, Inc. All Rights Reserved. Data believed
revision
$0
$20
$40
$60
$80
$100
Q3 '13 Q3 '14 Q3 '15 Q3 '16 Q3 '17
Average CAP Rate
6.4%
6.9%
7.4%
7.9%
8.4%
8.9%
Q3 '13 Q3 '14 Q3 '15 Q3 '16 Q3 '17
2 Houston Research & Forecast Report | Q3 2017 | Industrial | Colliers International
Sales Activity
Source: Real Capital Analytics
Q3 2017
NO. OF PROPERTIES: 34
TOTAL SF: 3.7M
AVERAGE $/SF: $81
AVERAGE CAP RATE: 7.3%
Job Growth & Unemployment
(not seasonally adjusted)
UNEMPLOYMENT 8/16 8/17
HOUSTON 5.7% 5.2%
TEXAS 4.9% 4.5%
U.S. 5.1% 4.5%
JOB GROWTH
Annual
Change
# of Jobs
Added
HOUSTON 1.8% 53.5K
TEXAS 2.4% 286.3K
U.S. 1.5% 2.1M
Vacancy & Availability
Houston’s average industrial vacancy rate decreased 10 basis points from 5.5%
to 5.4% over the quarter. At the end of the third quarter, Houston had 28.5M
SF of vacant industrial space for direct lease and an additional 1.3M SF of vacant
sublease space. Among the major industrial corridors, the Northeast Corridor
has the lowest vacancy rate at 2.2%, followed by the South at 3.3%, and then
the Inner Loop at 4.6%. The largest percentage of vacant space is located in the
North Corridor which has an 8.5% vacancy rate.
Currently 5.3M SF of industrial space is under construction in Houston, and
30.7% is pre-leased. Only 1.0% of the 3.7M SF of spec space under construction
is pre-leased at this time. The largest project under construction is a 673,785-
SF spec distribution warehouse located in the Northwest Outliers submarket. A
partial list of buildings currently under construction can be found on page 3 of
this report.
Absorption & Demand
Houston’s industrial market posted 3.1M SF of positive net absorption in the
third quarter, bringing the year-to-date total to 6.2M SF. Some of the tenants
contributing to the positive absorption include Amazon which is moving into its
new 855,000 SF fulfillment center in the North Fwy/Tomball Pky submarket,
and FedEx, which is opening its new 800,000 SF distribution warehouse in the
Northwest Outliers submarket. The North and Northwest Corridors saw the
largest positive net absorption during the third quarter, posting 1.3M SF and 1.2M
SF, respectively.
Rental Rates
According to CoStar, our data service provider, Houston’s citywide average
quoted industrial rental rate for all product types decreased marginally over
the quarter from $6.98 to $6.90 per SF NNN. According to Colliers’ internal
data, actual lease transactions are in the $4.56 – $5.04 per SF NNN range for
newer bulk industrial spaces, while flex rates range from $7.20 to $10.80 per
SF depending on the existing improvements or the allowance provided for tenant
improvements and the location of the property.
According to CoStar, the average quoted NNN rental rates by property type are
as follows: $6.55 per SF for Warehouse Distribution space; $10.08 per SF for
Flex/Service space; with Tech/R&D space averaging $10.95 per SF.
4.0%
4.5%
5.0%
5.5%
6.0%
6.5%
$4.00
$5.00
$6.00
$7.00
$8.00
Industrial Rental Rate and Vacancy Percentage
Houston, TX
Avg Quoted Rent Avg Vacancy
*Vacancy percentage includes direct and sublease space.
3 Houston Research & Forecast Report | Q3 2017 | Industrial | Colliers International33
Q3 2017 Industrial Lease Transactions over 50,000 SF
BUILDING NAME/ADDRESS SUBMARKET SF TENANT LEASE DATE
Pinto Business Park North 600,000 Emser Tile2
Aug-17
Prologis Park Jersey Village Northwest 300,000 Home Depot3
Sept-17
Bayport North Distribution Center II Southeast 225,000 Supply Chain Management1,3
Jul-17
Point North Cargo Park Northeast 181,540 Starplast3
Sept-17
Central Green Corporate Center North 128,924 DHL3
Sept-17
Satsuma Distribution Center 1 Northwest 99,840 Mahindra USA Inc.1,3
Aug-17
Leasing Activity
Houston’s industrial leasing activity decreased 39.6% over the quarter from 6.8M SF in Q2 2017 to 4.1M SF in Q3 2017. Most of the
transactions consisted of smaller renewals, but there were several new/direct deals that occurred. The table below highlights some of the
larger transactions that closed in Q3 2017.
1
Colliers International Transaction
2
Pre-lease in a proposed/under construction building
3
Direct/New
Under Construction
Q3 2017 Industrial Under Construction - 200,000 SF or greater
BUSINESS PARK/ADDRESS SUBMARKET RBA % LEASED DEVELOPER/CONTRACTOR
DELIVERY
DATE
BUILDING DESCRIPTION
525 Cane Island Pky Northwest Outlier 673,785 0% Oakmont Industrial Group Jul-18 Spec Distribution
Fallbrook Dr North Fwy/Tomball Pky 600,000 100% Hines Jun-18 BTS Emser Tile
Cedar Port Distribution Park East-Southeast Far 500,000 100% Avera Companies Sep-18 BTS Vinmar International
*4838 Borusan Rd East-Southeast Far 501,020 0% Clay Development Aug-18 Spec Warehouse
Northwest Logistics Center West Outer Loop 411,442 0% Stream Realty Partners, L.P. Jun-18 Spec Distribution
Cutten Distribution Center I North Fwy/Tomball Pky 293,280 0% Clay Development Jan-18 Spec Distribution
Bayport South Business Park
10535 Red Bluff Rd
East-Southeast Far 257,835 0% Johnson Development Feb-18 Spec Distribution
Energy Commerce Bldg D East-Southeast Far 232,960 0% Clay Development Feb-18 Spec Distribution
22533 NW Lake Dr Northwest Outlier 231,839 0% The Carson Companies Mar-18 Spec Warehouse
5121 AmeriPort Pky Bldg VII East-Southeast Far 203,840 100% National Property Holdings Apr-18 Palmer Logistics
*In permitting process
4 Houston Research & Forecast Report | Q3 2017 | Industrial | Colliers International
Q3 2017 Houston Industrial Market Statistical Summary
MARKET
RENTABLE
AREA
DIRECT
VACANT SF
DIRECT
VACANCY
RATE
SUBLET
VACANT
SF
SUBLET
VACANCY
RATE
TOTAL
VACANT SF
TOTAL
VACANCY
RATE
3Q17 NET
ABSORP-
TION
2Q17 NET
ABSORP-
TION
3Q17
COMPLE-
TIONS
2Q17
COMPLE-
TIONS
SF UNDER
CONSTRUC-
TION
Houston Total 547,370,838 28,495,596 5.2% 1,326,106 0.2% 29,821,702 5.4% 3,035,998 (53,222) 2,542,549 1,442,223 5,291,835
CBD-NW Inner Loop 11,590,397 554,493 4.8% 57,205 0.5% 611,698 5.3% (18,707) (189,169) - - 14,250
Downtown 31,411,129 1,510,562 4.8% - 0.0% 1,510,562 4.8% 241,178 (12,626) - - -
North Inner Loop 4,858,519 300,057 6.2% - 0.0% 300,057 6.2% (76,388) (17,964) - - -
Southwest Inner
Loop
7,097,563 78,940 1.1% - 0.0% 78,940 1.1% (17,499) (28,840) - - -
INNER LOOP
CORRIDOR TOTAL
54,957,608 2,444,052 4.4% 57,205 0.1% 2,501,257 4.6% 128,584 (248,599) - - 14,250
North Fwy/Tomball
Pky
23,738,871 2,428,073 10.2% 53,006 0.2% 2,481,079 10.5% 979,380 169,425 865,800 51,146 913,280
North Hardy Toll Rd 33,565,799 3,110,551 9.3% 270,670 0.8% 3,381,221 10.1% 323,516 (7,912) 10,500 - 93,250
North Outer Loop 20,308,494 995,758 4.9% 48,411 0.2% 1,044,169 5.1% 89,746 (96,798) - 35,000 -
The Woodlands/
Conroe
17,247,084 1,063,878 6.2% 55,566 0.3% 1,119,444 6.5% (75,164) (33,377) - 44,250 78,625
NORTH CORRIDOR
TOTAL
94,860,248 7,598,260 8.0% 427,653 0.5% 8,025,913 8.5% 1,317,478 31,338 876,300 130,396 1,085,155
Northeast Hwy 321 1,298,073 37,700 2.9% - 0.0% 37,700 2.9% - - - - -
Northeast Hwy 90 18,010,800 264,467 1.5% - 0.0% 264,467 1.5% 28,239 15,230 - - 164,500
Northeast I-10 3,853,356 64,325 1.7% - 0.0% 64,325 1.7% 15,496 (15,872) - - -
Northeast Inner Loop 11,559,550 411,640 3.6% - 0.0% 411,640 3.6% (17,461) (36,532) - - -
NORTHEAST
CORRIDOR TOTAL
34,721,779 778,132 2.2% - 0.0% 778,132 2.2% 26,274 (37,174) - - 164,500
Hwy 290/Tomball Pky 21,172,066 996,867 4.7% 245,319 1.2% 1,242,186 5.9% 628,322 244,891 - - 30,300
Northwest Hwy 6 9,571,803 453,764 4.7% - 0.0% 453,764 4.7% 38,809 (202,594) - 10,000 172,885
Northwest Inner Loop 59,999,793 2,795,685 4.7% 130,183 0.2% 2,925,868 4.9% (322,315) (238,097) - - 19,000
Northwest Near 17,909,297 618,054 3.5% 11,479 0.1% 629,533 3.5% (89,229) 174,739 - - 154,661
Northwest Outlier 21,826,504 1,129,981 5.2% 24,205 0.1% 1,154,186 5.3% 1,150,770 333,669 983,750 103,040 1,035,319
West Outer Loop 25,483,643 1,471,159 5.8% 199,538 0.8% 1,670,697 6.6% (242,093) (270,196) - 17,000 496,542
NORTHWEST
CORRIDOR TOTAL 155,963,106
7,465,510 4.8% 610,724 0.4% 8,076,234 5.2% 1,164,264 42,412 983,750 130,040 1,908,707
South Highway 35 34,238,534 980,735 2.9% - 0.0% 980,735 2.9% 8,379 (11,592) 41,520 - 97,593
South Inner Loop 12,368,001 553,399 4.5% 8,167 0.1% 561,566 4.5% 9,833 (116,952) - - -
SOUTH CORRIDOR
TOTAL
46,606,535 1,534,134 3.3% 8,167 0.0% 1,542,301 3.3% 18,212 (128,544) 41,520 - 97,593
East I-10 Outer Loop 12,923,577 88,866 0.7% - 0.0% 88,866 0.7% - (12,166) - - -
East-Southeast Far 60,285,414 3,817,886 6.3% 36,550 0.1% 3,854,436 6.4% 574,303 215,886 428,479 1,128,287 1,921,508
Southeast Outer Loop 17,186,203 438,533 2.6% 15,000 0.1% 453,533 2.6% 93,176 (30,600) - - -
SOUTHEAST
CORRIDOR TOTAL
90,395,194 4,345,285 4.8% 51,550 0.1% 4,396,835 4.9% 667,479 173,120 428,479 1,128,287 1,921,508
Highway 59/Highway
90
22,606,039 1,566,381 6.9% 155,464 0.7% 1,721,845 7.6% (120,592) 60,931 - - -
Southwest Far 12,660,888 1,150,880 9.1% 1,000 0.0% 1,151,880 9.1% 229,457 70,675 212,500 10,500 81,372
Southwest Outer
Loop
13,340,177 781,420 5.9% 6,000 0.0% 787,420 5.9% (179,168) (33,343) - - -
Sugar Land/Ft Bend
Co
21,259,264 831,542 3.9% 8,343 0.0% 839,885 4.0% (215,990) 15,962 - 43,000 18,750
SOUTHWEST
CORRIDOR TOTAL
69,866,368 4,330,223 6.2% 170,807 0.2% 4,501,030 6.4% (286,293) 114,225 212,500 53,500 100,122
Market Summary
5 North American Research & Forecast Report | Q4 2014 | Office Market Outlook | Colliers International
Copyright © 2015 Colliers International.
The information contained herein has been obtained from sources deemed reliable. While
every reasonable effort has been made to ensure its accuracy, we cannot guarantee it. No
responsibility is assumed for any inaccuracies. Readers are encouraged to consult their
professional advisors prior to acting on any of the material contained in this report.
Colliers International | Market
000 Address, Suite #
+1 000 000 0000
colliers.com/<<market>>
5 North American Research & Forecast Report | Q4 2014 | Office Market Outlook | Colliers International
Copyright © 2017 Colliers International.
The information contained herein has been obtained from sources deemed reliable. While
every reasonable effort has been made to ensure its accuracy, we cannot guarantee it. No
responsibility is assumed for any inaccuracies. Readers are encouraged to consult their
professional advisors prior to acting on any of the material contained in this report.
Colliers International | Houston
1233 West Loop South, Suite 900
Houston, Texas 77027
+1 713 222 2111
colliers.com/texas/houston
FOR MORE INFORMATION
Lisa Bridges
Director of Market Research | Houston
+1 713 830 2125
lisa.bridges@colliers.com
Q3 Houston Industrial 2017 Highlights
Photo source: porthouston.com

More Related Content

What's hot

Q2 2017 Austin Industrial Research & Forecast Report
Q2 2017 Austin Industrial Research & Forecast Report Q2 2017 Austin Industrial Research & Forecast Report
Q2 2017 Austin Industrial Research & Forecast Report
Colliers International | Houston
 
Q4 2017 | Austin Industrial | Research & Forecast Report
Q4 2017 | Austin Industrial | Research & Forecast ReportQ4 2017 | Austin Industrial | Research & Forecast Report
Q4 2017 | Austin Industrial | Research & Forecast Report
Colliers International | Houston
 
Q1 2018 austin_industrial_market_research_report
Q1 2018 austin_industrial_market_research_reportQ1 2018 austin_industrial_market_research_report
Q1 2018 austin_industrial_market_research_report
Colliers International | Houston
 
Q4 2016 Houston Industrial Research & Forecast Report
Q4 2016 Houston Industrial Research & Forecast Report Q4 2016 Houston Industrial Research & Forecast Report
Q4 2016 Houston Industrial Research & Forecast Report
Colliers International | Houston
 
Q2 2013 Houston Industrial Market Research Report
Q2 2013 Houston Industrial Market Research ReportQ2 2013 Houston Industrial Market Research Report
Q2 2013 Houston Industrial Market Research Report
Colliers International | Houston
 
Q1 2021 | Austin Industrial | Research & Forecast Commericial Real Estate Report
Q1 2021 | Austin Industrial | Research & Forecast Commericial Real Estate ReportQ1 2021 | Austin Industrial | Research & Forecast Commericial Real Estate Report
Q1 2021 | Austin Industrial | Research & Forecast Commericial Real Estate Report
Colliers International | Houston
 
Q4 2019 | Austin Office | Research & Forecast Report
Q4 2019 | Austin Office | Research & Forecast ReportQ4 2019 | Austin Office | Research & Forecast Report
Q4 2019 | Austin Office | Research & Forecast Report
Colliers International | Houston
 
Q1 2017 Austin Industrial Research & Forecast Report
Q1 2017 Austin Industrial Research & Forecast Report Q1 2017 Austin Industrial Research & Forecast Report
Q1 2017 Austin Industrial Research & Forecast Report
Kaitlin Holm
 
Q2 2019 | Austin Industrial | Research & Forecast Report
Q2 2019 | Austin Industrial | Research & Forecast ReportQ2 2019 | Austin Industrial | Research & Forecast Report
Q2 2019 | Austin Industrial | Research & Forecast Report
Colliers International | Houston
 
Q2 2018 | Houston Office | Research & Forecast Report
Q2 2018 | Houston Office | Research & Forecast ReportQ2 2018 | Houston Office | Research & Forecast Report
Q2 2018 | Houston Office | Research & Forecast Report
Colliers International | Houston
 
Q3 2013 Houston Office Market Research Report
Q3 2013 Houston Office Market Research ReportQ3 2013 Houston Office Market Research Report
Q3 2013 Houston Office Market Research Report
Colliers International | Houston
 
Q2 2017 | Austin Office | Research & Forecast Report
Q2 2017 | Austin Office | Research & Forecast ReportQ2 2017 | Austin Office | Research & Forecast Report
Q2 2017 | Austin Office | Research & Forecast Report
Colliers International | Houston
 
C&W MARKETBEAT- U.S INDUSTRIAL Q4 2016 – #CRE #REALESTATE #CCIM #SIOR
C&W MARKETBEAT- U.S INDUSTRIAL Q4 2016 – #CRE #REALESTATE #CCIM #SIORC&W MARKETBEAT- U.S INDUSTRIAL Q4 2016 – #CRE #REALESTATE #CCIM #SIOR
C&W MARKETBEAT- U.S INDUSTRIAL Q4 2016 – #CRE #REALESTATE #CCIM #SIOR
Guy Masse
 
Q2 2012 Houston Industrial Market Report
Q2 2012 Houston Industrial Market ReportQ2 2012 Houston Industrial Market Report
Q2 2012 Houston Industrial Market Report
Coy Davidson
 
Q3 2015 Houston Industrial Market Research & Forecast Report
Q3 2015 Houston Industrial Market Research & Forecast ReportQ3 2015 Houston Industrial Market Research & Forecast Report
Q3 2015 Houston Industrial Market Research & Forecast Report
Colliers International | Houston
 
Q4 2011 Houston Industrial Market Report
Q4 2011 Houston Industrial Market ReportQ4 2011 Houston Industrial Market Report
Q4 2011 Houston Industrial Market Report
Coy Davidson
 
St. Louis Industrial Outlook Q3 2016
St. Louis Industrial Outlook Q3 2016St. Louis Industrial Outlook Q3 2016
St. Louis Industrial Outlook Q3 2016
Blaise Tomazic
 
Q3 2015 Austin Industrial Market Research Report
Q3 2015 Austin Industrial Market Research ReportQ3 2015 Austin Industrial Market Research Report
Q3 2015 Austin Industrial Market Research Report
Colliers International | Houston
 
2019 Q4 Industrial St. Louis Report Colliers
2019 Q4 Industrial St. Louis Report Colliers2019 Q4 Industrial St. Louis Report Colliers
2019 Q4 Industrial St. Louis Report Colliers
ColliersSTL
 

What's hot (19)

Q2 2017 Austin Industrial Research & Forecast Report
Q2 2017 Austin Industrial Research & Forecast Report Q2 2017 Austin Industrial Research & Forecast Report
Q2 2017 Austin Industrial Research & Forecast Report
 
Q4 2017 | Austin Industrial | Research & Forecast Report
Q4 2017 | Austin Industrial | Research & Forecast ReportQ4 2017 | Austin Industrial | Research & Forecast Report
Q4 2017 | Austin Industrial | Research & Forecast Report
 
Q1 2018 austin_industrial_market_research_report
Q1 2018 austin_industrial_market_research_reportQ1 2018 austin_industrial_market_research_report
Q1 2018 austin_industrial_market_research_report
 
Q4 2016 Houston Industrial Research & Forecast Report
Q4 2016 Houston Industrial Research & Forecast Report Q4 2016 Houston Industrial Research & Forecast Report
Q4 2016 Houston Industrial Research & Forecast Report
 
Q2 2013 Houston Industrial Market Research Report
Q2 2013 Houston Industrial Market Research ReportQ2 2013 Houston Industrial Market Research Report
Q2 2013 Houston Industrial Market Research Report
 
Q1 2021 | Austin Industrial | Research & Forecast Commericial Real Estate Report
Q1 2021 | Austin Industrial | Research & Forecast Commericial Real Estate ReportQ1 2021 | Austin Industrial | Research & Forecast Commericial Real Estate Report
Q1 2021 | Austin Industrial | Research & Forecast Commericial Real Estate Report
 
Q4 2019 | Austin Office | Research & Forecast Report
Q4 2019 | Austin Office | Research & Forecast ReportQ4 2019 | Austin Office | Research & Forecast Report
Q4 2019 | Austin Office | Research & Forecast Report
 
Q1 2017 Austin Industrial Research & Forecast Report
Q1 2017 Austin Industrial Research & Forecast Report Q1 2017 Austin Industrial Research & Forecast Report
Q1 2017 Austin Industrial Research & Forecast Report
 
Q2 2019 | Austin Industrial | Research & Forecast Report
Q2 2019 | Austin Industrial | Research & Forecast ReportQ2 2019 | Austin Industrial | Research & Forecast Report
Q2 2019 | Austin Industrial | Research & Forecast Report
 
Q2 2018 | Houston Office | Research & Forecast Report
Q2 2018 | Houston Office | Research & Forecast ReportQ2 2018 | Houston Office | Research & Forecast Report
Q2 2018 | Houston Office | Research & Forecast Report
 
Q3 2013 Houston Office Market Research Report
Q3 2013 Houston Office Market Research ReportQ3 2013 Houston Office Market Research Report
Q3 2013 Houston Office Market Research Report
 
Q2 2017 | Austin Office | Research & Forecast Report
Q2 2017 | Austin Office | Research & Forecast ReportQ2 2017 | Austin Office | Research & Forecast Report
Q2 2017 | Austin Office | Research & Forecast Report
 
C&W MARKETBEAT- U.S INDUSTRIAL Q4 2016 – #CRE #REALESTATE #CCIM #SIOR
C&W MARKETBEAT- U.S INDUSTRIAL Q4 2016 – #CRE #REALESTATE #CCIM #SIORC&W MARKETBEAT- U.S INDUSTRIAL Q4 2016 – #CRE #REALESTATE #CCIM #SIOR
C&W MARKETBEAT- U.S INDUSTRIAL Q4 2016 – #CRE #REALESTATE #CCIM #SIOR
 
Q2 2012 Houston Industrial Market Report
Q2 2012 Houston Industrial Market ReportQ2 2012 Houston Industrial Market Report
Q2 2012 Houston Industrial Market Report
 
Q3 2015 Houston Industrial Market Research & Forecast Report
Q3 2015 Houston Industrial Market Research & Forecast ReportQ3 2015 Houston Industrial Market Research & Forecast Report
Q3 2015 Houston Industrial Market Research & Forecast Report
 
Q4 2011 Houston Industrial Market Report
Q4 2011 Houston Industrial Market ReportQ4 2011 Houston Industrial Market Report
Q4 2011 Houston Industrial Market Report
 
St. Louis Industrial Outlook Q3 2016
St. Louis Industrial Outlook Q3 2016St. Louis Industrial Outlook Q3 2016
St. Louis Industrial Outlook Q3 2016
 
Q3 2015 Austin Industrial Market Research Report
Q3 2015 Austin Industrial Market Research ReportQ3 2015 Austin Industrial Market Research Report
Q3 2015 Austin Industrial Market Research Report
 
2019 Q4 Industrial St. Louis Report Colliers
2019 Q4 Industrial St. Louis Report Colliers2019 Q4 Industrial St. Louis Report Colliers
2019 Q4 Industrial St. Louis Report Colliers
 

Similar to Q3 2017 | Houston Industrial | Research & Forecast Report

Q3 2020 | Austin Industrial | Research & Forecast Report
Q3 2020 | Austin Industrial | Research & Forecast ReportQ3 2020 | Austin Industrial | Research & Forecast Report
Q3 2020 | Austin Industrial | Research & Forecast Report
Colliers International | Houston
 
Q1 2019 | Houston Industrial | Research & Forecast Report
Q1 2019 | Houston Industrial | Research & Forecast ReportQ1 2019 | Houston Industrial | Research & Forecast Report
Q1 2019 | Houston Industrial | Research & Forecast Report
Colliers International | Houston
 
Q3 2019 | Austin Industrial | Research & Forecast Report
Q3 2019 | Austin Industrial | Research & Forecast ReportQ3 2019 | Austin Industrial | Research & Forecast Report
Q3 2019 | Austin Industrial | Research & Forecast Report
Colliers International | Houston
 
Austin’s industrial market closes 2018 with new buildings and high absorption
Austin’s industrial market closes 2018 with new buildings and high absorptionAustin’s industrial market closes 2018 with new buildings and high absorption
Austin’s industrial market closes 2018 with new buildings and high absorption
Colliers International | Houston
 
Q4 2019 | Houston Industrial | Research & Forecast Report
Q4 2019 | Houston Industrial  | Research & Forecast ReportQ4 2019 | Houston Industrial  | Research & Forecast Report
Q4 2019 | Houston Industrial | Research & Forecast Report
Colliers International | Houston
 
Q1 2020 | Houston Industrial Market Report
Q1 2020 | Houston Industrial Market ReportQ1 2020 | Houston Industrial Market Report
Q1 2020 | Houston Industrial Market Report
Colliers International | Houston
 
Q2 2013 Houston Office Market Research Report
Q2 2013 Houston Office Market Research ReportQ2 2013 Houston Office Market Research Report
Q2 2013 Houston Office Market Research Report
Colliers International | Houston
 
Q2 2014 Houston Industrial Market Report
Q2 2014 Houston Industrial Market ReportQ2 2014 Houston Industrial Market Report
Q2 2014 Houston Industrial Market Report
Colliers International | Houston
 
Q2 2018 | Houston Office Sublease | Research & Forecast Report
Q2 2018 | Houston Office Sublease | Research & Forecast ReportQ2 2018 | Houston Office Sublease | Research & Forecast Report
Q2 2018 | Houston Office Sublease | Research & Forecast Report
Colliers International | Houston
 
JLL Louisville Industrial Outlook - Q1 2019
JLL Louisville Industrial Outlook - Q1 2019JLL Louisville Industrial Outlook - Q1 2019
JLL Louisville Industrial Outlook - Q1 2019
Alex Westcott
 
Q2 2015 Austin Industrial Market Research & Forecast Report
Q2 2015 Austin Industrial Market Research & Forecast ReportQ2 2015 Austin Industrial Market Research & Forecast Report
Q2 2015 Austin Industrial Market Research & Forecast Report
Colliers International | Houston
 
Q4 2013 Houston Industrial Market Research Report
Q4 2013 Houston Industrial Market Research ReportQ4 2013 Houston Industrial Market Research Report
Q4 2013 Houston Industrial Market Research Report
Colliers International | Houston
 
Q2 2019 | Austin Office | Research & Forecast Report
Q2 2019 | Austin Office | Research & Forecast ReportQ2 2019 | Austin Office | Research & Forecast Report
Q2 2019 | Austin Office | Research & Forecast Report
Colliers International | Houston
 
Q3 2013 Houston Industrial Market Research Report
Q3 2013 Houston Industrial Market Research ReportQ3 2013 Houston Industrial Market Research Report
Q3 2013 Houston Industrial Market Research Report
Colliers International | Houston
 
JLL Louisville Industrial Outlook - Q1 2019
JLL Louisville Industrial Outlook - Q1 2019JLL Louisville Industrial Outlook - Q1 2019
JLL Louisville Industrial Outlook - Q1 2019
Alex Westcott
 
Q4 2020 | Houston Office | Research & Forecast Report
Q4 2020 | Houston Office | Research & Forecast ReportQ4 2020 | Houston Office | Research & Forecast Report
Q4 2020 | Houston Office | Research & Forecast Report
Colliers International | Houston
 
Q1 2018 | Houston Office | Research & Forecast Report
Q1 2018 | Houston Office | Research & Forecast ReportQ1 2018 | Houston Office | Research & Forecast Report
Q1 2018 | Houston Office | Research & Forecast Report
Colliers International | Houston
 
Q3 2019 | Austin Office | Research & Forecast Report
Q3 2019 | Austin Office | Research & Forecast ReportQ3 2019 | Austin Office | Research & Forecast Report
Q3 2019 | Austin Office | Research & Forecast Report
Colliers International | Houston
 
JLL Louisville Industrial Outlook - Q4 2016
JLL Louisville Industrial Outlook - Q4 2016JLL Louisville Industrial Outlook - Q4 2016
JLL Louisville Industrial Outlook - Q4 2016
Ross Bratcher
 
Q1 2014 Houston Industrial Market Research & Forecast Report
Q1 2014 Houston Industrial Market Research & Forecast ReportQ1 2014 Houston Industrial Market Research & Forecast Report
Q1 2014 Houston Industrial Market Research & Forecast Report
Colliers International | Houston
 

Similar to Q3 2017 | Houston Industrial | Research & Forecast Report (20)

Q3 2020 | Austin Industrial | Research & Forecast Report
Q3 2020 | Austin Industrial | Research & Forecast ReportQ3 2020 | Austin Industrial | Research & Forecast Report
Q3 2020 | Austin Industrial | Research & Forecast Report
 
Q1 2019 | Houston Industrial | Research & Forecast Report
Q1 2019 | Houston Industrial | Research & Forecast ReportQ1 2019 | Houston Industrial | Research & Forecast Report
Q1 2019 | Houston Industrial | Research & Forecast Report
 
Q3 2019 | Austin Industrial | Research & Forecast Report
Q3 2019 | Austin Industrial | Research & Forecast ReportQ3 2019 | Austin Industrial | Research & Forecast Report
Q3 2019 | Austin Industrial | Research & Forecast Report
 
Austin’s industrial market closes 2018 with new buildings and high absorption
Austin’s industrial market closes 2018 with new buildings and high absorptionAustin’s industrial market closes 2018 with new buildings and high absorption
Austin’s industrial market closes 2018 with new buildings and high absorption
 
Q4 2019 | Houston Industrial | Research & Forecast Report
Q4 2019 | Houston Industrial  | Research & Forecast ReportQ4 2019 | Houston Industrial  | Research & Forecast Report
Q4 2019 | Houston Industrial | Research & Forecast Report
 
Q1 2020 | Houston Industrial Market Report
Q1 2020 | Houston Industrial Market ReportQ1 2020 | Houston Industrial Market Report
Q1 2020 | Houston Industrial Market Report
 
Q2 2013 Houston Office Market Research Report
Q2 2013 Houston Office Market Research ReportQ2 2013 Houston Office Market Research Report
Q2 2013 Houston Office Market Research Report
 
Q2 2014 Houston Industrial Market Report
Q2 2014 Houston Industrial Market ReportQ2 2014 Houston Industrial Market Report
Q2 2014 Houston Industrial Market Report
 
Q2 2018 | Houston Office Sublease | Research & Forecast Report
Q2 2018 | Houston Office Sublease | Research & Forecast ReportQ2 2018 | Houston Office Sublease | Research & Forecast Report
Q2 2018 | Houston Office Sublease | Research & Forecast Report
 
JLL Louisville Industrial Outlook - Q1 2019
JLL Louisville Industrial Outlook - Q1 2019JLL Louisville Industrial Outlook - Q1 2019
JLL Louisville Industrial Outlook - Q1 2019
 
Q2 2015 Austin Industrial Market Research & Forecast Report
Q2 2015 Austin Industrial Market Research & Forecast ReportQ2 2015 Austin Industrial Market Research & Forecast Report
Q2 2015 Austin Industrial Market Research & Forecast Report
 
Q4 2013 Houston Industrial Market Research Report
Q4 2013 Houston Industrial Market Research ReportQ4 2013 Houston Industrial Market Research Report
Q4 2013 Houston Industrial Market Research Report
 
Q2 2019 | Austin Office | Research & Forecast Report
Q2 2019 | Austin Office | Research & Forecast ReportQ2 2019 | Austin Office | Research & Forecast Report
Q2 2019 | Austin Office | Research & Forecast Report
 
Q3 2013 Houston Industrial Market Research Report
Q3 2013 Houston Industrial Market Research ReportQ3 2013 Houston Industrial Market Research Report
Q3 2013 Houston Industrial Market Research Report
 
JLL Louisville Industrial Outlook - Q1 2019
JLL Louisville Industrial Outlook - Q1 2019JLL Louisville Industrial Outlook - Q1 2019
JLL Louisville Industrial Outlook - Q1 2019
 
Q4 2020 | Houston Office | Research & Forecast Report
Q4 2020 | Houston Office | Research & Forecast ReportQ4 2020 | Houston Office | Research & Forecast Report
Q4 2020 | Houston Office | Research & Forecast Report
 
Q1 2018 | Houston Office | Research & Forecast Report
Q1 2018 | Houston Office | Research & Forecast ReportQ1 2018 | Houston Office | Research & Forecast Report
Q1 2018 | Houston Office | Research & Forecast Report
 
Q3 2019 | Austin Office | Research & Forecast Report
Q3 2019 | Austin Office | Research & Forecast ReportQ3 2019 | Austin Office | Research & Forecast Report
Q3 2019 | Austin Office | Research & Forecast Report
 
JLL Louisville Industrial Outlook - Q4 2016
JLL Louisville Industrial Outlook - Q4 2016JLL Louisville Industrial Outlook - Q4 2016
JLL Louisville Industrial Outlook - Q4 2016
 
Q1 2014 Houston Industrial Market Research & Forecast Report
Q1 2014 Houston Industrial Market Research & Forecast ReportQ1 2014 Houston Industrial Market Research & Forecast Report
Q1 2014 Houston Industrial Market Research & Forecast Report
 

More from Colliers International | Houston

Q1 2022 Austin Industrial Report
Q1 2022 Austin Industrial ReportQ1 2022 Austin Industrial Report
Q1 2022 Austin Industrial Report
Colliers International | Houston
 
Q1 2022 Austin Office Market Report
Q1 2022 Austin Office Market ReportQ1 2022 Austin Office Market Report
Q1 2022 Austin Office Market Report
Colliers International | Houston
 
2021 Q3 Office Austin Report
2021 Q3 Office Austin Report2021 Q3 Office Austin Report
2021 Q3 Office Austin Report
Colliers International | Houston
 
Q2 2021 Austin Industrial Report
Q2 2021 Austin Industrial ReportQ2 2021 Austin Industrial Report
Q2 2021 Austin Industrial Report
Colliers International | Houston
 
Q2 2021 Austin Office Report
Q2 2021 Austin Office ReportQ2 2021 Austin Office Report
Q2 2021 Austin Office Report
Colliers International | Houston
 
Q1 2021 Austin Office Report
Q1 2021 Austin Office ReportQ1 2021 Austin Office Report
Q1 2021 Austin Office Report
Colliers International | Houston
 
Colliers Q4 2020 Austin Industrial Report
Colliers Q4 2020 Austin Industrial ReportColliers Q4 2020 Austin Industrial Report
Colliers Q4 2020 Austin Industrial Report
Colliers International | Houston
 
Q4 2020 Austin Office Report
Q4 2020 Austin Office ReportQ4 2020 Austin Office Report
Q4 2020 Austin Office Report
Colliers International | Houston
 
Q3 2020 | The Woodlands Office | Research Snapshot
Q3 2020 | The Woodlands Office | Research SnapshotQ3 2020 | The Woodlands Office | Research Snapshot
Q3 2020 | The Woodlands Office | Research Snapshot
Colliers International | Houston
 
Q3 2020 | Fort Bend | Submarket Snapshot
Q3 2020 | Fort Bend | Submarket SnapshotQ3 2020 | Fort Bend | Submarket Snapshot
Q3 2020 | Fort Bend | Submarket Snapshot
Colliers International | Houston
 
Q3 2020 | Austin Office | Research & Forecast Report
Q3 2020 | Austin Office | Research & Forecast ReportQ3 2020 | Austin Office | Research & Forecast Report
Q3 2020 | Austin Office | Research & Forecast Report
Colliers International | Houston
 
Q3 2020 | Houston Office | Research & Forecast Report
Q3 2020 | Houston Office | Research & Forecast ReportQ3 2020 | Houston Office | Research & Forecast Report
Q3 2020 | Houston Office | Research & Forecast Report
Colliers International | Houston
 
Q2 2020 | The Woodlands Office | Research Snapshot
Q2 2020 | The Woodlands Office | Research SnapshotQ2 2020 | The Woodlands Office | Research Snapshot
Q2 2020 | The Woodlands Office | Research Snapshot
Colliers International | Houston
 
Q2 2020 | E Fort Bend Commercial Real Estate Trends
Q2 2020 | E Fort Bend Commercial Real Estate TrendsQ2 2020 | E Fort Bend Commercial Real Estate Trends
Q2 2020 | E Fort Bend Commercial Real Estate Trends
Colliers International | Houston
 
Mid-Year 2020 | Houston Healthcare | Market Report
Mid-Year 2020 | Houston Healthcare | Market ReportMid-Year 2020 | Houston Healthcare | Market Report
Mid-Year 2020 | Houston Healthcare | Market Report
Colliers International | Houston
 
Q2 2020 | Austin Office | Research & Forecast Report
Q2 2020 | Austin Office | Research & Forecast ReportQ2 2020 | Austin Office | Research & Forecast Report
Q2 2020 | Austin Office | Research & Forecast Report
Colliers International | Houston
 
Q1 2020 | The Woodlands Office | Research Snapshot
Q1 2020 | The Woodlands Office | Research SnapshotQ1 2020 | The Woodlands Office | Research Snapshot
Q1 2020 | The Woodlands Office | Research Snapshot
Colliers International | Houston
 
Q1 2020 | Fort Bend Submarket Snapshot
Q1 2020 | Fort Bend Submarket SnapshotQ1 2020 | Fort Bend Submarket Snapshot
Q1 2020 | Fort Bend Submarket Snapshot
Colliers International | Houston
 
Q1 2020 | Houston Retail | Research & Forecast Report
Q1 2020 | Houston Retail | Research & Forecast ReportQ1 2020 | Houston Retail | Research & Forecast Report
Q1 2020 | Houston Retail | Research & Forecast Report
Colliers International | Houston
 
Q1 2020 | Austin Office | Research & Forecast Report
Q1 2020 | Austin Office | Research & Forecast ReportQ1 2020 | Austin Office | Research & Forecast Report
Q1 2020 | Austin Office | Research & Forecast Report
Colliers International | Houston
 

More from Colliers International | Houston (20)

Q1 2022 Austin Industrial Report
Q1 2022 Austin Industrial ReportQ1 2022 Austin Industrial Report
Q1 2022 Austin Industrial Report
 
Q1 2022 Austin Office Market Report
Q1 2022 Austin Office Market ReportQ1 2022 Austin Office Market Report
Q1 2022 Austin Office Market Report
 
2021 Q3 Office Austin Report
2021 Q3 Office Austin Report2021 Q3 Office Austin Report
2021 Q3 Office Austin Report
 
Q2 2021 Austin Industrial Report
Q2 2021 Austin Industrial ReportQ2 2021 Austin Industrial Report
Q2 2021 Austin Industrial Report
 
Q2 2021 Austin Office Report
Q2 2021 Austin Office ReportQ2 2021 Austin Office Report
Q2 2021 Austin Office Report
 
Q1 2021 Austin Office Report
Q1 2021 Austin Office ReportQ1 2021 Austin Office Report
Q1 2021 Austin Office Report
 
Colliers Q4 2020 Austin Industrial Report
Colliers Q4 2020 Austin Industrial ReportColliers Q4 2020 Austin Industrial Report
Colliers Q4 2020 Austin Industrial Report
 
Q4 2020 Austin Office Report
Q4 2020 Austin Office ReportQ4 2020 Austin Office Report
Q4 2020 Austin Office Report
 
Q3 2020 | The Woodlands Office | Research Snapshot
Q3 2020 | The Woodlands Office | Research SnapshotQ3 2020 | The Woodlands Office | Research Snapshot
Q3 2020 | The Woodlands Office | Research Snapshot
 
Q3 2020 | Fort Bend | Submarket Snapshot
Q3 2020 | Fort Bend | Submarket SnapshotQ3 2020 | Fort Bend | Submarket Snapshot
Q3 2020 | Fort Bend | Submarket Snapshot
 
Q3 2020 | Austin Office | Research & Forecast Report
Q3 2020 | Austin Office | Research & Forecast ReportQ3 2020 | Austin Office | Research & Forecast Report
Q3 2020 | Austin Office | Research & Forecast Report
 
Q3 2020 | Houston Office | Research & Forecast Report
Q3 2020 | Houston Office | Research & Forecast ReportQ3 2020 | Houston Office | Research & Forecast Report
Q3 2020 | Houston Office | Research & Forecast Report
 
Q2 2020 | The Woodlands Office | Research Snapshot
Q2 2020 | The Woodlands Office | Research SnapshotQ2 2020 | The Woodlands Office | Research Snapshot
Q2 2020 | The Woodlands Office | Research Snapshot
 
Q2 2020 | E Fort Bend Commercial Real Estate Trends
Q2 2020 | E Fort Bend Commercial Real Estate TrendsQ2 2020 | E Fort Bend Commercial Real Estate Trends
Q2 2020 | E Fort Bend Commercial Real Estate Trends
 
Mid-Year 2020 | Houston Healthcare | Market Report
Mid-Year 2020 | Houston Healthcare | Market ReportMid-Year 2020 | Houston Healthcare | Market Report
Mid-Year 2020 | Houston Healthcare | Market Report
 
Q2 2020 | Austin Office | Research & Forecast Report
Q2 2020 | Austin Office | Research & Forecast ReportQ2 2020 | Austin Office | Research & Forecast Report
Q2 2020 | Austin Office | Research & Forecast Report
 
Q1 2020 | The Woodlands Office | Research Snapshot
Q1 2020 | The Woodlands Office | Research SnapshotQ1 2020 | The Woodlands Office | Research Snapshot
Q1 2020 | The Woodlands Office | Research Snapshot
 
Q1 2020 | Fort Bend Submarket Snapshot
Q1 2020 | Fort Bend Submarket SnapshotQ1 2020 | Fort Bend Submarket Snapshot
Q1 2020 | Fort Bend Submarket Snapshot
 
Q1 2020 | Houston Retail | Research & Forecast Report
Q1 2020 | Houston Retail | Research & Forecast ReportQ1 2020 | Houston Retail | Research & Forecast Report
Q1 2020 | Houston Retail | Research & Forecast Report
 
Q1 2020 | Austin Office | Research & Forecast Report
Q1 2020 | Austin Office | Research & Forecast ReportQ1 2020 | Austin Office | Research & Forecast Report
Q1 2020 | Austin Office | Research & Forecast Report
 

Recently uploaded

Stark Builders: Where Quality Meets Craftsmanship!
Stark Builders: Where Quality Meets Craftsmanship!Stark Builders: Where Quality Meets Craftsmanship!
Stark Builders: Where Quality Meets Craftsmanship!
shuilykhatunnil
 
Why is Revit MEP Outsourcing considered an as good option for construction pr...
Why is Revit MEP Outsourcing considered an as good option for construction pr...Why is Revit MEP Outsourcing considered an as good option for construction pr...
Why is Revit MEP Outsourcing considered an as good option for construction pr...
MarsBIM1
 
Future of andhra pradesh real estate.pdf
Future of andhra pradesh real estate.pdfFuture of andhra pradesh real estate.pdf
Future of andhra pradesh real estate.pdf
narinav14
 
Living in an UBER World - June '24 Sales Meeting
Living in an UBER World - June '24 Sales MeetingLiving in an UBER World - June '24 Sales Meeting
Living in an UBER World - June '24 Sales Meeting
Tom Blefko
 
Anilesh Ahuja Pioneering a Paradigm Shift in Real Estate Success.pptx
Anilesh Ahuja Pioneering a Paradigm Shift in Real Estate Success.pptxAnilesh Ahuja Pioneering a Paradigm Shift in Real Estate Success.pptx
Anilesh Ahuja Pioneering a Paradigm Shift in Real Estate Success.pptx
neilahuja668
 
Listing Turkey - Piyalepasa Istanbul Catalog
Listing Turkey -  Piyalepasa Istanbul CatalogListing Turkey -  Piyalepasa Istanbul Catalog
Listing Turkey - Piyalepasa Istanbul Catalog
Listing Turkey
 
Sunrise Infra Properties Company Profile Pradeep.pdf
Sunrise Infra Properties Company Profile Pradeep.pdfSunrise Infra Properties Company Profile Pradeep.pdf
Sunrise Infra Properties Company Profile Pradeep.pdf
babugunda75
 
Office Building for Sale - 2810 City View Drive, Madison, WI
Office Building for Sale - 2810 City View Drive, Madison, WIOffice Building for Sale - 2810 City View Drive, Madison, WI
Office Building for Sale - 2810 City View Drive, Madison, WI
Lee & Associates of Madison, WI
 
Signature Global TITANIUM SPR | 3.5 & 4.5BHK High rise Apartments in Gurgaon
Signature Global TITANIUM SPR  | 3.5 & 4.5BHK High rise Apartments in GurgaonSignature Global TITANIUM SPR  | 3.5 & 4.5BHK High rise Apartments in Gurgaon
Signature Global TITANIUM SPR | 3.5 & 4.5BHK High rise Apartments in Gurgaon
globalsignature2022
 
SVN Live 6.17.24 Weekly Property Broadcast
SVN Live 6.17.24 Weekly Property BroadcastSVN Live 6.17.24 Weekly Property Broadcast
SVN Live 6.17.24 Weekly Property Broadcast
SVN International Corp.
 
Floople Real Estate Market in the UK - Current Trends and Future Prospects
Floople Real Estate Market in the UK - Current Trends and Future ProspectsFloople Real Estate Market in the UK - Current Trends and Future Prospects
Floople Real Estate Market in the UK - Current Trends and Future Prospects
Floople
 

Recently uploaded (11)

Stark Builders: Where Quality Meets Craftsmanship!
Stark Builders: Where Quality Meets Craftsmanship!Stark Builders: Where Quality Meets Craftsmanship!
Stark Builders: Where Quality Meets Craftsmanship!
 
Why is Revit MEP Outsourcing considered an as good option for construction pr...
Why is Revit MEP Outsourcing considered an as good option for construction pr...Why is Revit MEP Outsourcing considered an as good option for construction pr...
Why is Revit MEP Outsourcing considered an as good option for construction pr...
 
Future of andhra pradesh real estate.pdf
Future of andhra pradesh real estate.pdfFuture of andhra pradesh real estate.pdf
Future of andhra pradesh real estate.pdf
 
Living in an UBER World - June '24 Sales Meeting
Living in an UBER World - June '24 Sales MeetingLiving in an UBER World - June '24 Sales Meeting
Living in an UBER World - June '24 Sales Meeting
 
Anilesh Ahuja Pioneering a Paradigm Shift in Real Estate Success.pptx
Anilesh Ahuja Pioneering a Paradigm Shift in Real Estate Success.pptxAnilesh Ahuja Pioneering a Paradigm Shift in Real Estate Success.pptx
Anilesh Ahuja Pioneering a Paradigm Shift in Real Estate Success.pptx
 
Listing Turkey - Piyalepasa Istanbul Catalog
Listing Turkey -  Piyalepasa Istanbul CatalogListing Turkey -  Piyalepasa Istanbul Catalog
Listing Turkey - Piyalepasa Istanbul Catalog
 
Sunrise Infra Properties Company Profile Pradeep.pdf
Sunrise Infra Properties Company Profile Pradeep.pdfSunrise Infra Properties Company Profile Pradeep.pdf
Sunrise Infra Properties Company Profile Pradeep.pdf
 
Office Building for Sale - 2810 City View Drive, Madison, WI
Office Building for Sale - 2810 City View Drive, Madison, WIOffice Building for Sale - 2810 City View Drive, Madison, WI
Office Building for Sale - 2810 City View Drive, Madison, WI
 
Signature Global TITANIUM SPR | 3.5 & 4.5BHK High rise Apartments in Gurgaon
Signature Global TITANIUM SPR  | 3.5 & 4.5BHK High rise Apartments in GurgaonSignature Global TITANIUM SPR  | 3.5 & 4.5BHK High rise Apartments in Gurgaon
Signature Global TITANIUM SPR | 3.5 & 4.5BHK High rise Apartments in Gurgaon
 
SVN Live 6.17.24 Weekly Property Broadcast
SVN Live 6.17.24 Weekly Property BroadcastSVN Live 6.17.24 Weekly Property Broadcast
SVN Live 6.17.24 Weekly Property Broadcast
 
Floople Real Estate Market in the UK - Current Trends and Future Prospects
Floople Real Estate Market in the UK - Current Trends and Future ProspectsFloople Real Estate Market in the UK - Current Trends and Future Prospects
Floople Real Estate Market in the UK - Current Trends and Future Prospects
 

Q3 2017 | Houston Industrial | Research & Forecast Report

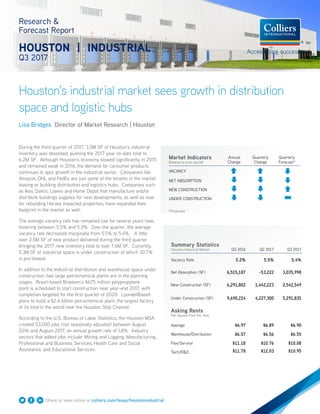
  • 1. Share or view online at colliers.com/texas/houstonindustrial Houston’s industrial market sees growth in distribution space and logistic hubs Research & Forecast Report HOUSTON | INDUSTRIAL Q3 2017 Lisa Bridges Director of Market Research | Houston During the third quarter of 2017, 3.0M SF of Houston’s industrial inventory was absorbed, pushing the 2017 year-to-date total to 6.2M SF. Although Houston’s economy slowed significantly in 2015 and remained weak in 2016, the demand for consumer products continues to spur growth in the industrial sector. Companies like Amazon, DHL and FedEx are just some of the tenants in the market leasing or building distribution and logistics hubs. Companies such as Ikea, Daikin, Lowes and Home Depot that manufacture and/or distribute buildings supplies for new developments, as well as now for rebuilding Harvey impacted properties, have expanded their footprint in the market as well. The average vacancy rate has remained low for several years now, hovering between 5.5% and 5.3%. Over the quarter, the average vacancy rate decreased marginally from 5.5% to 5.4%. A little over 2.5M SF of new product delivered during the third quarter bringing the 2017 new inventory total to over 7.6M SF. Currently, 5.3M SF of industrial space is under construction of which 30.7% is pre-leased. In addition to the Industrial distribution and warehouse space under construction, two large petrochemical plants are in the planning stages. Brazil-based Braskem’s $675 million polypropylene plant is scheduled to start construction near year-end 2017, with completion targeted for the first quarter of 2020. LyondellBasell plans to build a $2.4 billion petrochemical plant, the largest factory of its kind in the world near the Houston Ship Channel. According to the U.S. Bureau of Labor Statistics, the Houston MSA created 53,500 jobs (not seasonally adjusted) between August 2016 and August 2017, an annual growth rate of 1.8%. Industry sectors that added jobs include: Mining and Logging, Manufacturing, Professional and Business Services, Health Care and Social Assistance, and Educational Services. Summary Statistics Houston Industrial Market Q3 2016 Q2 2017 Q3 2017 Vacancy Rate 5.2% 5.5% 5.4% Net Absorption (SF) 6,515,187 -53,222 3,035,998 New Construction (SF) 6,291,802 1,442,223 2,542,549 Under Construction (SF) 9,690,224 4,227,300 5,291,835 Asking Rents Per Square Foot Per Year Average $6.97 $6.89 $6.90 Warehouse/Distribution $6.57 $6.56 $6.55 Flex/Service $11.18 $10.76 $10.08 Tech/R&D $11.78 $12.03 $10.95 Market Indicators Relative to prior period Annual Change Quarterly Change Quarterly Forecast* VACANCY NET ABSORPTION NEW CONSTRUCTION UNDER CONSTRUCTION *Projected
  • 2. Change in Sales (Year over Year) ©2016 Real Capital Analytics, Inc. All Rights Reserved. Data belie revision -100.0% -50.0% 0.0% 50.0% 100.0% 150.0% 200.0% 250.0% 300.0% Q3 '13 Q3 '14 Q3 '15 Q3 '16 Q3 '17 Average Price Per SF ©2016 Real Capital Analytics, Inc. All Rights Reserved. Data believed revision $0 $20 $40 $60 $80 $100 Q3 '13 Q3 '14 Q3 '15 Q3 '16 Q3 '17 Average CAP Rate 6.4% 6.9% 7.4% 7.9% 8.4% 8.9% Q3 '13 Q3 '14 Q3 '15 Q3 '16 Q3 '17 2 Houston Research & Forecast Report | Q3 2017 | Industrial | Colliers International Sales Activity Source: Real Capital Analytics Q3 2017 NO. OF PROPERTIES: 34 TOTAL SF: 3.7M AVERAGE $/SF: $81 AVERAGE CAP RATE: 7.3% Job Growth & Unemployment (not seasonally adjusted) UNEMPLOYMENT 8/16 8/17 HOUSTON 5.7% 5.2% TEXAS 4.9% 4.5% U.S. 5.1% 4.5% JOB GROWTH Annual Change # of Jobs Added HOUSTON 1.8% 53.5K TEXAS 2.4% 286.3K U.S. 1.5% 2.1M Vacancy & Availability Houston’s average industrial vacancy rate decreased 10 basis points from 5.5% to 5.4% over the quarter. At the end of the third quarter, Houston had 28.5M SF of vacant industrial space for direct lease and an additional 1.3M SF of vacant sublease space. Among the major industrial corridors, the Northeast Corridor has the lowest vacancy rate at 2.2%, followed by the South at 3.3%, and then the Inner Loop at 4.6%. The largest percentage of vacant space is located in the North Corridor which has an 8.5% vacancy rate. Currently 5.3M SF of industrial space is under construction in Houston, and 30.7% is pre-leased. Only 1.0% of the 3.7M SF of spec space under construction is pre-leased at this time. The largest project under construction is a 673,785- SF spec distribution warehouse located in the Northwest Outliers submarket. A partial list of buildings currently under construction can be found on page 3 of this report. Absorption & Demand Houston’s industrial market posted 3.1M SF of positive net absorption in the third quarter, bringing the year-to-date total to 6.2M SF. Some of the tenants contributing to the positive absorption include Amazon which is moving into its new 855,000 SF fulfillment center in the North Fwy/Tomball Pky submarket, and FedEx, which is opening its new 800,000 SF distribution warehouse in the Northwest Outliers submarket. The North and Northwest Corridors saw the largest positive net absorption during the third quarter, posting 1.3M SF and 1.2M SF, respectively. Rental Rates According to CoStar, our data service provider, Houston’s citywide average quoted industrial rental rate for all product types decreased marginally over the quarter from $6.98 to $6.90 per SF NNN. According to Colliers’ internal data, actual lease transactions are in the $4.56 – $5.04 per SF NNN range for newer bulk industrial spaces, while flex rates range from $7.20 to $10.80 per SF depending on the existing improvements or the allowance provided for tenant improvements and the location of the property. According to CoStar, the average quoted NNN rental rates by property type are as follows: $6.55 per SF for Warehouse Distribution space; $10.08 per SF for Flex/Service space; with Tech/R&D space averaging $10.95 per SF. 4.0% 4.5% 5.0% 5.5% 6.0% 6.5% $4.00 $5.00 $6.00 $7.00 $8.00 Industrial Rental Rate and Vacancy Percentage Houston, TX Avg Quoted Rent Avg Vacancy *Vacancy percentage includes direct and sublease space.
  • 3. 3 Houston Research & Forecast Report | Q3 2017 | Industrial | Colliers International33 Q3 2017 Industrial Lease Transactions over 50,000 SF BUILDING NAME/ADDRESS SUBMARKET SF TENANT LEASE DATE Pinto Business Park North 600,000 Emser Tile2 Aug-17 Prologis Park Jersey Village Northwest 300,000 Home Depot3 Sept-17 Bayport North Distribution Center II Southeast 225,000 Supply Chain Management1,3 Jul-17 Point North Cargo Park Northeast 181,540 Starplast3 Sept-17 Central Green Corporate Center North 128,924 DHL3 Sept-17 Satsuma Distribution Center 1 Northwest 99,840 Mahindra USA Inc.1,3 Aug-17 Leasing Activity Houston’s industrial leasing activity decreased 39.6% over the quarter from 6.8M SF in Q2 2017 to 4.1M SF in Q3 2017. Most of the transactions consisted of smaller renewals, but there were several new/direct deals that occurred. The table below highlights some of the larger transactions that closed in Q3 2017. 1 Colliers International Transaction 2 Pre-lease in a proposed/under construction building 3 Direct/New Under Construction Q3 2017 Industrial Under Construction - 200,000 SF or greater BUSINESS PARK/ADDRESS SUBMARKET RBA % LEASED DEVELOPER/CONTRACTOR DELIVERY DATE BUILDING DESCRIPTION 525 Cane Island Pky Northwest Outlier 673,785 0% Oakmont Industrial Group Jul-18 Spec Distribution Fallbrook Dr North Fwy/Tomball Pky 600,000 100% Hines Jun-18 BTS Emser Tile Cedar Port Distribution Park East-Southeast Far 500,000 100% Avera Companies Sep-18 BTS Vinmar International *4838 Borusan Rd East-Southeast Far 501,020 0% Clay Development Aug-18 Spec Warehouse Northwest Logistics Center West Outer Loop 411,442 0% Stream Realty Partners, L.P. Jun-18 Spec Distribution Cutten Distribution Center I North Fwy/Tomball Pky 293,280 0% Clay Development Jan-18 Spec Distribution Bayport South Business Park 10535 Red Bluff Rd East-Southeast Far 257,835 0% Johnson Development Feb-18 Spec Distribution Energy Commerce Bldg D East-Southeast Far 232,960 0% Clay Development Feb-18 Spec Distribution 22533 NW Lake Dr Northwest Outlier 231,839 0% The Carson Companies Mar-18 Spec Warehouse 5121 AmeriPort Pky Bldg VII East-Southeast Far 203,840 100% National Property Holdings Apr-18 Palmer Logistics *In permitting process
  • 4. 4 Houston Research & Forecast Report | Q3 2017 | Industrial | Colliers International Q3 2017 Houston Industrial Market Statistical Summary MARKET RENTABLE AREA DIRECT VACANT SF DIRECT VACANCY RATE SUBLET VACANT SF SUBLET VACANCY RATE TOTAL VACANT SF TOTAL VACANCY RATE 3Q17 NET ABSORP- TION 2Q17 NET ABSORP- TION 3Q17 COMPLE- TIONS 2Q17 COMPLE- TIONS SF UNDER CONSTRUC- TION Houston Total 547,370,838 28,495,596 5.2% 1,326,106 0.2% 29,821,702 5.4% 3,035,998 (53,222) 2,542,549 1,442,223 5,291,835 CBD-NW Inner Loop 11,590,397 554,493 4.8% 57,205 0.5% 611,698 5.3% (18,707) (189,169) - - 14,250 Downtown 31,411,129 1,510,562 4.8% - 0.0% 1,510,562 4.8% 241,178 (12,626) - - - North Inner Loop 4,858,519 300,057 6.2% - 0.0% 300,057 6.2% (76,388) (17,964) - - - Southwest Inner Loop 7,097,563 78,940 1.1% - 0.0% 78,940 1.1% (17,499) (28,840) - - - INNER LOOP CORRIDOR TOTAL 54,957,608 2,444,052 4.4% 57,205 0.1% 2,501,257 4.6% 128,584 (248,599) - - 14,250 North Fwy/Tomball Pky 23,738,871 2,428,073 10.2% 53,006 0.2% 2,481,079 10.5% 979,380 169,425 865,800 51,146 913,280 North Hardy Toll Rd 33,565,799 3,110,551 9.3% 270,670 0.8% 3,381,221 10.1% 323,516 (7,912) 10,500 - 93,250 North Outer Loop 20,308,494 995,758 4.9% 48,411 0.2% 1,044,169 5.1% 89,746 (96,798) - 35,000 - The Woodlands/ Conroe 17,247,084 1,063,878 6.2% 55,566 0.3% 1,119,444 6.5% (75,164) (33,377) - 44,250 78,625 NORTH CORRIDOR TOTAL 94,860,248 7,598,260 8.0% 427,653 0.5% 8,025,913 8.5% 1,317,478 31,338 876,300 130,396 1,085,155 Northeast Hwy 321 1,298,073 37,700 2.9% - 0.0% 37,700 2.9% - - - - - Northeast Hwy 90 18,010,800 264,467 1.5% - 0.0% 264,467 1.5% 28,239 15,230 - - 164,500 Northeast I-10 3,853,356 64,325 1.7% - 0.0% 64,325 1.7% 15,496 (15,872) - - - Northeast Inner Loop 11,559,550 411,640 3.6% - 0.0% 411,640 3.6% (17,461) (36,532) - - - NORTHEAST CORRIDOR TOTAL 34,721,779 778,132 2.2% - 0.0% 778,132 2.2% 26,274 (37,174) - - 164,500 Hwy 290/Tomball Pky 21,172,066 996,867 4.7% 245,319 1.2% 1,242,186 5.9% 628,322 244,891 - - 30,300 Northwest Hwy 6 9,571,803 453,764 4.7% - 0.0% 453,764 4.7% 38,809 (202,594) - 10,000 172,885 Northwest Inner Loop 59,999,793 2,795,685 4.7% 130,183 0.2% 2,925,868 4.9% (322,315) (238,097) - - 19,000 Northwest Near 17,909,297 618,054 3.5% 11,479 0.1% 629,533 3.5% (89,229) 174,739 - - 154,661 Northwest Outlier 21,826,504 1,129,981 5.2% 24,205 0.1% 1,154,186 5.3% 1,150,770 333,669 983,750 103,040 1,035,319 West Outer Loop 25,483,643 1,471,159 5.8% 199,538 0.8% 1,670,697 6.6% (242,093) (270,196) - 17,000 496,542 NORTHWEST CORRIDOR TOTAL 155,963,106 7,465,510 4.8% 610,724 0.4% 8,076,234 5.2% 1,164,264 42,412 983,750 130,040 1,908,707 South Highway 35 34,238,534 980,735 2.9% - 0.0% 980,735 2.9% 8,379 (11,592) 41,520 - 97,593 South Inner Loop 12,368,001 553,399 4.5% 8,167 0.1% 561,566 4.5% 9,833 (116,952) - - - SOUTH CORRIDOR TOTAL 46,606,535 1,534,134 3.3% 8,167 0.0% 1,542,301 3.3% 18,212 (128,544) 41,520 - 97,593 East I-10 Outer Loop 12,923,577 88,866 0.7% - 0.0% 88,866 0.7% - (12,166) - - - East-Southeast Far 60,285,414 3,817,886 6.3% 36,550 0.1% 3,854,436 6.4% 574,303 215,886 428,479 1,128,287 1,921,508 Southeast Outer Loop 17,186,203 438,533 2.6% 15,000 0.1% 453,533 2.6% 93,176 (30,600) - - - SOUTHEAST CORRIDOR TOTAL 90,395,194 4,345,285 4.8% 51,550 0.1% 4,396,835 4.9% 667,479 173,120 428,479 1,128,287 1,921,508 Highway 59/Highway 90 22,606,039 1,566,381 6.9% 155,464 0.7% 1,721,845 7.6% (120,592) 60,931 - - - Southwest Far 12,660,888 1,150,880 9.1% 1,000 0.0% 1,151,880 9.1% 229,457 70,675 212,500 10,500 81,372 Southwest Outer Loop 13,340,177 781,420 5.9% 6,000 0.0% 787,420 5.9% (179,168) (33,343) - - - Sugar Land/Ft Bend Co 21,259,264 831,542 3.9% 8,343 0.0% 839,885 4.0% (215,990) 15,962 - 43,000 18,750 SOUTHWEST CORRIDOR TOTAL 69,866,368 4,330,223 6.2% 170,807 0.2% 4,501,030 6.4% (286,293) 114,225 212,500 53,500 100,122 Market Summary
  • 5. 5 North American Research & Forecast Report | Q4 2014 | Office Market Outlook | Colliers International Copyright © 2015 Colliers International. The information contained herein has been obtained from sources deemed reliable. While every reasonable effort has been made to ensure its accuracy, we cannot guarantee it. No responsibility is assumed for any inaccuracies. Readers are encouraged to consult their professional advisors prior to acting on any of the material contained in this report. Colliers International | Market 000 Address, Suite # 000 Address, Suite # +1 000 000 0000 colliers.com/<<market>> 5 North American Research & Forecast Report | Q4 2014 | Office Market Outlook | Colliers International Copyright © 2017 Colliers International. The information contained herein has been obtained from sources deemed reliable. While every reasonable effort has been made to ensure its accuracy, we cannot guarantee it. No responsibility is assumed for any inaccuracies. Readers are encouraged to consult their professional advisors prior to acting on any of the material contained in this report. Colliers International | Houston 1233 West Loop South, Suite 900 Houston, Texas 77027 +1 713 222 2111 colliers.com/texas/houston FOR MORE INFORMATION Lisa Bridges Director of Market Research | Houston +1 713 830 2125 lisa.bridges@colliers.com Q3 Houston Industrial 2017 Highlights Photo source: porthouston.com