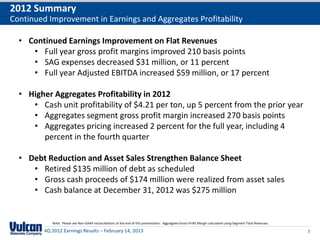
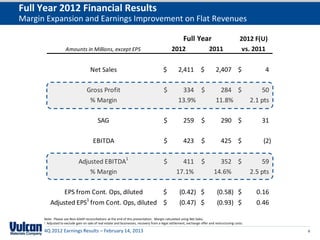
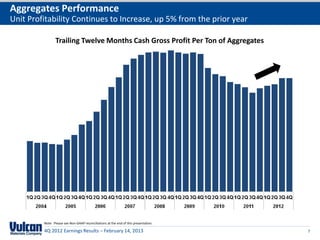
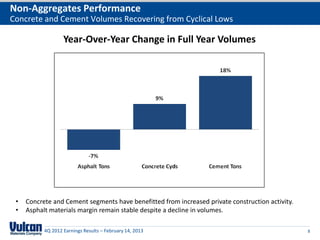
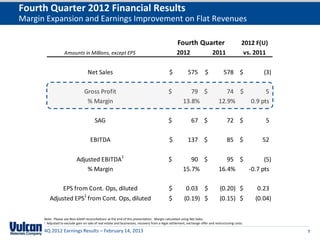
- Vulcan Materials reported earnings for 2012 with continued improvement in earnings and aggregates profitability despite flat revenues.
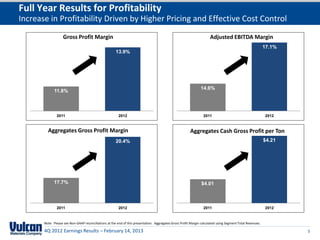
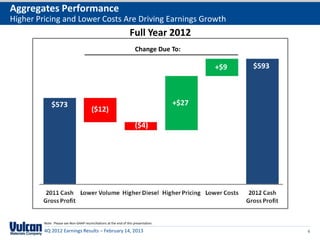
- Gross profit margins increased 210 basis points for the full year, driven by higher aggregates pricing of 2% and effective cost control.
- Adjusted EBITDA increased $59 million or 17% for the full year through margin expansion and aggregates profitability gains.
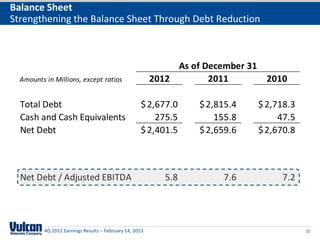
- The company strengthened its balance sheet through $135 million in debt reduction and $174 million in asset sales proceeds.