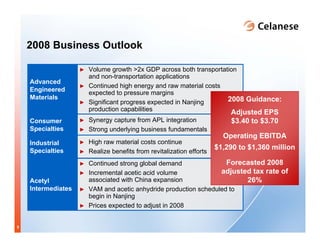
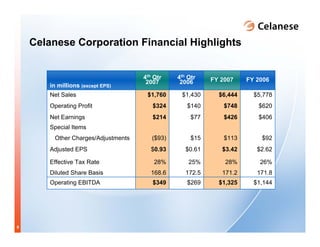
The document summarizes Celanese Corporation's 4Q 2007 earnings conference call. It includes highlights such as a 23% increase in 4Q net sales and a 52% increase in adjusted EPS compared to the same period last year. Celanese also provides guidance for 2008, forecasting adjusted EPS between $3.40-$3.70 and operating EBITDA of $1,290-$1,360 million. Segment results and details on continued strong cash generation are also presented. Key executives Dave Weidman and Steven Sterin will discuss 4Q performance and business outlook further on the earnings call.
The document summarizes Celanese's 4Q 2008 earnings conference call. It discusses Celanese's 4Q 2008 financial results including a net loss of $152 million compared to an operating profit in 4Q 2007, and an adjusted EPS of ($0.38) compared to $2.77 in 4Q 2007. It also provides highlights for each of Celanese's business segments and discusses the outlook for 2009 including expected continued volume declines.
The document summarizes Celanese Corporation's 1Q 2009 earnings conference call. It provides an overview of the participants in the call and includes forward-looking statements and information on non-GAAP measures. The financial highlights show a year-over-year decline in net sales, operating profit, and adjusted EPS due to lower volumes and pricing pressure. Segment results are also down across most businesses compared to prior year. However, the company maintained a strong cash position and generated positive adjusted free cash flow for the quarter.
Celanese will hold a conference call on February 6, 2007 at 10:00 am CT to discuss its 4th quarter 2006 earnings. The call will feature presentations from Dave Weidman, President and CEO, and John J. Gallagher III, Executive Vice President and CFO. The document provides an overview of Celanese's 4th quarter and full year 2006 financial highlights including net sales, operating profit, adjusted EPS, operating EBITDA, and free cash flow. It also outlines Celanese's objectives to grow operating EBITDA to $300-350 million by 2010 through business revitalization, innovation, organic growth in Asia, and a focus on operational excellence.
public serviceenterprise group 3Q 2007 slides3finance20
The document provides details on PSEG's third quarter 2007 earnings conference call, highlighting that operating earnings exceeded expectations. It summarizes financial results for various subsidiaries including PSE&G and PSEG Power. Additionally, it discusses PSEG Power's strong operating performance at its nuclear plants and benefits seen from PJM's capacity auction pricing model.
Celanese will hold a conference call on April 22, 2008 at 10:00 am ET to discuss its first quarter 2008 earnings. The call will feature Dave Weidman, Chairman and CEO, and Steven Sterin, Senior Vice President and CFO. The document provides forward-looking statements and non-GAAP financial measures to supplement GAAP reporting. It summarizes Celanese's financial highlights for Q1 2008, including revenue increases across most business segments and higher adjusted EPS compared to Q1 2007. Celanese affirms its 2008 guidance for adjusted EPS and operating EBITDA.
The document summarizes Celanese's 2Q 2008 earnings conference call. It includes an agenda with the Chairman and CEO and SVP and CFO scheduled to speak. It also provides forward-looking statements, non-GAAP financial measure definitions, and notes the results are unaudited. Key highlights are record net sales for the quarter driven by higher pricing and volumes in Asia, but lower operating profit and EPS due to higher raw material costs, and a plan to achieve growth objectives by 2010 through volume growth in advanced materials and consumer/industrial specialties.
The document summarizes Celanese Corporation's 3Q 2008 earnings conference call and webcast scheduled for October 21, 2008. It includes an agenda with the Chairman and CEO and SVP and CFO slated to speak. The document also provides forward-looking statements, non-GAAP reconciliations, and highlights of Celanese's 3Q 2008 financial results including net sales, operating profit, adjusted EPS, and operating EBITDA by business segment. Celanese's affiliates continued to deliver value through dividends in 3Q 2008.
Celanese will hold a conference call on October 31, 2006 to discuss its third quarter 2006 earnings. The call will include presentations from Dave Weidman, President and CEO, and John J. Gallagher III, Executive Vice President and CFO. They will discuss Celanese's financial results for the third quarter, business segment highlights, capitalization, guidance for full year 2006, and reconciliation of certain non-GAAP financial measures used by management.
public serviceenterprise group 4Q_2007_Webcast_Slides_FINALfinance20
This document summarizes a conference call by PSEG (Public Service Enterprise Group) discussing their fourth quarter and full year 2007 earnings. Some key points:
- For Q4 2007, PSEG reported operating earnings of $277 million compared to $136 million in Q4 2006. Full year 2007 operating earnings were $1.377 billion compared to $872 million in 2006.
- PSEG provided 2008 guidance of $5.60-$6.10 in operating earnings per share, representing 8% growth over 2007 results.
- 2007 results were at the top end of prior guidance. Focus was on core businesses like nuclear power generation and transmission investment. Debt was reduced and the dividend was increased 10%.
public serviceenterprise group 2Q2007Slidesfinance20
This document provides an earnings conference call transcript for Public Service Enterprise Group (PSEG) for the second quarter of 2007. Some key details include:
- Operating earnings per share for Q2 2007 were $1.15, up from $0.68 in Q2 2006. Year-to-date operating earnings per share were $2.47, up from $1.52.
- PSEG Power saw improved earnings from higher energy and capacity prices. PSE&G's performance improved due to rate relief and normal weather. Holdings earnings declined due to lower spark spreads in Texas and an extended outage in Italy.
- Results are on track to meet full-year earnings guidance and commitments around system
The document summarizes Celanese Corporation's 1Q 2006 earnings conference call and webcast scheduled for May 9, 2006. It includes an agenda with the CEO and CFO slated to speak. Financial highlights are provided for Celanese's 1Q 2006 results including net sales growth of 12% and diluted adjusted EPS growth of 16% year-over-year. Guidance for full year 2006 adjusted EPS is given in the range of $2.50 to $2.90 per share. Various non-GAAP financial measures are reconciled to the most comparable GAAP measures.
The document provides an overview of AES Corporation's financial results for the first quarter of 2008. Some key points:
- Revenue increased 13% to $4.1 billion driven by higher prices and volumes in Latin America and Europe. Gross margin rose 17% to $849 million.
- Income before taxes grew 27% to $628 million. Diluted EPS from continuing operations was $0.34 compared to $0.17 in the prior year.
- Operating cash flow was flat at $471 million due to increased working capital from higher revenues. Free cash flow also remained flat at $292 million.
- Segment highlights showed revenue and profit increases across most regions, particularly in Latin America generation due
public serviceenterprise group european_tripfinance20
1) Public Service Enterprise Group (PSEG) is holding a European marketing trip from February 25-29, 2008 to promote its business.
2) PSEG provides forward-looking statements about its performance, which are subject to various risks and uncertainties that could cause actual results to differ.
3) PSEG presents non-GAAP operating earnings in addition to GAAP net income to exclude certain one-time items in order to provide a consistent performance measure.
Celanese held an Investor Day on December 13, 2006 in New York City. Celanese is a leading global chemical company with estimated 2006 revenue of $6.7 billion and operating EBITDA of $1.2 billion. Between 2000-2006, Celanese focused on strengthening its portfolio by investing in specialty businesses and divesting non-core assets. Celanese aims to continue growing earnings between 2007-2010 by expanding in Asia, growing downstream specialties, and organizational alignment to address growth opportunities.
This document discusses Celanese Corporation's performance in 2008 and strategies going forward. It contains the following key points:
1. Celanese reported strong financial results for the third quarter and year-to-date 2008, despite challenging market conditions.
2. The company has executed a strategy focused on specialty businesses and divesting non-core assets to create a more resilient portfolio.
3. Going forward, Celanese aims to accelerate growth in specialty businesses like Consumer Specialties and leverage its integrated operations and global positions.
Celanese held a conference call to discuss its fourth quarter 2005 earnings. Key highlights included strong underlying business results driven by higher pricing and demand. The company also provided an outlook for 2006, forecasting adjusted EPS between $2.50-$2.90. Significant contributions continue to come from equity and cost investments, which paid $154 million in dividends for full-year 2005, up from $77 million in 2004. Capitalization was also discussed, with net debt of $3.047 billion as of December 31, 2005.
El Paso Corporation reported strong second quarter earnings, with Exploration and Production ahead of target. The company's pipeline group also performed well above the second quarter of last year, supported by increased throughput. El Paso continues to advance its portfolio of committed growth projects across its pipeline network. Overall, the company is on track to achieve its financial and operational targets for 2007.
The document summarizes Celanese's 4Q 2008 earnings conference call. It discusses Celanese's 4Q 2008 financial results including a net loss of $152 million compared to an operating profit in 4Q 2007, and an adjusted EPS of ($0.38) compared to $2.77 in 4Q 2007. It also provides highlights for each of Celanese's business segments and discusses the outlook for 2009 including expected continued volume declines.
The document summarizes Celanese Corporation's 1Q 2008 earnings conference call. It includes details on the speakers, forward-looking statements, non-GAAP reconciliations, and 1Q 2008 financial highlights for each business segment. Celanese reports higher sales driven by price increases and currency effects, though margins were pressured by rising input costs. Affiliate earnings and dividends increased. Celanese affirms 2008 guidance for adjusted EPS of $3.60-$3.85 and operating EBITDA of $1.355-$1.415 billion.
The document summarizes Celanese Corporation's second quarter 2008 earnings conference call. It provides an overview of the participants in the call, including the Chairman and CEO and Senior Vice President and CFO. Key highlights from the second quarter include record sales driven by higher pricing and growth in Asia, though operating profit declined due to higher raw material costs. The document reviews financial results and performance across Celanese's business segments and discusses continued strong cash generation and the company's outlook for 2008.
The document summarizes Celanese's 2Q 2008 earnings conference call. It includes an agenda with the Chairman and CEO and SVP and CFO scheduled to speak. It also provides forward-looking statements, non-GAAP reconciliations, and describes results as unaudited. Key highlights are record net sales for the quarter driven by higher pricing and volumes in Asia, though operating profit and EPS declined from significantly higher raw material costs. The company also reaffirms its path to achieving operating EBITDA growth objectives by 2010 through volume growth in advanced materials and further acetate tow penetration.
The document summarizes Celanese Corporation's 3Q 2008 earnings conference call. It provides an overview of the company's performance including a 16% increase in net sales driven by higher pricing and volumes. Operating profit increased to $151 million though margins were compressed by higher raw material costs. Adjusted EPS increased 7% to $0.78 per share. All business segments saw sales growth with Advanced Engineered Materials and Industrial Specialties impacted by weaker automotive and industrial end markets respectively. Affiliates continued to deliver value with $54 million in earnings. Strong cash generation resulted in $195 million in adjusted free cash flow.
The document summarizes Celanese Corporation's third quarter 2007 earnings conference call that was scheduled for October 23, 2007 at 10:00 am ET. It would be led by Dave Weidman, Chairman and CEO, and Steven Sterin, Senior Vice President and CFO. The document provides an overview of Celanese's business segments and key financial highlights for the third quarter of 2007, including adjusted EPS of $0.73, a 7% increase in net sales, and operating EBITDA of $302 million. It also reviews the company's outlook and growth strategies for 2007.
This document provides details on Celanese Corporation's second quarter 2007 earnings conference call, including details on the call participants, forward-looking statements, and reconciliation of non-GAAP measures. It also summarizes key financial highlights and performance details for Celanese's business segments, including increased sales and operating EBITDA compared to the prior year. Equity investments also continued to deliver increased income and cash flow.
public serviceenterprise group 3Q2007slides3finance20
The document provides details on PSEG's third quarter 2007 earnings conference call, highlighting that operating earnings exceeded expectations. It summarizes financial results for various subsidiaries including PSE&G and PSEG Power. Additionally, it discusses PSEG Power's strong operating performance at its nuclear plants and benefits seen from PJM's capacity auction pricing model.
public serviceenterprise group 4Q_2007_Webcast_Slides_FINALfinance20
Public Service Enterprise Group (PSEG) held an earnings conference call to discuss its fourth quarter and full year 2007 results. PSEG reported operating earnings of $277 million for Q4 2007 compared to $136 million for Q4 2006. For the full year, operating earnings were $1.377 billion compared to $872 million in 2006. PSEG's strong results were driven by improved performance at its power generation subsidiary PSEG Power due to favorable market conditions and asset sales. Looking ahead, PSEG expects continued earnings growth of 8% in 2008.
public serviceenterprise group 1Q2007Slidesfinance20
This document provides a summary of PSEG's earnings conference call for the first quarter of 2007. Key highlights include:
1) PSEG reported operating earnings of $335 million or $1.32 per share for Q1 2007, an increase from $213 million or $0.85 per share in Q1 2006.
2) PSEG Power delivered strong results driven by the roll-off of below-market contracts and sustained top quartile nuclear performance.
3) PSE&G saw improved earnings from rate relief received in Q4 2006 and more normal weather compared to unusually warm conditions in 2006.
4) Cash flow and liquidity remain strong, allowing PSEG to reduce parent debt
public serviceenterprise group 1Q 2007 Slidesfinance20
This document provides a summary of PSEG's earnings conference call for the first quarter of 2007. Key highlights include:
1) PSEG reported operating earnings of $335 million or $1.32 per share for Q1 2007, an increase from $213 million or $0.85 per share in Q1 2006.
2) PSEG Power delivered strong results driven by the roll-off of below-market contracts and sustained top quartile nuclear performance.
3) PSE&G saw earnings growth from rate relief received in late 2006 and more normal weather compared to unusually warm conditions in 2006.
4) Cash flow and liquidity remain strong, allowing PSEG to reduce parent debt levels
- HP reported Q4 FY08 revenue of $33.6 billion, up 19% year-over-year. Non-GAAP diluted EPS was $1.03, up 20% from $0.86 in Q4 FY07.
- For FY08, revenue was $118.4 billion, up 13% year-over-year. Non-GAAP diluted EPS was $3.62, up 24% from $2.93 in FY07.
- Revenue growth was driven by strong performance in the Americas and EMEA regions. The Personal Systems Group saw revenue of $11.2 billion, up 10% year-over-year.
This document provides details on Celanese Corporation's second quarter 2006 earnings conference call, including an agenda with the CEO and CFO as speakers. It also provides financial highlights for Q2 2006 such as an 11% increase in net sales and an 18% rise in operating EBITDA. Celanese issues guidance for full year 2006 of adjusted EPS between $2.50-$2.80.
public serviceenterprise group 4Q_2007_Webcast_Slides_FINALfinance20
This document summarizes a conference call by PSEG (Public Service Enterprise Group) discussing their fourth quarter and full year 2007 earnings. Some key points:
- For Q4 2007, PSEG reported operating earnings of $277 million compared to $136 million in Q4 2006. Full year 2007 operating earnings were $1.377 billion compared to $872 million in 2006.
- PSEG provided 2008 guidance of $5.60-$6.10 in operating earnings per share, representing 8% growth over 2007 results.
- 2007 results were at the top end of prior guidance. Focus was on core businesses like nuclear power generation and transmission investment. Debt was reduced and the dividend was increased 10%.
public serviceenterprise group 2Q2007Slidesfinance20
This document provides an earnings conference call transcript for Public Service Enterprise Group (PSEG) for the second quarter of 2007. Some key details include:
- Operating earnings per share for Q2 2007 were $1.15, up from $0.68 in Q2 2006. Year-to-date operating earnings per share were $2.47, up from $1.52.
- PSEG Power saw improved earnings from higher energy and capacity prices. PSE&G's performance improved due to rate relief and normal weather. Holdings earnings declined due to lower spark spreads in Texas and an extended outage in Italy.
- Results are on track to meet full-year earnings guidance and commitments around system
The document summarizes Celanese Corporation's 1Q 2006 earnings conference call and webcast scheduled for May 9, 2006. It includes an agenda with the CEO and CFO slated to speak. Financial highlights are provided for Celanese's 1Q 2006 results including net sales growth of 12% and diluted adjusted EPS growth of 16% year-over-year. Guidance for full year 2006 adjusted EPS is given in the range of $2.50 to $2.90 per share. Various non-GAAP financial measures are reconciled to the most comparable GAAP measures.
The document provides an overview of AES Corporation's financial results for the first quarter of 2008. Some key points:
- Revenue increased 13% to $4.1 billion driven by higher prices and volumes in Latin America and Europe. Gross margin rose 17% to $849 million.
- Income before taxes grew 27% to $628 million. Diluted EPS from continuing operations was $0.34 compared to $0.17 in the prior year.
- Operating cash flow was flat at $471 million due to increased working capital from higher revenues. Free cash flow also remained flat at $292 million.
- Segment highlights showed revenue and profit increases across most regions, particularly in Latin America generation due
public serviceenterprise group european_tripfinance20
1) Public Service Enterprise Group (PSEG) is holding a European marketing trip from February 25-29, 2008 to promote its business.
2) PSEG provides forward-looking statements about its performance, which are subject to various risks and uncertainties that could cause actual results to differ.
3) PSEG presents non-GAAP operating earnings in addition to GAAP net income to exclude certain one-time items in order to provide a consistent performance measure.
Celanese held an Investor Day on December 13, 2006 in New York City. Celanese is a leading global chemical company with estimated 2006 revenue of $6.7 billion and operating EBITDA of $1.2 billion. Between 2000-2006, Celanese focused on strengthening its portfolio by investing in specialty businesses and divesting non-core assets. Celanese aims to continue growing earnings between 2007-2010 by expanding in Asia, growing downstream specialties, and organizational alignment to address growth opportunities.
This document discusses Celanese Corporation's performance in 2008 and strategies going forward. It contains the following key points:
1. Celanese reported strong financial results for the third quarter and year-to-date 2008, despite challenging market conditions.
2. The company has executed a strategy focused on specialty businesses and divesting non-core assets to create a more resilient portfolio.
3. Going forward, Celanese aims to accelerate growth in specialty businesses like Consumer Specialties and leverage its integrated operations and global positions.
Celanese held a conference call to discuss its fourth quarter 2005 earnings. Key highlights included strong underlying business results driven by higher pricing and demand. The company also provided an outlook for 2006, forecasting adjusted EPS between $2.50-$2.90. Significant contributions continue to come from equity and cost investments, which paid $154 million in dividends for full-year 2005, up from $77 million in 2004. Capitalization was also discussed, with net debt of $3.047 billion as of December 31, 2005.
El Paso Corporation reported strong second quarter earnings, with Exploration and Production ahead of target. The company's pipeline group also performed well above the second quarter of last year, supported by increased throughput. El Paso continues to advance its portfolio of committed growth projects across its pipeline network. Overall, the company is on track to achieve its financial and operational targets for 2007.
The document summarizes Celanese's 4Q 2008 earnings conference call. It discusses Celanese's 4Q 2008 financial results including a net loss of $152 million compared to an operating profit in 4Q 2007, and an adjusted EPS of ($0.38) compared to $2.77 in 4Q 2007. It also provides highlights for each of Celanese's business segments and discusses the outlook for 2009 including expected continued volume declines.
The document summarizes Celanese Corporation's 1Q 2008 earnings conference call. It includes details on the speakers, forward-looking statements, non-GAAP reconciliations, and 1Q 2008 financial highlights for each business segment. Celanese reports higher sales driven by price increases and currency effects, though margins were pressured by rising input costs. Affiliate earnings and dividends increased. Celanese affirms 2008 guidance for adjusted EPS of $3.60-$3.85 and operating EBITDA of $1.355-$1.415 billion.
The document summarizes Celanese Corporation's second quarter 2008 earnings conference call. It provides an overview of the participants in the call, including the Chairman and CEO and Senior Vice President and CFO. Key highlights from the second quarter include record sales driven by higher pricing and growth in Asia, though operating profit declined due to higher raw material costs. The document reviews financial results and performance across Celanese's business segments and discusses continued strong cash generation and the company's outlook for 2008.
The document summarizes Celanese's 2Q 2008 earnings conference call. It includes an agenda with the Chairman and CEO and SVP and CFO scheduled to speak. It also provides forward-looking statements, non-GAAP reconciliations, and describes results as unaudited. Key highlights are record net sales for the quarter driven by higher pricing and volumes in Asia, though operating profit and EPS declined from significantly higher raw material costs. The company also reaffirms its path to achieving operating EBITDA growth objectives by 2010 through volume growth in advanced materials and further acetate tow penetration.
The document summarizes Celanese Corporation's 3Q 2008 earnings conference call. It provides an overview of the company's performance including a 16% increase in net sales driven by higher pricing and volumes. Operating profit increased to $151 million though margins were compressed by higher raw material costs. Adjusted EPS increased 7% to $0.78 per share. All business segments saw sales growth with Advanced Engineered Materials and Industrial Specialties impacted by weaker automotive and industrial end markets respectively. Affiliates continued to deliver value with $54 million in earnings. Strong cash generation resulted in $195 million in adjusted free cash flow.
The document summarizes Celanese Corporation's third quarter 2007 earnings conference call that was scheduled for October 23, 2007 at 10:00 am ET. It would be led by Dave Weidman, Chairman and CEO, and Steven Sterin, Senior Vice President and CFO. The document provides an overview of Celanese's business segments and key financial highlights for the third quarter of 2007, including adjusted EPS of $0.73, a 7% increase in net sales, and operating EBITDA of $302 million. It also reviews the company's outlook and growth strategies for 2007.
This document provides details on Celanese Corporation's second quarter 2007 earnings conference call, including details on the call participants, forward-looking statements, and reconciliation of non-GAAP measures. It also summarizes key financial highlights and performance details for Celanese's business segments, including increased sales and operating EBITDA compared to the prior year. Equity investments also continued to deliver increased income and cash flow.
public serviceenterprise group 3Q2007slides3finance20
The document provides details on PSEG's third quarter 2007 earnings conference call, highlighting that operating earnings exceeded expectations. It summarizes financial results for various subsidiaries including PSE&G and PSEG Power. Additionally, it discusses PSEG Power's strong operating performance at its nuclear plants and benefits seen from PJM's capacity auction pricing model.
public serviceenterprise group 4Q_2007_Webcast_Slides_FINALfinance20
Public Service Enterprise Group (PSEG) held an earnings conference call to discuss its fourth quarter and full year 2007 results. PSEG reported operating earnings of $277 million for Q4 2007 compared to $136 million for Q4 2006. For the full year, operating earnings were $1.377 billion compared to $872 million in 2006. PSEG's strong results were driven by improved performance at its power generation subsidiary PSEG Power due to favorable market conditions and asset sales. Looking ahead, PSEG expects continued earnings growth of 8% in 2008.
public serviceenterprise group 1Q2007Slidesfinance20
This document provides a summary of PSEG's earnings conference call for the first quarter of 2007. Key highlights include:
1) PSEG reported operating earnings of $335 million or $1.32 per share for Q1 2007, an increase from $213 million or $0.85 per share in Q1 2006.
2) PSEG Power delivered strong results driven by the roll-off of below-market contracts and sustained top quartile nuclear performance.
3) PSE&G saw improved earnings from rate relief received in Q4 2006 and more normal weather compared to unusually warm conditions in 2006.
4) Cash flow and liquidity remain strong, allowing PSEG to reduce parent debt
public serviceenterprise group 1Q 2007 Slidesfinance20
This document provides a summary of PSEG's earnings conference call for the first quarter of 2007. Key highlights include:
1) PSEG reported operating earnings of $335 million or $1.32 per share for Q1 2007, an increase from $213 million or $0.85 per share in Q1 2006.
2) PSEG Power delivered strong results driven by the roll-off of below-market contracts and sustained top quartile nuclear performance.
3) PSE&G saw earnings growth from rate relief received in late 2006 and more normal weather compared to unusually warm conditions in 2006.
4) Cash flow and liquidity remain strong, allowing PSEG to reduce parent debt levels
- HP reported Q4 FY08 revenue of $33.6 billion, up 19% year-over-year. Non-GAAP diluted EPS was $1.03, up 20% from $0.86 in Q4 FY07.
- For FY08, revenue was $118.4 billion, up 13% year-over-year. Non-GAAP diluted EPS was $3.62, up 24% from $2.93 in FY07.
- Revenue growth was driven by strong performance in the Americas and EMEA regions. The Personal Systems Group saw revenue of $11.2 billion, up 10% year-over-year.
This document provides details on Celanese Corporation's second quarter 2006 earnings conference call, including an agenda with the CEO and CFO as speakers. It also provides financial highlights for Q2 2006 such as an 11% increase in net sales and an 18% rise in operating EBITDA. Celanese issues guidance for full year 2006 of adjusted EPS between $2.50-$2.80.
This annual report summarizes the company's financial highlights and provides an overview of its commitments and investments over the past year. It discusses achieving operational excellence, pursuing safety, and investing in capital projects, business optimization, and asset management to generate strong returns. The CEO highlights strong financial results in 2007, including earnings per share of $7.72, total shareholder return of over 37%, and $6 billion returned to shareholders through dividends and share repurchases.
cardinal health Q1 2007 Earnings Presentationfinance2
This document summarizes Cardinal Health's first quarter earnings for fiscal year 2007. It provides an overview of Cardinal Health's consolidated and segment financial results for the quarter, including revenue, operating earnings, earnings per share, and other key metrics. It notes growth over the prior year quarter for most measures. The document also outlines Cardinal Health's key value drivers and financial targets for fiscal year 2007, including targets for revenue growth, earnings per share, return on equity, and cash returned to shareholders.
The document summarizes the agenda and presentations for Celanese Corporation's 2007 Investor Day. The agenda included presentations on Celanese's business segments and strategies for growth, operational excellence, and value creation. Celanese aimed to pursue premier performance and deliver superior value creation through industry-leading growth and a geographically balanced global position across diversified end markets.
This document is the 2007 annual report for ConAgra Foods Inc. It summarizes the company's financial highlights for fiscal year 2007, including a 5% increase in net sales to $12.028 billion and growth in operating profit, income from continuing operations, and net income compared to the previous fiscal year. It discusses the company's strategic priorities or "Must Do's" of rewiring processes to be more efficient, attacking costs to fuel growth, optimizing its product portfolio, innovating new products, exceeding customer expectations, and nurturing employees. The report provides examples of progress made in each area in fiscal 2007, such as selling non-core businesses, implementing new manufacturing and logistics systems, focusing marketing investments on priority
Public Service Enterprise Group (PSEG) held a financial conference to discuss its performance and outlook. PSEG operates power generation, transmission and distribution businesses. It provided guidance for 2007 operating earnings of $1.305-1.41 billion and EPS of $5.15-5.45. PSEG aims to achieve growth through operational excellence, financial strength, and disciplined investment. It is positioned to benefit from opportunities related to climate change initiatives, capacity needs, and infrastructure investment.
cardinal health Q2 2007 Earnings Presentationfinance2
This document provides a summary of Cardinal Health's second quarter earnings for fiscal year 2007. It includes highlights such as revenue increasing 13% year-over-year to $21.8 billion and operating earnings growing 12% to $512 million. Each of the company's business segments saw revenue and operating earnings increases compared to the prior year quarter. The document also outlines Cardinal Health's financial targets for fiscal year 2007, including revenue growth of 8-10% and EPS growth of 12-15%.
Robert G. Bohn, Chairman, President and CEO of Oshkosh Truck Corporation, and Charles L. Szews, Executive VP and CFO, reported record financial results for the first quarter of fiscal year 2006. Sales increased 22.5% to $790.3 million and operating income grew 28.6% to $87 million. EPS increased 28.6% to $0.72. For fiscal year 2006, the company estimates sales between $3.3-3.4 billion, operating income between $316.5-329 million, and EPS between $2.55-2.65, representing growth of 17-21.6%.
1) Oshkosh reported record second quarter fiscal year 2006 results with sales up 25.6% and operating income up 27.3% driven by strong performance in the defense segment.
2) The defense segment results nearly doubled compared to the previous year due to growth in remanufactured and new truck sales, however challenges remain in locating used vehicle carcasses for remanufacturing.
3) The fire and emergency segment saw a temporary dip in earnings as anticipated due to heavily weighted airport product sales in the second half of the year and two component issues that delayed revenue recognition.
Robert G. Bohn, Chairman, President and CEO of Oshkosh Truck Corporation, discussed the company's strong third quarter fiscal year 2006 results and provided an outlook for fiscal years 2006 and 2007. Some highlights included record sales and operating income for Q3 2006. The company also announced two acquisitions, AK Specialty Vehicles and Iowa Mold Tooling, expected to be accretive to earnings in fiscal 2007. For fiscal 2006, Oshkosh estimates sales growth of 14.9-16.6% and EPS growth of 24-26%. Fiscal 2007 estimates include sales of $3.65-$3.75 billion and EPS of $3.05-$3.15.
Oshkosh Truck Corporation presented an investor presentation on its proposed acquisition of JLG Industries, Inc. The presentation discussed Oshkosh's track record of successful acquisitions and shareholder value creation. It also outlined the objectives of acquiring JLG to support growth above 15%, diversify into the fast-growing aerial work platform market, and execute its long-term acquisition strategy. Finally, the presentation provided an overview of Oshkosh Truck Corporation and its proven strategy of new product leadership, operational excellence, and strategic acquisitions that have fueled strong sales and earnings growth.
Robert Bohn, Chairman of Oshkosh Truck Corporation, discussed the company's strong fiscal 2006 financial results and outlook for fiscal 2007. Key points include:
1) Fiscal 2006 sales increased 15.8% and operating income grew 22%, with EPS up 26.6%.
2) The acquisition of JLG Industries was announced, which will diversify the company and support growth of over 15%.
3) Fiscal 2007 stand-alone estimates include sales of $3.65-$3.75 billion and EPS of $3.05-$3.15, with the JLG acquisition expected to be modestly accretive.
In this earnings call, Oshkosh Truck Corporation discusses its first quarter 2007 results. Sales increased 27.4% to $1.01 billion due to the acquisition of JLG Industries. Operating income decreased 3.9% to $83.6 million and EPS decreased 23.6% to $0.55. The company increased its full-year 2007 EPS estimate range to $3.15 to $3.25 per share. JLG is meeting expectations and integration is progressing well. Defense sales were lower compared to strong prior year results while fire and emergency and commercial saw strong performance.
This document summarizes an earnings conference call for Oshkosh Truck Corporation for the second quarter of fiscal year 2007. Sales increased 96.6% to $1.66 billion and operating income grew 69.1% to $134.8 million. For fiscal year 2007, the company estimates sales of $6.1-6.2 billion and operating income of $568-580 million. It also provides segment-level results and highlights for access equipment, defense, fire & emergency, and commercial.
1) Oshkosh reported strong third quarter 2007 results with sales increasing 108% to $1.85 billion and operating income up 133% to $192.7 million.
2) Access equipment and defense led the growth in sales and operating income. The acquisition of JLG was accretive to EPS by $0.35 per share.
3) For fiscal year 2007, Oshkosh estimates sales between $6.3-6.35 billion and EPS between $3.35-3.40, and for fiscal year 2008 estimates sales between $7-7.2 billion and EPS between $4.15-4.35.
The document summarizes Oshkosh Truck Corporation's fourth quarter fiscal 2007 earnings conference call. It discusses record sales and operating income for fiscal 2007. Projections are provided for fiscal 2008, estimating sales between $7.1-7.3 billion and operating income between $690-715 million. Segment performances are reviewed, with access equipment and defense highlighted as key growth drivers. Estimates are also given for interest expense, tax rates, capital expenditures and debt levels for fiscal 2008.
Oshkosh Corporation held an earnings conference call to discuss its first quarter fiscal year 2008 results. Sales increased 49% to $1.5 billion due to strong growth in access equipment and defense, while earnings per share declined 9.1% to $0.50. For fiscal year 2008, the company estimates revenue of $7.1-7.3 billion, operating income of $675-700 million, and earnings per share of $4.15-4.35. Challenging economic conditions are impacting commercial and fire & emergency segments, but global initiatives and cost reductions will support the full-year outlook.
The document summarizes Oshkosh Corporation's earnings conference call for the second quarter of fiscal year 2008. Key highlights include sales increasing 6.7% to $1.8 billion and operating income rising 24.8% to $168.2 million. EPS grew 42.6% to $0.97. While access equipment and defense saw strong demand, commercial and fire & emergency faced challenging market conditions. The company maintained its fiscal year 2008 EPS estimate range of $4.15 to $4.35.
The document summarizes Oshkosh Corporation's earnings conference call for the third quarter of fiscal year 2008. It discusses increases in sales revenue but decreases in operating income and earnings per share compared to the previous year. Several initiatives are mentioned to manage costs and cash flow in changing market conditions. Business segment results are provided, with strength in access equipment and defense but challenges in commercial and fire & emergency sectors.
This document is the transcript from Oshkosh Corporation's earnings conference call for the fourth quarter of fiscal year 2008. It discusses Oshkosh's financial results for Q4 and fiscal year 2008, including sales, operating income, earnings per share, and debt reduction. It also provides an outlook for fiscal year 2009, estimating revenues of $6.3-6.7 billion, operating income of $350-400 million, and EPS of $1.65-2.05. The transcript reviews performance and outlook for each of Oshkosh's business segments and discusses its financing plans.
Robert Bohn and David Sagehorn of Oshkosh Corporation gave a presentation at the Goldman Sachs Conference in November 2008. They discussed Oshkosh's strong financial position and actions taken to reduce costs and debt. While market conditions were volatile due to the economic downturn, Oshkosh was well positioned with backlogs in defense, fire, and refuse collection vehicles. The presentation outlined Oshkosh's segments and strategies to manage through the difficult economy.
1) The document is from a presentation given by Oshkosh executives Charles Szews and David Sagehorn at the R.W. Baird Industrial Conference on November 12, 2008.
2) Oshkosh reported sales increased 13.2% to $7.1 billion in fiscal 2008, with international sales reaching $2.1 billion. However, operating income decreased 1.5% and EPS decreased 5.9% due to non-cash impairment charges.
3) Oshkosh recently secured multiple defense contracts and sees opportunities in the domestic refuse collection vehicle market, but the current market volatility and credit crisis make fiscal 2009 projections difficult given exposure to construction and municipal spending.
Charles Szews, President and COO of Oshkosh Corporation, presented at the Cowen and Company Aerospace & Defense Conference on February 5, 2009. He discussed Oshkosh's business segments, products, competitive advantages, challenges, and actions taken in response to the economic downturn. Key points included reduced revenues and earnings in Q1 2009, cost reduction efforts, and focus on core businesses with strong backlogs like defense and fire apparatus that have gained market share.
Oshkosh Corporation held an earnings conference call to discuss its first quarter fiscal year 2008 results. Sales increased 49% to $1.5 billion due to strong growth in access equipment and defense, while earnings per share declined 9.1% to $0.50. For fiscal year 2008, the company estimates revenue of $7.1-7.3 billion, operating income of $675-700 million, and earnings per share of $4.15-4.35. Challenging economic conditions are impacting commercial and fire & emergency segments, but global initiatives and cost reductions will support the full-year outlook.
The document summarizes Oshkosh Corporation's earnings conference call for the second quarter of fiscal year 2008. Key highlights include sales increasing 6.7% to $1.8 billion and operating income rising 24.8% to $168.2 million. EPS grew 42.6% to $0.97. While access equipment and defense saw strong demand, commercial and fire & emergency faced challenging market conditions. The company maintained its fiscal year 2008 EPS estimate range of $4.15 to $4.35.
This document contains the transcript from Oshkosh Corporation's earnings conference call for the third quarter of fiscal year 2008. Key highlights include a 6.6% increase in quarterly sales to $1.97 billion but a 5.9% decrease in operating income to $181.2 million. EPS for the quarter decreased 1.7% to $1.19. Oshkosh revised its estimate for full year 2008 EPS to a range of $3.15 to $3.30.
This document summarizes an earnings conference call for Oshkosh Corporation for the fourth quarter of fiscal year 2008. It discusses the company's financial results including a 5.8% increase in sales to $1.9 billion but a 32% decrease in operating income to $122 million. The document also provides an overview of Oshkosh's fiscal year 2008 results and discusses challenges faced in various business segments due to economic conditions. It notes actions taken by the company to reduce costs and debt. An outlook is given for fiscal year 2009 noting market volatility and a plan to drive over $500 million in debt reduction. Business segment results and outlooks are also summarized.
ITES KPO BPO IT sector in the country has increased at an incredible rate o...yashwanthkumar517728
ites KPO and BPO,IT sector in the country has increased at an incredible rate of 35% per year for the last 10 years reinforces the view that India is world class in IT
The IT sector is one of the largest employers of women, and therefore, can play a crucial role in women empowerment and the reduction of gender inequalities.
CRYPTOCURRENCY REVOLUTIONIZING THE FINANCIAL LANDSCAPE AND SHAPING THE FUTURE...itsfaizankhan091
Cryptocurrency, a digital or virtual form of currency that uses cryptography for security, has revolutionized the financial landscape. Originating with Bitcoin's inception in 2009 by the pseudonymous Satoshi Nakamoto, cryptocurrencies have grown from niche curiosities to mainstream financial instruments, reshaping how we think about money, transactions, and the global economy.
The birth of Bitcoin marked the beginning of the cryptocurrency era. Unlike traditional currencies issued by governments and controlled by central banks, Bitcoin operates on a decentralized network using blockchain technology. This technology ensures transparency, security, and immutability of transactions, fundamentally challenging the centralized financial systems that have dominated for centuries.
Bitcoin was conceived as a peer-to-peer electronic cash system, aimed at providing an alternative to the traditional banking system plagued by inefficiencies, high fees, and lack of transparency. The underlying blockchain technology, a distributed ledger maintained by a network of nodes, ensures that every transaction is recorded and cannot be altered, thus providing a secure and transparent financial system.
June 20, 2024
CRYPTOCURRENCY: REVOLUTIONIZING THE FINANCIAL LANDSCAPE AND SHAPING THE FUTURE
Cryptocurrency: Revolutionizing the Financial Landscape and Shaping the Future
Cryptocurrency, a digital or virtual form of currency that uses cryptography for security, has revolutionized the financial landscape. Originating with Bitcoin's inception in 2009 by the pseudonymous Satoshi Nakamoto, cryptocurrencies have grown from niche curiosities to mainstream financial instruments, reshaping how we think about money, transactions, and the global economy.
#### The Genesis of Cryptocurrency
The birth of Bitcoin marked the beginning of the cryptocurrency era. Unlike traditional currencies issued by governments and controlled by central banks, Bitcoin operates on a decentralized network using blockchain technology. This technology ensures transparency, security, and immutability of transactions, fundamentally challenging the centralized financial systems that have dominated for centuries.
Bitcoin was conceived as a peer-to-peer electronic cash system, aimed at providing an alternative to the traditional banking system plagued by inefficiencies, high fees, and lack of transparency. The underlying blockchain technology, a distributed ledger maintained by a network of nodes, ensures that every transaction is recorded and cannot be altered, thus providing a secure and transparent financial system.
#### The Proliferation of Altcoins
Following Bitcoin's success, thousands of alternative cryptocurrencies, or altcoins, have emerged. Each of these altcoins aims to improve upon Bitcoin or serve specific purposes within the digital economy. Notable examples include Ethereum, which introduced smart contracts – self-executing contracts with the terms of the agreement
Navigating Your Financial Future: Comprehensive Planning with Mike Baumannmikebaumannfinancial
Learn how financial planner Mike Baumann helps individuals and families articulate their financial aspirations and develop tailored plans. This presentation delves into budgeting, investment strategies, retirement planning, tax optimization, and the importance of ongoing plan adjustments.
13 Jun 24 ILC Retirement Income Summit - slides.pptxILC- UK
ILC's Retirement Income Summit was hosted by M&G and supported by Canada Life. The event brought together key policymakers, influencers and experts to help identify policy priorities for the next Government and ensure more of us have access to a decent income in retirement.
Contributors included:
Jo Blanden, Professor in Economics, University of Surrey
Clive Bolton, CEO, Life Insurance M&G Plc
Jim Boyd, CEO, Equity Release Council
Molly Broome, Economist, Resolution Foundation
Nida Broughton, Co-Director of Economic Policy, Behavioural Insights Team
Jonathan Cribb, Associate Director and Head of Retirement, Savings, and Ageing, Institute for Fiscal Studies
Joanna Elson CBE, Chief Executive Officer, Independent Age
Tom Evans, Managing Director of Retirement, Canada Life
Steve Groves, Chair, Key Retirement Group
Tish Hanifan, Founder and Joint Chair of the Society of Later life Advisers
Sue Lewis, ILC Trustee
Siobhan Lough, Senior Consultant, Hymans Robertson
Mick McAteer, Co-Director, The Financial Inclusion Centre
Stuart McDonald MBE, Head of Longevity and Democratic Insights, LCP
Anusha Mittal, Managing Director, Individual Life and Pensions, M&G Life
Shelley Morris, Senior Project Manager, Living Pension, Living Wage Foundation
Sarah O'Grady, Journalist
Will Sherlock, Head of External Relations, M&G Plc
Daniela Silcock, Head of Policy Research, Pensions Policy Institute
David Sinclair, Chief Executive, ILC
Jordi Skilbeck, Senior Policy Advisor, Pensions and Lifetime Savings Association
Rt Hon Sir Stephen Timms, former Chair, Work & Pensions Committee
Nigel Waterson, ILC Trustee
Jackie Wells, Strategy and Policy Consultant, ILC Strategic Advisory Board
KYC Compliance: A Cornerstone of Global Crypto Regulatory FrameworksAny kyc Account
This presentation explores the pivotal role of KYC compliance in shaping and enforcing global regulations within the dynamic landscape of cryptocurrencies. Dive into the intricate connection between KYC practices and the evolving legal frameworks governing the crypto industry.
Monthly Market Risk Update: June 2024 [SlideShare]Commonwealth
Markets rallied in May, with all three major U.S. equity indices up for the month, said Sam Millette, director of fixed income, in his latest Market Risk Update.
For more market updates, subscribe to The Independent Market Observer at https://blog.commonwealth.com/independent-market-observer.
PFMS, India's Public Financial Management System, revolutionizes fund tracking and distribution, ensuring transparency and efficiency. It enables real-time monitoring, direct benefit transfers, and comprehensive reporting, significantly improving financial management and reducing fraud across government schemes.
Call Girls Chennai 8824825030 Independent Call Girl Service Chennai
celanese q4_2007_presentation
1. Celanese 4Q 2007 Earnings
Conference Call / Webcast
Tuesday, February 5, 2008 10:00 a.m. ET
Dave Weidman, Chairman and CEO
Steven Sterin, Senior Vice President and CFO
1
2. Forward Looking Statements, Reconciliation and Use of Non-
GAAP Measures to U.S. GAAP
Forward-Looking Statements
This presentation may contain “forward-looking statements,” which include information concerning the company’s plans, objectives, goals,
strategies, future revenues or performance, capital expenditures, financing needs and other information that is not historical information. When
used in this release, the words “outlook,” “forecast,” “estimates,” “expects,” “anticipates,” “projects,” “plans,” “intends,” “believes,” and
variations of such words or similar expressions are intended to identify forward-looking statements. All forward-looking statements are based
upon current expectations and beliefs and various assumptions. There can be no assurance that the company will realize these expectations or
that these beliefs will prove correct. There are a number of risks and uncertainties that could cause actual results to differ materially from the
forward-looking statements contained in this presentation. Numerous factors, many of which are beyond the company’s control, could cause
actual results to differ materially from those expressed as forward-looking statements. Certain of these risk factors are discussed in the company’s
filings with the Securities and Exchange Commission. Any forward-looking statement speaks only as of the date on which it is made, and the
company undertakes no obligation to update any forward-looking statements to reflect events or circumstances after the date on which it is made
or to reflect the occurrence of anticipated or unanticipated events or circumstances.
Reconciliation of Non-U.S. GAAP Measures to U.S. GAAP
This presentation reflects five performance measures, operating EBITDA, affiliate EBITDA, adjusted earnings per share, net debt and adjusted
free cash flow, as non-U.S. GAAP measures. The most directly comparable financial measure presented in accordance with U.S. GAAP in our
consolidated financial statements for operating EBITDA is operating profit; for affiliate EBITDA is equity in net earnings of affiliates; for
adjusted earnings per share is earnings per common share-diluted; for net debt is total debt; and for adjusted free cash flow is cash flow from
operations.
Use of Non-U.S. GAAP Financial Information
Operating EBITDA, a measure used by management to measure performance, is defined as operating profit from continuing
operations, plus equity in net earnings from affiliates, other income and depreciation and amortization, and further adjusted for other
charges and adjustments. We provide guidance on operating EBITDA and are unable to reconcile forecasted operating EBITDA to a
GAAP financial measure because a forecast of Other Charges and Adjustments is not practical. Our management believes operating
EBITDA is useful to investors because it is one of the primary measures our management uses for its planning and budgeting processes
and to monitor and evaluate financial and operating results. Operating EBITDA is not a recognized term under U.S. GAAP and does
not purport to be an alternative to operating profit as a measure of operating performance or to cash flows from operating activities as
a measure of liquidity. Because not all companies use identical calculations, this presentation of operating EBITDA may not be
comparable to other similarly titled measures of other companies. Additionally, operating EBITDA is not intended to be a measure of
free cash flow for management’s discretionary use, as it does not consider certain cash requirements such as interest payments, tax
payments and debt service requirements nor does it represent the amount used in our debt covenants.
Affiliate EBITDA, a measure used by management to measure performance of its equity investments, is defined as the proportional
operating profit plus the proportional depreciation and amortization of its equity investments. Affiliate EBITDA, including Celanese
Proportional Share of affiliate information on Table 8, is not a recognized term under U.S. GAAP and is not meant to be an
alternative to operating cash flow of the equity investments. The company has determined that it does not have sufficient ownership
for operating control of these investments to consider their results on a consolidated basis. The company believes that investors should
consider affiliate EBITDA when determining the equity investments’ overall value in the company.
Adjusted earnings per share is a measure used by management to measure performance. It is defined as net earnings (loss) available to
common shareholders plus preferred dividends, adjusted for other charges and adjustments, and divided by the number of basic
common shares, diluted preferred shares, and options valued using the treasury method. We provide guidance on an adjusted earnings
per share basis and are unable to reconcile forecasted adjusted earnings per share to a GAAP financial measure because a forecast of
Other Items is not practical. We believe that the presentation of this non-U.S. GAAP measure provides useful information to
management and investors regarding various financial and business trends relating to our financial condition and results of
operations, and that when U.S. GAAP information is viewed in conjunction with non-U.S. GAAP information, investors are provided
with a more meaningful understanding of our ongoing operating performance. This non-U.S. GAAP information is not intended to be
considered in isolation or as a substitute for U.S. GAAP financial information.
Net debt is defined as total debt less cash and cash equivalents. We believe that the presentation of this non-U.S. GAAP measure
provides useful information to management and investors regarding changes to the company’s capital structure. Our management and
credit analysts use net debt to evaluate the company's capital structure and assess credit quality. This non-U.S. GAAP information is
not intended to be considered in isolation or as a substitute for U.S. GAAP financial information.
Adjusted free cash flow is defined as cash flow from operations less capital expenditures, other productive asset purchases, operating
cash from discontinued operations and certain other charges. We believe that the presentation of this non-U.S. GAAP measure
provides useful information to management and investors regarding changes to the company’s cash flow. Our management and credit
analysts use adjusted free cash flow to evaluate the company’s liquidity and assess credit quality. This non-U.S. GAAP information is
not intended to be considered in isolation or as a substitute for U.S. GAAP financial information.
2
3. Dave Weidman
Chairman and Chief Executive Officer
3
4. Celanese Corporation 4Q and Full Year 2007
Highlights
4th Qtr 4th Qtr
in millions (except EPS) FY 2007 FY 2006
2007 2006
Net Sales $1,430 $5,778
$1,760 $6,444
Operating Profit $140 $620
$324 $748
Adjusted EPS $0.61 $2.62
$0.93 $3.42
Operating EBITDA $269 $1,144
$349 $1,325
FY 2007
4Q 2007
4Q net sales increased 23% FY 2007 net sales increased 12%
► ►
Higher pricing on continued strong demand for Improved pricing and favorable currency
► ►
Acetyl Intermediates and Consumer and effects more than offset volume losses related
Industrial Specialties to Clear Lake outage
Continued volume increases in Advanced Operating profit up 21% to $748 million
► ►
Engineered Materials
Adjusted EPS up 31% to $3.42/share
►
Favorable currency impacts
►
Operating EBITDA increased 16% to $1,325
►
Operating profit more than doubled to $324
►
Additional sales and earnings contributed by
►
million
acquisition of APL
Adjusted EPS up 52% to $0.93/share
►
Discontinued Methanol production contributed
►
Operating EBITDA increased to $349 $0.13 per share and $31 million in Operating
►
EBITDA in the year
4 Note: All figures exclude results of the divested Oxo Alcohol business. The results of the discontinued Edmonton Methanol business have only been excluded from Net Sales and Operating Profit.
5. 2008 Business Outlook
Volume growth >2x GDP across both transportation
►
and non-transportation applications
Advanced
► Continued high energy and raw material costs
Engineered
expected to pressure margins
Materials 2008 Guidance:
► Significant progress expected in Nanjing
production capabilities Adjusted EPS
Synergy capture from APL integration
► $3.40 to $3.70
Consumer
► Strong underlying business fundamentals
Specialties
Operating EBITDA
High raw material costs continue
►
Industrial
$1,290 to $1,360 million
► Realize benefits from revitalization efforts
Specialties
Forecasted 2008
Continued strong global demand
►
adjusted tax rate of
► Incremental acetic acid volume
associated with China expansion 26%
Acetyl
► VAM and acetic anhydride production scheduled to
Intermediates
begin in Nanjing
► Prices expected to adjust in 2008
5
6. Committed to Delivering Value Creation
Primary Growth Focus
Balance Operational EBITDA
Group Asia Revitalization Innovation Organic
Sheet Excellence Impact
Consumer and
EPS Operating EBITDA
Industrial X X X X >$100MM
Specialties
Advanced
Engineered X X X X >$100MM
Materials
Acetyl
X X X >$100MM
Intermediates
Celanese Incremental
X X
Corporate EPS
$350 – $400 million increased EBITDA profile
plus EPS potential by 2010
6
9. Advanced Engineered Materials
4th Qtr 4th Qtr FY FY
in millions 2007 2006 2007 2006
Net Sales $224 $915
$253 $1,030
Operating EBITDA $58 $260
$45 $252
Fourth Quarter 2007:
► Net sales increase driven primarily by strong volume growth (8%) and
positive currency effects (6%)
► Higher raw material and energy costs and lower pricing due to
product mix more than offset volume growth
► Overall lower earnings from equity affiliates and continued high input
cost pressures drove decreased Operating EBITDA
9
10. Consumer Specialties
4th Qtr 4th Qtr FY FY
in millions 2007 2006 2007 2006
Net Sales $224 $876
$279 $1,111
Operating EBITDA $53 $228
$57 $274
Fourth Quarter 2007:
► Increase in net sales for the quarter primarily the result of $62 million
contribution from APL
► Operating EBITDA improvement driven by higher overall volumes
and pricing as well as incremental earnings from APL
10
11. Industrial Specialties
4th Qtr 4th Qtr FY FY
in millions 2007 2006 2007 2006
Net Sales $309 $1,281
$331 $1,346
Operating EBITDA $25 $118
$41 $119
Fourth Quarter 2007:
► Increase in net sales primarily driven by favorable pricing and
currency effects
► Higher pricing on strong demand offset raw material cost pressures
contributing to improved Operating EBITDA for the quarter
11
12. Acetyl Intermediates
4th Qtr 4th Qtr FY FY
in millions 2007 2006 2007 2006
Net Sales $831 $3,615 $3,351
$1,083
Operating EBITDA $169 $672
$231 $762
Fourth Quarter 2007:
► Higher pricing, additional volumes from Nanjing unit and
favorable currency effects drove record sales
► Favorable supply/demand economics, industry production
outages and strong demand sustained higher pricing for acetic
acid and VAM
► Operating EBITDA includes increased dividends from the Ibn
Sina cost affiliate
12
13. Affiliates Continue to Deliver Value
4Q 2007: Earnings impact relatively flat for the period; Decreased cash flows due to special
►
dividend from Polyplastics in 4Q 2006
FY 2007: Increased earnings driven primarily by higher cost dividends from China Acetate
►
ventures and Ibn Sina affiliate
Operating EBITDA of $1,325 excludes ~$93 million of proportional Affiliate EBITDA
►
FY 2008: Affiliate earnings1 expected to be between $175 - $185 million
►
Income Statement Cash Flow
200 200
160 160
$ millions
$ millions
120 120
80 80
40 40
0 0
4Q 2006 4Q 2007 FY 2006 FY 2007 4Q 2006 4Q 2007 FY 2006 FY 2007
Dividends - Cost Investments
Earnings - Equity Investments Dividends - Equity Investments
13 Cost dividends and equity earnings. Note: All figures exclude results of the divested Oxo Alcohol business.
1
14. Continued Strong Cash Generation
Adjusted Free Cash Flow
FY 2007 FY 2006
in millions
Net cash provided by operating activities $566 $751
Adjustments to operating cash for discontinued operations $84 ($10)
Net cash provided by operating activities from continuing operations $650 $741
Less: Capital expenditures $288 $244
Add: Other charges and other adjustments1 $23 ($41)
Adjusted Free Cash Flow $385 $456
Factors contributing to strong cash generation during 2007:
► Strong operating performance
► Continued commitment and increased investment in Asia
► 2007 cash flows from operations included ~$90 million in additional cash taxes
Amounts primarily associated with the long-term management compensation plan payment in 2007 and the cash outflows for purchases of other productive assets that are classified as
1
14
‘investing activities’ for U.S. GAAP purposes.
15. 2008 Guidance
2008 Updated Guidance
Adjusted Operating
EPS EBITDA ($MM)
Current $3.40 - $3.70 $1,290 - $1,360
Previous $3.35 - $3.65 $1,280 - $1,350
Affiliate Income1 Estimated Adjusted Tax Rate for
► ►
Adjusted EPS
$175 – $185 million
26%
Net Interest2
►
Cash Taxes
►
$200 – $210 million
$100 – $120 million
Depreciation and Amortization
►
Capital Expenditure
►
$300 – $310 million
$280 – $300 million
Share Count
►
169 million
Cost dividends and equity earnings.
1
15 Net cash interest and interest expense.
2
17. 4Q 2007 Other Charges and Other Adjustments
by Segment
in millions AEM CS IS AI Other Total
Employee termination - - $1 $4 - $5
benefits
Plant/office closures - - $2 $5 - $7
Insurance recoveries
($2) - - - - ($2)
associated with plumbing
cases
Insurance recoveries - ($5) ($7) ($63) $35 ($40)
associated with Clear Lake
Resolution of commercial -
- - ($31) - ($31)
disputes
Ticona Kelsterbach relocation $1 - - - - $1
Other - $1 $1 ($2) - -
Total other charges ($1) ($4) ($3) ($87) $35 ($60)
-
Business optimization $1 - - $7 $8
Edmonton sale - ($22) - ($12) - ($34)
Other ($10) ($1) $2 $2 - ($7)
Total other adjustments ($9) ($23) $2 ($10) $7 ($33)
Total other charges and ($10) ($27) ($1) ($97) $42 ($93)
other adjustments
17
18. Reg G: Reconciliation of Adjusted EPS
Adjusted Earnings Per Share - Reconciliation of a Non-U.S. GAAP Measure
Three Months Ended Twelve Months Ended
December 31, December 31,
2007 2006 2007 2006
(in $ millions, except per share data)
Earnings from continuing operations
125 526
before tax and minority interests 313 447
Non-GAAP Adjustments:
1
Other charges and other adjustments 15 92
(93) 113
- -
Refinancing costs - 254
Adjusted earnings from continuing operations
140 618
before tax and minority interests 220 814
2
Income tax provision on adjusted earnings (35) (163)
(62) (228)
(1)
Minority interests (4)
(1) (1)
Adjusted earnings from continuing operations 157 104 585 451
Preferred dividends (2) (10)
(3) (10)
Adjusted net earnings available to common shareholders 154 102 575 441
Add back: Preferred dividends 2 10
3 10
Adjusted net earnings for adjusted EPS 157 104 585 451
Diluted shares (millions)
Weighted average shares outstanding 158.7 158.6
151.7 154.5
12.0
Assumed conversion of Preferred Shares 12.0 12.0
12.0
-
Assumed conversion of Restricted Stock - 0.4
0.6
1.8 1.2
Assumed conversion of stock options 4.3
4.3
Total diluted shares 172.5 171.8
168.6 171.2
Adjusted EPS 0.93 0.61 3.42 2.62
1
See Table 7 for details
2
The adjusted tax rate for the three and twelve months ended December 31, 2007 is 28% based on the original full year 2007 guidance.
18
19. Reg G: Reconciliation of Net Debt
Net Debt - Reconciliation of a Non-U.S. GAAP Measure
December 31, December 31,
2007 2006
(in $ millions)
Short-term borrowings and current
installments of long-term debt - third party and affiliates 309
272
Long-term debt 3,189
3,284
Total debt 3,556 3,498
Less: Cash and cash equivalents 791
825
Net Debt 2,731 2,707
19
20. Reg G: Other Charges and Other Adjustments
Other Charges and Other Adjustments
Other Charges:
Three Months Ended Twelve Months Ended
December 31, December 31,
(in $ millions) 2007 2006 2007 2006
Employee termination benefits 1 12
5 32
(1)
Plant/office closures (1) 11
7
Insurance recoveries associated with plumbing cases (2) (5)
(2) (4)
Insurance recoveries associated with Clear Lake, Texas - -
(40) (40)
Resolution of commercial disputes with a vendor - -
(31) (31)
Deferred compensation triggered by Exit Event - -
- 74
Asset impairments - -
- 9
Ticona Kelsterbach plant relocation - -
1 5
-
Other 4
- 2
Total (60) (2) 58 10
Other Adjustments: 1
Three Months Ended Twelve Months Ended
December 31, December 31,
(in $ millions) 2007 2006 2007 2006
Executive severance & other costs related
to Squeeze-Out 2 30
- -
Ethylene pipeline exit costs - -
- 10
Business optimization 8 12
8 18
Foreign exchange loss related to refinancing transaction - -
- 22
Loss on AT Plastics films sale - -
- 7
2
Discontinued methanol production 16 52
- 31
Gain on disposal of investment (Pemeas) (11) (11)
- -
Gain on Edmonton sale - -
(34) (34)
Other 2 (1)
(7) 1
(33) 17 55 82
Total
(93) 15 113 92
Total other charges and other adjustments
1
These items are included in net earnings but not included in other charges.
2
Adjusted earnings per share included earnings from its discontinued methanol production which was included in the company's 2007 guidance.
20
21. 21
Segment Data and Reconciliation of Operating Profit (Loss) to Operating EBITDA -
a Non-U.S. GAAP Measure
Three Months Ended Twelve Months Ended
December 31, December 31,
(in $ millions) 2007 2006 2007 2006
Net Sales
253 1,030
Advanced Engineered Materials 224 915
279 1,111
Consumer Specialties 224 876
331 1,346
Industrial Specialties 309 1,281
1,083 3,615
Acetyl Intermediates 831 3,351
1
Other Activities - 2
6 22
(186) (660)
Intersegment eliminations (164) (667)
Total 1,760 1,430 6,444 5,778
Operating Profit (Loss)
30 133
Advanced Engineered Materials 29 145
69 199
Consumer Specialties 41 165
26 28
Industrial Specialties 9 44
276 616
Acetyl Intermediates 107 456
1
Other Activities (77) (228)
(46) (190)
Total 324 140 748 620
Equity Earnings and Other Income/(Expense) 2
7 55
Advanced Engineered Materials 13 55
3 40
Consumer Specialties 2 24
- -
Industrial Specialties - (1)
27 78
Acetyl Intermediates 23 63
1
Other Activities 8 -
12 22
Total 45 50 173 163
Other Charges and Other Adjustments 3
(10) (5)
Advanced Engineered Materials (1) (5)
(27) (16)
Consumer Specialties - -
(1) 32
Industrial Specialties 2 16
(97) (38)
Acetyl Intermediates 16 52
1
Other Activities 42 140
(2) 29
Total (93) 15 113 92
Depreciation and Amortization Expense
18 69
Advanced Engineered Materials 17 65
12 51
Consumer Specialties 10 39
16 59
Industrial Specialties 14 59
25 106
Acetyl Intermediates 23 101
1
Other Activities - 5
6
2
Total 73 64 291 269
Operating EBITDA
Reg G: Reconciliation of Operating EBITDA
45 252
Advanced Engineered Materials 58 260
57 274
Consumer Specialties 53 228
41 119
Industrial Specialties 25 118
231 762
Acetyl Intermediates 169 672
1
Other Activities (25) (82)
(36) (134)
Total 349 269 1,325 1,144
1
Other Activities primarily includes corporate selling, general and administrative expenses and the results from captive insurance companies.
The 2007 Operating Profit (Loss) and Other Charges and Other Adjustments amounts include deductible associated with insurance recovery.
2
Includes equity earnings from affiliates, dividends from cost investments and other income/(expense).
3
Excludes adjustments to minority interest, net interest, taxes, depreciation, amortization and discontinued operations (See Table 7).
22. Reg G: Equity Affiliate Preliminary Results and
Celanese Proportional Share - Unaudited
Equity Affiliate Preliminary Results - Celanese Proportional Share - Unaudited4
Equity Affiliate Preliminary Results - Total - Unaudited
Three Months Ended Twelve Months Ended
(in $ millions) December 31, December 31,
2007 2006 2007 2006
2007 2006 2007 2006 Net Sales
Net Sales Ticona Affiliates 143 542
155 587
Ticona Affiliates1 Infraserv 124 518
310 1,172 199 587
336 1,270
Total
Infraserv2 354 267 1,174 1,060
381 1,391
623 1,798
Total Operating Profit
959 691 3,068 2,563
Ticona Affiliates 19 81
19 89
Operating Profit Infraserv 5 21
9 29
Total
Ticona Affiliates 41 171 28 24 118 102
40 188
Infraserv 13 60
26 87 Depreciation and Amortization
Total 66 54 275 231 Ticona Affiliates 7 24
8 26
Infraserv 6 25
11 31
Depreciation and Amortization Total 19 13 57 49
Ticona Affiliates 16 51
17 56
Affiliate EBITDA3
Infraserv 22 81
26 87 Ticona Affiliates 26 104
27 115
Total 43 38 143 132 Infraserv 11 45
20 59
Total 47 37 174 149
Affiliate EBITDA3
Equity in net earnings of affiliates (as reported on the Income Statement)
Ticona Affiliates 57 222
57 244
Ticona Affiliates 13 52
9 56
Infraserv 35 141
52 174 Infraserv 7 21
7 25
Total Other5
109 92 418 363 3 3
1 1
Total 17 23 82 76
Net Income
Affiliate EBITDA in excess of Equity in net earnings of affiliates6
Ticona Affiliates 27 112
21 119
Ticona Affiliates 13 52
Infraserv 15 53 18 59
20 79
Infraserv 4 24
13 34
Total 41 42 198 165
Total 31 17 93 76
Net Debt Net Debt
Ticona Affiliates 25 25
208 208 Ticona Affiliates 11 11
96 96
Infraserv 25 25 Infraserv 11 11
15 15
39 39
Total 111 22 111 22
Total 247 50 247 50
1
Ticona Affiliates includes PolyPlastics (45% ownership), Korean Engineering Plastics (50%) and Fortron Industries(50%)
2
Infraserv includes Infraserv Entities valued as equity investments (Infraserv Höchst Group - 31% ownership, Infraserv Gendorf - 39% and Infraserv Knapsack 27%)
3
Affiliate EBITDA is the sum of Operating Profit and Depreciation and Amortization, a non-U.S. GAAP measure
4
Calculated as the product of figures from the above table times Celanese ownership percentage
22 5 .
This represents liquidating dividends from Clear Lake Methanol Patrners
6
Product of Celanese proportion of Affiliate EBITDA less Equity in net earnings of affiliates; not included in Celanese operating EBITDA