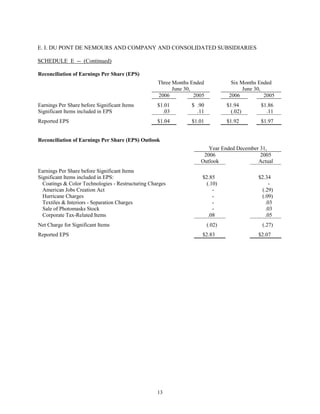
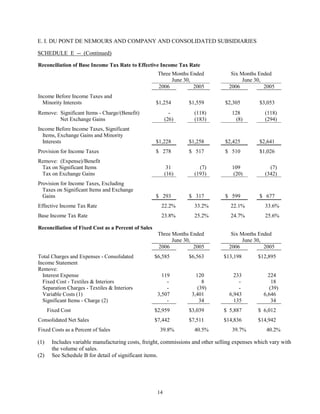
SlideShare a Scribd company logo
July 25, 2006                                           Contact:    Anthony Farina
WILMINGTON, Del.                                                    302-774-4005
                                                                    Anthony.R.Farina@usa.dupont.com


       DUPONT REPORTS SECOND QUARTER 2006 EARNINGS OF $1.04 PER SHARE;
         SEES STRONG YEAR-OVER-YEAR EARNINGS GROWTH IN SECOND HALF


                                                  Highlights


•   The company reported second quarter 2006 earnings of $1.04 per share. Excluding significant items,
    earnings per share were $1.01, up 12 percent from $.90 per share last year.

•   Average local prices were 2 percent higher and increased for the 10th consecutive quarter. Worldwide
    sales volumes increased 1 percent, while currency effects reduced sales 1 percent.

•   Total fixed costs declined $80 million year-over-year, and as a percentage of sales improved 70 basis
    points to 39.8 percent.

•   The company reaffirms its full year earnings outlook and expects second half earnings to be up
    significantly compared to 2005.

                “Our results this quarter reflect progress in executing our growth strategies and performance
improvement initiatives,” said Charles O. Holliday, Jr., DuPont chairman and chief executive officer. “Our
businesses delivered improved pricing, more new product innovations, and again demonstrated excellent cost
control. We also achieved important milestones in our emerging biofuels business and in our seed pipeline.
We are well-positioned for strong earnings growth in the second half.”


Global Consolidated Net Income and Sales
                Consolidated net income for the second quarter was $975 million, or $1.04 per share
compared to second quarter 2005 net income of $1,015 million, or $1.01 per share. Excluding significant
items, earnings per share were $1.01 in the second quarter 2006 compared to $.90 in the prior year. See
Schedule B for a summary of significant items.
                Second quarter 2006 net income reflects higher local selling prices across all regions, lower
fixed costs, and the impact of higher energy and ingredient costs. The current quarter net income also
reflects higher miscellaneous income and a lower income tax rate.
Consolidated net sales for the second quarter were $7.4 billion versus $7.5 billion last year. On a
comparable business basis, sales were up 2 percent. For the quarter, total company volumes increased
1 percent, reflecting increases in all regions except the United States.


                                         Three Months Ended                       Percentage Change Due to:
                                            June 30, 2006                    Local        Currency
(Dollars in billions)                    $        % Change*                  Price         Effect       Volume

U.S.                                   $3.3               (1)%                  2                 -                   (3)
Europe                                  2.0                -                    1                (3)                   2
Asia Pacific                            1.2                7                    2                (2)                   7
Canada & Latin America                  0.9                9                    2                 2                    5

Total Consolidated Sales               $7.4                2                    2                (1)                  1

    Percentages shown are on a comparable business basis by excluding second quarter 2005 sales of $202 million for
*
    former elastomers businesses transferred to The Dow Chemical Company on June 30, 2005.


                                                                 2
Earnings Per Share
                The table below shows the variances in second quarter 2006 earnings per share (EPS) versus
second quarter 2005, by major element:


                                            EPS ANALYSIS

                                                                         2nd Quarter

                       EPS - 2005                                          $1.01

                       2Q'05 Significant items (see Schedule B)              .11

                                                                           $ .90

                         Local prices                                        .11
                         Volume                                              .01
                         Variable costs                                     (.15)
                         Fixed costs                                         .03
                         Currency/Misc. income                               .04
                         Lower shares net of higher interest                 .05
                         Tax Rate                                            .02

                           Subtotal                                         1.01

                       2Q'06 Significant item (see Schedule B)               .03

                       EPS - 2006                                          $1.04


                Improved local pricing and higher volumes offset a significant portion of higher raw material
costs. Fixed cost productivity, measured as a percent of sales, improved 70 basis points versus last year,
reflecting an $80 million year-over-year reduction in total fixed costs. After adjusting for currency effects,
volume and portfolio changes, after-tax fixed costs were $.03 per share lower than last year.


                                                         3
Business Segment Performance
                    Segment pretax operating income (PTOI) for second quarter 2006 was $1.5 billion, 6 percent
below last year. PTOI excluding significant items was essentially flat. Segment PTOI, sales, and percentage
changes versus second quarter 2005 are shown in the tables below.


                                                                                 Three Months Ended June 30
PRETAX OPERATING INCOME                                                                                    % Change
(Dollars in millions)                                                  2006               2005              vs. 2005
Agriculture & Nutrition                                              $ 428                   $ 511                 (16) %
Coatings & Color Technologies                                          222                     188                  18
Electronic & Communication Technologies                                169                     217                 (22) *
Performance Materials                                                  193                     190                   2
Pharmaceuticals                                                        200                     192                   4
Safety & Protection                                                    310                     283                  10
Other                                                                  (30)                      7                (529) **
     Total                                                           $1,492                   $1,588                (6) %

*       2005 PTOI includes a $48 million gain on the sale of Photomasks.
**      2005 includes a $39 million gain on the disposition of a Textiles & Interiors affiliate.


                                                                                                            Percentage
                                                                   Three Months Ended                    Change Due to:
SEGMENT SALES*                                                           June 30                       U.S. $
(Dollars in billions)                                               $         % Change                 Price        Volume

Agriculture & Nutrition                                           $2.0                 (4)              (1)            (3)
Coatings & Color Technologies                                      1.6                  2                1              1
Electronic & Communication Technologies                            1.0                  3                1              2
Performance Materials                                              1.7                  6                3              3
Safety & Protection                                                1.4                  3                3              -

*      Segment sales include inter-segment transfers and a pro rata share of affiliates' sales. Percentages shown for
       Performance Materials are after excluding second quarter 2005 sales of $202 million for former elastomers businesses
       transferred to The Dow Chemical Company on June 30, 2005.


                    Following are summaries of second quarter 2006 performance for the business segments.
Additional information on segment performance is available on the DuPont Investor Center at
http://www.dupont.com.


                                                                      4
Agriculture & Nutrition
•   PTOI decreased $83 million with current quarter earnings of $428 million versus $511 million in the prior
    year, primarily due to lower crop protection sales and higher cost of goods sold.

•   Second quarter sales of $2.0 billion were down 4 percent. Higher Pioneer seed sales of 3 percent, including
    share gain in soybeans, were more than offset by lower crop protection volumes and prices.

•   During the quarter, the company licensed rights to several of its pipeline candidates and recorded income of
    $30 million.

Coatings & Color Technologies

•   PTOI was $222 million versus prior year PTOI of $188 million. Earnings improvement was broad-based
    across the titanium dioxide, refinish, OEM and advanced coatings product lines. PTOI margins increased to
    13.6% and fixed costs declined.

•   Second quarter sales were $1.6 billion, up 2 percent reflecting higher local prices in all product lines.

•   Cost reductions and consolidation of facilities as part of the transformation program for the coatings unit
    remain on track.

Electronic & Communication Technologies

•   PTOI was $169 million versus $217 million in the prior year. 2005 included a $48 million gain on the sale
    of photomasks. Higher earnings in electronic materials were offset by higher costs in other product lines.

•   Second quarter sales were $1.0 billion, up 3 percent on higher volumes. Key growth segments include
    photovoltaics, semiconductor fabrication and wire and cable.

Performance Materials

•   PTOI was $193 million versus $190 million in 2005. Higher selling prices, increased volumes and lower
    fixed costs more than offset significantly higher raw material costs, a negative currency impact, and the
    absence of earnings from businesses transferred to The Dow Chemical Company. PTOI margins increased
    to 11.1%.

•   Second quarter sales of $1.7 billion increased 6 percent on a comparable business basis. Sales increased in
    all regions and volume growth was strong in most market segments.

Safety & Protection

•   PTOI was $310 million versus $283 million in the prior year, largely as a result of sales growth across all
    business units while holding fixed costs flat. PTOI margins increased to 21.6%

•   Second quarter sales of $1.4 billion were up 3 percent, reflecting higher USD prices.

•   Demand remained firm across major markets such as construction, electrical, industrial and medical.


                                                         5
Outlook
                For the second half, the company expects to earn about $.91 per share before significant
items. This is nearly double the $.46 per share earned in the second half of last year, which was adversely
affected by hurricanes. The company anticipates that continued pricing strength and new product
introductions, combined with fixed cost control and modest volume growth, will more than offset higher
energy and ingredient costs. The company expects its 2006 reported earnings to be about $2.83 per share.
The company reaffirms its full-year 2006 outlook of about $2.85 per share, excluding significant items of
$.02 per share. This is 22 percent higher than 2005 earnings per share of $2.34.
                “Our first half performance provides more positive momentum for our company,” Holliday
said. “While we expect challenges, we are determined to deliver significantly higher earnings in the second
half compared to last year. We will continue to rapidly advance and commercialize our technology pipelines
and execute our performance improvement initiatives.”


Use of Non-GAAP Measures
                Management believes that measures of income excluding significant items (“non-GAAP”
information) are meaningful to investors because they provide insight with respect to ongoing operating
results of the company. Such measurements are not recognized in accordance with generally accepted
accounting principles (GAAP) and should not be viewed as an alternative to GAAP measures of
performance. Reconciliations of non-GAAP measures to GAAP are provided in Schedule E.
                DuPont is a science company. Founded in 1802, DuPont puts science to work by creating
sustainable solutions essential to a better, safer, healthier life for people everywhere. Operating in more than
70 countries, DuPont offers a wide range of innovative products and services for markets including
agriculture, nutrition, electronics, communications, safety and protection, home and construction,
transportation and protective apparel.


                                                         6
Forward-Looking Statements: This news release contains forward-looking statements based on
management's current expectations, estimates and projections. All statements that address expectations or
projections about the future, including statements about the company's strategy for growth, product
development, market position, expected expenditures and financial results are forward-looking statements.
Some of the forward-looking statements may be identified by words like quot;expects,quot; quot;anticipates,quot; quot;plans,quot;
quot;intends,quot; quot;projects,quot; quot;indicates,quot; and similar expressions. These statements are not guarantees of future
performance and involve a number of risks, uncertainties and assumptions. Many factors, including those
discussed more fully elsewhere in this release and in documents filed with the Securities and Exchange
Commission by DuPont, particularly its latest annual report on Form 10-K and quarterly report on Form 10-
Q, as well as others, could cause results to differ materially from those stated. These factors include, but are
not limited to changes in the laws, regulations, policies and economic conditions, including inflation, interest
and foreign currency exchange rates, of countries in which the company does business; competitive
pressures; successful integration of structural changes, including restructuring plans, acquisitions,
divestitures and alliances; cost of raw materials, research and development of new products, including
regulatory approval and market acceptance; seasonality of sales of agricultural products; and severe weather
events that cause business interruptions, including plant and power outages, or disruptions in supplier and
customer operations.

                                                      ###
7/25/06


                                                         7
E. I. DU PONT DE NEMOURS AND COMPANY AND CONSOLIDATED SUBSIDIARIES

 SCHEDULE A

                                                         Three Months Ended     Six Months Ended
CONSOLIDATED INCOME STATEMENT                                  June 30,              June 30,
(Dollars in millions, except per share)                   2006         2005     2006         2005

NET SALES                                                $7,442     $7,511     $14,836    $14,942
Other Income, Net (a)                                       397        611         667      1,006

Total                                                     7,839      8,122      15,503     15,948

Cost of Goods Sold and Other Operating Charges (b)        5,229      5,220      10,565     10,271
Selling, General and Administrative Expenses                853        866       1,644      1,673
Amortization of Intangible Assets                            56          57        115        114
Research and Development Expense                            328        339         641        652
Interest Expense                                            119        120         233        224
Separation Charges - Textiles & Interiors(c)                  -         (39)         -         (39)

Total                                                     6,585      6,563      13,198     12,895

INCOME BEFORE INCOME TAXES AND
  MINORITY INTERESTS(d)                                   1,254      1,559       2,305      3,053
Provision for Income Taxes (e)                              278        517         510      1,026
Minority Interests in Earnings of Consolidated
  Subsidiaries                                               1          27          3          45

NET INCOME                                               $ 975      $1,015     $ 1,792    $ 1,982

BASIC EARNINGS PER SHARE OF COMMON
 STOCK (f)                                               $ 1.05     $ 1.02     $ 1.94     $ 1.99

DILUTED EARNINGS PER SHARE OF COMMON
 STOCK (f)                                               $ 1.04     $ 1.01     $ 1.92     $ 1.97

DIVIDENDS PER SHARE OF COMMON STOCK                      $ 0.37     $ 0.37     $ 0.74     $ 0.72


                                                     8
NOTES TO CONSOLIDATED INCOME STATEMENT

(a)   Year-to-date 2006 includes a reversal of accrued interest of $7 ($4 after-tax) associated with the favorable
      settlement of certain prior year tax contingencies which had been previously reserved.
      Second quarter 2005 includes a gain of $23 resulting from the disposition of certain assets of DuPont Dow
      Elastomers LLC (DDE) to The Dow Chemical Company, a $28 benefit related to interest on certain prior
      year tax contingencies, and a gain of $48 resulting from the sale of the company's equity interest in
      DuPont Photomasks Inc.
(b) Year-to-date 2006 includes a restructuring charge of $135 ($98 after-tax) in the Coatings & Color
    Technologies segment in connection with the company's plans to close and consolidate certain
    manufacturing and laboratory sites within the segment. The charge consists of employee separation
    charges, primarily in Europe, for approximately 1,300 employees and other exit costs.
      Second quarter 2005 includes a charge of $34 related to the shutdown of an Elastomers manufacturing
      facility in the United States.
(c)   Second quarter 2005 includes a net gain of $39 relating to the disposition of three equity affiliates
      associated with the ongoing separation of Textiles & Interiors, partly offset by other separation costs.
(d) Second quarter 2005 includes $14 of operating income related to certain DDE assets that were disposed of
    on June 30, 2005.
(e)   Second quarter 2006 includes a tax benefit of $31 associated with an increase in the deferred tax assets of
      a European subsidiary for a tax basis investment loss recognized on the local tax return.
      Year-to-date 2006 includes the reversal of $44 of income taxes associated with favorable settlement of
      certain prior-year tax contingencies which had been previously reserved.
      Second quarter 2005 includes a net tax benefit of $24 related to certain prior year tax contingencies
      previously reserved.
(f)   Earnings per share are calculated on the basis of the following average number of common shares
      outstanding:

                                   Three Months Ended                      Six Months Ended
                                         June 30                                June 30
                                 Basic           Diluted                 Basic          Diluted
             2006            922,227,761          931,953,934         921,723,199         930,892,168
             2005            996,025,680        1,002,809,399         996,164,219       1,004,506,893


                                                         9
E. I. DU PONT DE NEMOURS AND COMPANY AND CONSOLIDATED SUBSIDIARIES

SCHEDULE B

SIGNIFICANT ITEMS
(Dollars in millions, except per share)
                                                    Pretax                    After-Tax                   ($ Per Share)
                                            2006             2005          2006       2005              2006          2005
 1st Quarter - Total                       $(128)                  -       $(50)          -          $(.05)               -

 2nd Quarter:
   DDE - Related Items
      Gain on Sale of Assets                                 $ 23                       $ 15
      Operating Income from
       Assets Sold                                             14                         10
      Employee Separation Costs                               (34)                       (23)

          Total                                                   3                       2

   Textiles & Interiors Separation
     Charges                                                      39                      26                         $.03

   Sale of Photomasks Stock                                       48                      31                          .03

   Corporate Tax - Related Items                                  28       $ 31           52         $ .03            .05

 2nd Quarter Total                         $   -             $118          $ 31         $111         $ .03           $.11


SIGNIFICANT ITEMS BY SEGMENT
(Dollars in millions on pretax basis)
                                                              Three Months Ended                  Six Months Ended
                                                                    June 30,                           June 30,
                                                             2006            2005               2006            2005

 Agriculture & Nutrition                                      $        -          $-            $-                  $-
 Coating & Color Technologies                                          -           -            (135)                 -
 Electronic & Communication Technologies                               -          48               -                48
 Performance Materials                                                 -           3               -                  3
 Safety & Protection                                                   -           -               -                  -
 Textiles & Interiors                                                  -           -               -                  -
 Other                                                                 -          39               -                 39

   Total (excluding Corporate)                                $        -          $90           $(135)              $90


See Notes to Consolidated Income Statement for additional details.


                                                              10
E. I. DU PONT DE NEMOURS AND COMPANY AND CONSOLIDATED SUBSIDIARIES

SCHEDULE C

                                                         Three Months Ended          Six Months Ended
CONSOLIDATED SEGMENT INFORMATION (1)                           June 30,                   June 30,
(Dollars in millions)                                     2006          2005         2006         2005

SALES (2)
Agriculture & Nutrition                                  $2,021       $2,102       $ 4,267       $ 4,458
Coatings & Color Technologies                             1,630        1,601         3,112         3,105
Electronic & Communication Technologies                   1,006          972         1,948         1,858
Performance Materials                                     1,735        1,836         3,450         3,621
Safety & Protection                                       1,435        1,388         2,818         2,670
Other                                                         16          13            29            25
Elimination of Transfers                                     (77)        (82)         (167)         (160)
Elimination of Equity Affiliate Sales                      (324)        (319)         (621)         (635)

  CONSOLIDATED NET SALES                                 $7,442       $7,511       $14,836       $14,942

PRETAX OPERATING INCOME (LOSS) (PTOI)(3)
Agriculture & Nutrition                                  $ 428        $ 511        $ 1,016       $ 1,268
Coatings & Color Technologies (b)                          222          188            237           349
Electronic & Communication Technologies(a)                 169          217            332           327
Performance Materials(a)(b)(d)                             193          190            330           401
Pharmaceuticals                                            200          192            369           351
Safety & Protection                                        310          283            579           514
Other(c)                                                    (30)          7             (56)          (14)

  Total Segment PTOI                                      1,492        1,588       $ 2,807         3,196

Exchange Gains and Losses (4)                                26          183              8          294
Corporate Expenses & Net Interest                          (264)        (212)          (510)        (437)

  INCOME BEFORE INCOME TAXES AND
    MINORITY INTERESTS                                   $1,254       $1,559       $ 2,305       $ 3,053


 (1)   Certain reclassifications of segment data have been made to reflect changes in organizational
       structure.
 (2)   Sales for the reporting segments include transfers and a pro rata share of equity affiliate sales.
 (3)   Refer to the Notes to Consolidated Income Statement for additional information on significant
       items included in the reported results.
 (4)   Net after-tax exchange activity for second quarter 2006 and 2005 were a gain of $10 and a loss of
       $10, respectively. Gains and losses resulting from the company's hedging program are largely
       offset by associated tax effects.


                                                   11
E. I. DU PONT DE NEMOURS AND COMPANY AND CONSOLIDATED SUBSIDIARIES

SCHEDULE D

SELECTED INCOME STATEMENT DATA
(Dollars in millions, except per share)

                                         Three Months Ended                      Six Months Ended
                                               June 30                                June 30
                                      2006      2005     % Chg.             2006       2005       % Chg.

Consolidated Net Sales                $7,442   $7,511            (1)%     $14,836    $14,942       (1)%
Segment Sales                          7,843    7,912            (1)       15,624     15,737       (1)
Segment PTOI                           1,492    1,588            (6)        2,807      3,196      (12)
Adjusted EBIT*                         1,363    1,610           (15)        2,507      3,153      (20)
Adjusted EBITDA*                       1,696    1,935           (12)        3,177      3,810      (17)
Income Before Income Taxes
  and Minority Interests               1,254    1,559           (20)        2,305      3,053      (25)
EPS - Diluted                           1.04     1.01             3          1.92       1.97       (3)

* See Reconciliation of Non-GAAP measures (Schedule E).


SCHEDULE E

RECONCILIATION OF NON-GAAP MEASURES
(Dollars in millions)

Reconciliation of Adjusted EBIT / Adjusted EBITDA to Consolidated Income Statement
                                                     Three Months Ended               Six Months Ended
                                                           June 30,                        June 30,
                                                     2006           2005             2006           2005

Income Before Income Taxes and
  Minority Interests                                $1,254              $1,559      $2,305        $3,053

Less: Minority Interest in Earnings
 of Consolidated Subsidiaries (1)                           (1)            (31)        (3)          (54)
Add: Net Interest Expense (2)                             110               82        205           154

Adjusted EBIT                                           1,363            1,610       2,507         3,153

Add: Depreciation and Amortization (3)                    333             325         670           657

Adjusted EBITDA                                     $1,696              $1,935      $3,177        $3,810

(1)   Excludes income taxes.
(2)   Includes interest expense plus amortization of capitalized interest less interest income.
(3)   Excludes amortization of capitalized interest.


                                                     12
E. I. DU PONT DE NEMOURS AND COMPANY AND CONSOLIDATED SUBSIDIARIES

SCHEDULE E -- (Continued)

Reconciliation of Earnings Per Share (EPS)
                                                   Three Months Ended              Six Months Ended
                                                         June 30,                       June 30,
                                                   2006           2005            2006           2005
Earnings Per Share before Significant Items        $1.01        $ .90            $1.94         $1.86
Significant Items included in EPS                    .03          .11              (.02)         .11
Reported EPS                                       $1.04        $1.01            $1.92         $1.97


Reconciliation of Earnings Per Share (EPS) Outlook
                                                                       Year Ended December 31,
                                                                     2006                  2005
                                                                    Outlook               Actual
Earnings Per Share before Significant Items
Significant Items included in EPS:                                   $2.85                    $2.34
  Coatings & Color Technologies - Restructuring Charges               (.10)                        -
  American Jobs Creation Act                                             -                     (.29)
  Hurricane Charges                                                      -                     (.09)
  Textiles & Interiors - Separation Charges                              -                       .03
  Sale of Photomasks Stock                                               -                       .03
  Corporate Tax-Related Items                                          .08                       .05
Net Charge for Significant Items                                         (.02)                 (.27)
Reported EPS                                                         $2.83                    $2.07


                                                   13
E. I. DU PONT DE NEMOURS AND COMPANY AND CONSOLIDATED SUBSIDIARIES

SCHEDULE E -- (Continued)

Reconciliation of Base Income Tax Rate to Effective Income Tax Rate
                                                      Three Months Ended            Six Months Ended
                                                            June 30,                     June 30,
                                                      2006           2005          2006           2005
Income Before Income Taxes and
  Minority Interests                                 $1,254       $1,559         $2,305         $3,053
Remove: Significant Items - Charge/(Benefit)                 -      (118)           128           (118)
        Net Exchange Gains                                 (26)     (183)             (8)         (294)
Income Before Income Taxes, Significant
  Items, Exchange Gains and Minority
  Interests                                          $1,228       $1,258         $2,425         $2,641
Provision for Income Taxes                           $ 278        $ 517          $ 510          $1,026
Remove: (Expense)/Benefit
 Tax on Significant Items                                   31        (7)           109             (7)
 Tax on Exchange Gains                                     (16)     (193)            (20)         (342)
Provision for Income Taxes, Excluding
  Taxes on Significant Items and Exchange
  Gains                                              $ 293        $ 317          $ 599          $ 677
Effective Income Tax Rate                              22.2%        33.2%           22.1%         33.6%
Base Income Tax Rate                                   23.8%        25.2%           24.7%         25.6%

Reconciliation of Fixed Cost as a Percent of Sales
                                                      Three Months Ended            Six Months Ended
                                                            June 30,                     June 30,
                                                      2006           2005          2006           2005
Total Charges and Expenses - Consolidated            $6,585       $6,563         $13,198       $12,895
Income Statement
Remove:
  Interest Expense                                      119          120             233            224
  Fixed Cost - Textiles & Interiors                       -             8              -             18
  Separation Charges - Textiles & Interiors               -           (39)             -            (39)
  Variable Costs (1)                                  3,507        3,401           6,943          6,646
  Significant Items - Charge (2)                          -            34            135             34
      Fixed Cost                                     $2,959       $3,039         $ 5,887       $ 6,012
Consolidated Net Sales                               $7,442       $7,511         $14,836       $14,942
Fixed Costs as a Percent of Sales                      39.8%        40.5%           39.7%          40.2%

(1)     Includes variable manufacturing costs, freight, commissions and other selling expenses which vary with
        the volume of sales.
(2)     See Schedule B for detail of significant items.


                                                      14

More Related Content

What's hot

du pont Earnings Release2007 4th
du pont Earnings Release2007 4thdu pont Earnings Release2007 4th
du pont Earnings Release2007 4thfinance9
 
du pont Earnings Release2005 4th
du pont Earnings Release2005 4thdu pont Earnings Release2005 4th
du pont Earnings Release2005 4thfinance9
 
du pont Earnings Release 2005 3rd
du pont Earnings Release 2005 3rddu pont Earnings Release 2005 3rd
du pont Earnings Release 2005 3rdfinance9
 
Duke Energy 3Q 05_Slides2
Duke Energy 3Q 05_Slides2Duke Energy 3Q 05_Slides2
Duke Energy 3Q 05_Slides2finance21
 
dte_020730q1
dte_020730q1dte_020730q1
dte_020730q1finance41
 
u.s.bancorp 1Q 2005 Earnings Release
u.s.bancorp 1Q 2005 Earnings Release  u.s.bancorp 1Q 2005 Earnings Release
u.s.bancorp 1Q 2005 Earnings Release finance13
 
u.s.bancorp 1Q 2007 Earnings Release
u.s.bancorp 1Q 2007 Earnings Release u.s.bancorp 1Q 2007 Earnings Release
u.s.bancorp 1Q 2007 Earnings Release finance13
 
u.s.bancorp 4Q 2005 Earnings Release - pdf version
 u.s.bancorp 4Q 2005 Earnings Release - pdf version u.s.bancorp 4Q 2005 Earnings Release - pdf version
u.s.bancorp 4Q 2005 Earnings Release - pdf versionfinance13
 
RYDER3Q08Earnings_final
RYDER3Q08Earnings_finalRYDER3Q08Earnings_final
RYDER3Q08Earnings_finalfinance44
 
u.s.bancorp4Q 2003 Earnings Release and Supplemental Analyst Schedules
u.s.bancorp4Q 2003 Earnings Release and Supplemental Analyst Schedules u.s.bancorp4Q 2003 Earnings Release and Supplemental Analyst Schedules
u.s.bancorp4Q 2003 Earnings Release and Supplemental Analyst Schedules finance13
 
progress energy 2Q 02earnings release Final
progress energy 2Q 02earnings release Finalprogress energy 2Q 02earnings release Final
progress energy 2Q 02earnings release Finalfinance25
 
u.s.bancorp3Q 2004 Earnings Release
u.s.bancorp3Q 2004 Earnings Release  u.s.bancorp3Q 2004 Earnings Release
u.s.bancorp3Q 2004 Earnings Release finance13
 
Fourth Quarter 2011 Masco Earnings Presentation
Fourth Quarter 2011 Masco Earnings PresentationFourth Quarter 2011 Masco Earnings Presentation
Fourth Quarter 2011 Masco Earnings PresentationMasco_Investors
 
atmos enerrgy 4/08_slidePres
atmos enerrgy 4/08_slidePresatmos enerrgy 4/08_slidePres
atmos enerrgy 4/08_slidePresfinance35
 
celanese mr_q1_2005_e
celanese mr_q1_2005_ecelanese mr_q1_2005_e
celanese mr_q1_2005_efinance44
 
Ryder3Q07Final
Ryder3Q07FinalRyder3Q07Final
Ryder3Q07Finalfinance44
 

What's hot (16)

du pont Earnings Release2007 4th
du pont Earnings Release2007 4thdu pont Earnings Release2007 4th
du pont Earnings Release2007 4th
 
du pont Earnings Release2005 4th
du pont Earnings Release2005 4thdu pont Earnings Release2005 4th
du pont Earnings Release2005 4th
 
du pont Earnings Release 2005 3rd
du pont Earnings Release 2005 3rddu pont Earnings Release 2005 3rd
du pont Earnings Release 2005 3rd
 
Duke Energy 3Q 05_Slides2
Duke Energy 3Q 05_Slides2Duke Energy 3Q 05_Slides2
Duke Energy 3Q 05_Slides2
 
dte_020730q1
dte_020730q1dte_020730q1
dte_020730q1
 
u.s.bancorp 1Q 2005 Earnings Release
u.s.bancorp 1Q 2005 Earnings Release  u.s.bancorp 1Q 2005 Earnings Release
u.s.bancorp 1Q 2005 Earnings Release
 
u.s.bancorp 1Q 2007 Earnings Release
u.s.bancorp 1Q 2007 Earnings Release u.s.bancorp 1Q 2007 Earnings Release
u.s.bancorp 1Q 2007 Earnings Release
 
u.s.bancorp 4Q 2005 Earnings Release - pdf version
 u.s.bancorp 4Q 2005 Earnings Release - pdf version u.s.bancorp 4Q 2005 Earnings Release - pdf version
u.s.bancorp 4Q 2005 Earnings Release - pdf version
 
RYDER3Q08Earnings_final
RYDER3Q08Earnings_finalRYDER3Q08Earnings_final
RYDER3Q08Earnings_final
 
u.s.bancorp4Q 2003 Earnings Release and Supplemental Analyst Schedules
u.s.bancorp4Q 2003 Earnings Release and Supplemental Analyst Schedules u.s.bancorp4Q 2003 Earnings Release and Supplemental Analyst Schedules
u.s.bancorp4Q 2003 Earnings Release and Supplemental Analyst Schedules
 
progress energy 2Q 02earnings release Final
progress energy 2Q 02earnings release Finalprogress energy 2Q 02earnings release Final
progress energy 2Q 02earnings release Final
 
u.s.bancorp3Q 2004 Earnings Release
u.s.bancorp3Q 2004 Earnings Release  u.s.bancorp3Q 2004 Earnings Release
u.s.bancorp3Q 2004 Earnings Release
 
Fourth Quarter 2011 Masco Earnings Presentation
Fourth Quarter 2011 Masco Earnings PresentationFourth Quarter 2011 Masco Earnings Presentation
Fourth Quarter 2011 Masco Earnings Presentation
 
atmos enerrgy 4/08_slidePres
atmos enerrgy 4/08_slidePresatmos enerrgy 4/08_slidePres
atmos enerrgy 4/08_slidePres
 
celanese mr_q1_2005_e
celanese mr_q1_2005_ecelanese mr_q1_2005_e
celanese mr_q1_2005_e
 
Ryder3Q07Final
Ryder3Q07FinalRyder3Q07Final
Ryder3Q07Final
 

Viewers also liked

TESTIMONIAL for Paul Gregory
TESTIMONIAL for Paul GregoryTESTIMONIAL for Paul Gregory
TESTIMONIAL for Paul GregoryPaul Gregory
 
Prácticum en anestesia y reanimación
Prácticum en anestesia y reanimaciónPrácticum en anestesia y reanimación
Prácticum en anestesia y reanimación
CenproexFormacion
 
Samantha Sunstrom Letter of Recommendation
Samantha Sunstrom Letter of RecommendationSamantha Sunstrom Letter of Recommendation
Samantha Sunstrom Letter of RecommendationSamantha Sunstrom
 
Segundo (medida de tempo)
Segundo (medida de tempo)Segundo (medida de tempo)
Segundo (medida de tempo)Prof. Materaldo
 
Plan070208
Plan070208Plan070208
Plan070208Sean Yeh
 
What is Personal Injury? Learn About Personal Injury Cases
What is Personal Injury? Learn About Personal Injury CasesWhat is Personal Injury? Learn About Personal Injury Cases
What is Personal Injury? Learn About Personal Injury Cases
WilsonZack
 
Knivsta IK F04-03 - Föräldramöte 16/10 -16
Knivsta IK F04-03 - Föräldramöte 16/10 -16Knivsta IK F04-03 - Föräldramöte 16/10 -16
Knivsta IK F04-03 - Föräldramöte 16/10 -16
jenslindquist
 
coca cola Reconciliation of Q2 and YTD 2008 Non-GAAP Financial Measures
coca cola  	Reconciliation of Q2 and YTD 2008 Non-GAAP Financial Measurescoca cola  	Reconciliation of Q2 and YTD 2008 Non-GAAP Financial Measures
coca cola Reconciliation of Q2 and YTD 2008 Non-GAAP Financial Measuresfinance9
 
Applications of ABA in clinical settings
Applications of ABA in clinical settingsApplications of ABA in clinical settings
Applications of ABA in clinical settings
Center for Cognitive and Behavioral Therapy of Greater Columbus
 
Lição 7 - As Bodas do Cordeiro
Lição 7 - As Bodas do CordeiroLição 7 - As Bodas do Cordeiro
Lição 7 - As Bodas do Cordeiro
Andrew Guimarães
 
(1) linear and linear momentum
(1) linear and linear momentum(1) linear and linear momentum
(1) linear and linear momentumphysics101
 
시알리스 구입방법 카톡:DDF11 & DDF11.KR 시알리스 50mg정품구입,시알리스 100mg정품판매,시알리스 100mg정품구입,시알리...
시알리스 구입방법 카톡:DDF11 & DDF11.KR 시알리스 50mg정품구입,시알리스 100mg정품판매,시알리스 100mg정품구입,시알리...시알리스 구입방법 카톡:DDF11 & DDF11.KR 시알리스 50mg정품구입,시알리스 100mg정품판매,시알리스 100mg정품구입,시알리...
시알리스 구입방법 카톡:DDF11 & DDF11.KR 시알리스 50mg정품구입,시알리스 100mg정품판매,시알리스 100mg정품구입,시알리...
bark man
 

Viewers also liked (15)

TESTIMONIAL for Paul Gregory
TESTIMONIAL for Paul GregoryTESTIMONIAL for Paul Gregory
TESTIMONIAL for Paul Gregory
 
Prácticum en anestesia y reanimación
Prácticum en anestesia y reanimaciónPrácticum en anestesia y reanimación
Prácticum en anestesia y reanimación
 
Samantha Sunstrom Letter of Recommendation
Samantha Sunstrom Letter of RecommendationSamantha Sunstrom Letter of Recommendation
Samantha Sunstrom Letter of Recommendation
 
Vishwa_Resume
Vishwa_ResumeVishwa_Resume
Vishwa_Resume
 
AAFundamentals
AAFundamentalsAAFundamentals
AAFundamentals
 
Segundo (medida de tempo)
Segundo (medida de tempo)Segundo (medida de tempo)
Segundo (medida de tempo)
 
Plan070208
Plan070208Plan070208
Plan070208
 
What is Personal Injury? Learn About Personal Injury Cases
What is Personal Injury? Learn About Personal Injury CasesWhat is Personal Injury? Learn About Personal Injury Cases
What is Personal Injury? Learn About Personal Injury Cases
 
Knivsta IK F04-03 - Föräldramöte 16/10 -16
Knivsta IK F04-03 - Föräldramöte 16/10 -16Knivsta IK F04-03 - Föräldramöte 16/10 -16
Knivsta IK F04-03 - Föräldramöte 16/10 -16
 
coca cola Reconciliation of Q2 and YTD 2008 Non-GAAP Financial Measures
coca cola  	Reconciliation of Q2 and YTD 2008 Non-GAAP Financial Measurescoca cola  	Reconciliation of Q2 and YTD 2008 Non-GAAP Financial Measures
coca cola Reconciliation of Q2 and YTD 2008 Non-GAAP Financial Measures
 
Applications of ABA in clinical settings
Applications of ABA in clinical settingsApplications of ABA in clinical settings
Applications of ABA in clinical settings
 
DC-4
DC-4DC-4
DC-4
 
Lição 7 - As Bodas do Cordeiro
Lição 7 - As Bodas do CordeiroLição 7 - As Bodas do Cordeiro
Lição 7 - As Bodas do Cordeiro
 
(1) linear and linear momentum
(1) linear and linear momentum(1) linear and linear momentum
(1) linear and linear momentum
 
시알리스 구입방법 카톡:DDF11 & DDF11.KR 시알리스 50mg정품구입,시알리스 100mg정품판매,시알리스 100mg정품구입,시알리...
시알리스 구입방법 카톡:DDF11 & DDF11.KR 시알리스 50mg정품구입,시알리스 100mg정품판매,시알리스 100mg정품구입,시알리...시알리스 구입방법 카톡:DDF11 & DDF11.KR 시알리스 50mg정품구입,시알리스 100mg정품판매,시알리스 100mg정품구입,시알리...
시알리스 구입방법 카톡:DDF11 & DDF11.KR 시알리스 50mg정품구입,시알리스 100mg정품판매,시알리스 100mg정품구입,시알리...
 

Similar to du pont Earnings Release2006 2nd

Q1 2009 Earning Report of Du Pont E I De Nemours
Q1 2009 Earning Report of Du Pont E I De NemoursQ1 2009 Earning Report of Du Pont E I De Nemours
Q1 2009 Earning Report of Du Pont E I De Nemoursguestc4fcf72
 
Q1 2009 Earning Report of Du Pont E I De Nemours
Q1 2009 Earning Report of Du Pont E I De NemoursQ1 2009 Earning Report of Du Pont E I De Nemours
Q1 2009 Earning Report of Du Pont E I De Nemoursearningreport earningreport
 
3Q 06 Earnings Slides
3Q 06 Earnings Slides3Q 06 Earnings Slides
3Q 06 Earnings Slidesfinance22
 
LEAR 2005 earnings presentation q2
 LEAR  2005 earnings presentation q2 LEAR  2005 earnings presentation q2
LEAR 2005 earnings presentation q2finance16
 
goodrich 1Q05_Slides
goodrich  1Q05_Slidesgoodrich  1Q05_Slides
goodrich 1Q05_Slidesfinance44
 
goodrich 1Q05_Slides
goodrich  1Q05_Slidesgoodrich  1Q05_Slides
goodrich 1Q05_Slidesfinance44
 
LEAR Q 106 earnings
LEAR Q 106 earningsLEAR Q 106 earnings
LEAR Q 106 earningsfinance16
 
first energy 3Q 06
first energy 3Q 06first energy 3Q 06
first energy 3Q 06finance21
 
first energy 3Q 06
first energy 3Q 06first energy 3Q 06
first energy 3Q 06finance21
 
Duke Energy 3Q/05
Duke Energy 3Q/05Duke Energy 3Q/05
Duke Energy 3Q/05finance21
 
atmos enerrgy _1qslides
atmos enerrgy _1qslidesatmos enerrgy _1qslides
atmos enerrgy _1qslidesfinance35
 
3m Presentation 2006 1st
3m Presentation 2006 1st3m Presentation 2006 1st
3m Presentation 2006 1stfinance10
 
LEAR Q3 06 earnings
LEAR Q3 06 earningsLEAR Q3 06 earnings
LEAR Q3 06 earningsfinance16
 
du pont 4Q08 Press Release
du pont 	 4Q08 Press Releasedu pont 	 4Q08 Press Release
du pont 4Q08 Press Releasefinance9
 
goodrich YE4Q04ERSlidesBW
goodrich  YE4Q04ERSlidesBWgoodrich  YE4Q04ERSlidesBW
goodrich YE4Q04ERSlidesBWfinance44
 
goodrich E4Q04ERSlidesBW
 goodrich  E4Q04ERSlidesBW goodrich  E4Q04ERSlidesBW
goodrich E4Q04ERSlidesBWfinance44
 
ConAgra Q4Jun05
ConAgra Q4Jun05ConAgra Q4Jun05
ConAgra Q4Jun05finance21
 

Similar to du pont Earnings Release2006 2nd (20)

Q1 2009 Earning Report of Du Pont E I De Nemours
Q1 2009 Earning Report of Du Pont E I De NemoursQ1 2009 Earning Report of Du Pont E I De Nemours
Q1 2009 Earning Report of Du Pont E I De Nemours
 
Q1 2009 Earning Report of Du Pont E I De Nemours
Q1 2009 Earning Report of Du Pont E I De NemoursQ1 2009 Earning Report of Du Pont E I De Nemours
Q1 2009 Earning Report of Du Pont E I De Nemours
 
LEAR Q2 06
LEAR Q2 06LEAR Q2 06
LEAR Q2 06
 
3Q 06 Earnings Slides
3Q 06 Earnings Slides3Q 06 Earnings Slides
3Q 06 Earnings Slides
 
LEAR 2005 earnings presentation q2
 LEAR  2005 earnings presentation q2 LEAR  2005 earnings presentation q2
LEAR 2005 earnings presentation q2
 
goodrich 1Q05_Slides
goodrich  1Q05_Slidesgoodrich  1Q05_Slides
goodrich 1Q05_Slides
 
goodrich 1Q05_Slides
goodrich  1Q05_Slidesgoodrich  1Q05_Slides
goodrich 1Q05_Slides
 
LEAR Q 106 earnings
LEAR Q 106 earningsLEAR Q 106 earnings
LEAR Q 106 earnings
 
first energy 3Q 06
first energy 3Q 06first energy 3Q 06
first energy 3Q 06
 
first energy 3Q 06
first energy 3Q 06first energy 3Q 06
first energy 3Q 06
 
Duke Energy 3Q/05
Duke Energy 3Q/05Duke Energy 3Q/05
Duke Energy 3Q/05
 
atmos enerrgy _1qslides
atmos enerrgy _1qslidesatmos enerrgy _1qslides
atmos enerrgy _1qslides
 
3m Presentation 2006 1st
3m Presentation 2006 1st3m Presentation 2006 1st
3m Presentation 2006 1st
 
LEAR Q3 06 earnings
LEAR Q3 06 earningsLEAR Q3 06 earnings
LEAR Q3 06 earnings
 
3Q05FINAL
3Q05FINAL3Q05FINAL
3Q05FINAL
 
3Q05FINAL
3Q05FINAL3Q05FINAL
3Q05FINAL
 
du pont 4Q08 Press Release
du pont 	 4Q08 Press Releasedu pont 	 4Q08 Press Release
du pont 4Q08 Press Release
 
goodrich YE4Q04ERSlidesBW
goodrich  YE4Q04ERSlidesBWgoodrich  YE4Q04ERSlidesBW
goodrich YE4Q04ERSlidesBW
 
goodrich E4Q04ERSlidesBW
 goodrich  E4Q04ERSlidesBW goodrich  E4Q04ERSlidesBW
goodrich E4Q04ERSlidesBW
 
ConAgra Q4Jun05
ConAgra Q4Jun05ConAgra Q4Jun05
ConAgra Q4Jun05
 

More from finance9

enterprise gp holdings Organizational and Ownership Structure Chart
enterprise gp holdings  Organizational and Ownership Structure Chart enterprise gp holdings  Organizational and Ownership Structure Chart
enterprise gp holdings Organizational and Ownership Structure Chart finance9
 
enterprise gp holdings Standards of Business Conduct
enterprise gp holdings Standards of Business Conductenterprise gp holdings Standards of Business Conduct
enterprise gp holdings Standards of Business Conductfinance9
 
enterprise gp holdings Governance Guidelines
enterprise gp holdings Governance Guidelinesenterprise gp holdings Governance Guidelines
enterprise gp holdings Governance Guidelinesfinance9
 
enterprise gp holdings Audit, Conflicts & Governance Committee
enterprise gp holdings Audit, Conflicts & Governance Committeeenterprise gp holdings Audit, Conflicts & Governance Committee
enterprise gp holdings Audit, Conflicts & Governance Committeefinance9
 
enterprise gp holdings Code of Conduct & Related Policies
enterprise gp holdings Code of Conduct & Related Policiesenterprise gp holdings Code of Conduct & Related Policies
enterprise gp holdings Code of Conduct & Related Policiesfinance9
 
02/11/09 HCA Announces Offering of $300 Million Senior Secured Second Lien Notes
02/11/09 HCA Announces Offering of $300 Million Senior Secured Second Lien Notes02/11/09 HCA Announces Offering of $300 Million Senior Secured Second Lien Notes
02/11/09 HCA Announces Offering of $300 Million Senior Secured Second Lien Notesfinance9
 
hca annual reports2000
hca annual reports2000hca annual reports2000
hca annual reports2000finance9
 
hca annual reports2001
hca annual reports2001hca annual reports2001
hca annual reports2001finance9
 
hca annual reports2002
hca annual reports2002hca annual reports2002
hca annual reports2002finance9
 
hca annual reports2003
hca annual reports2003hca annual reports2003
hca annual reports2003finance9
 
hca annual reports2004
hca annual reports2004hca annual reports2004
hca annual reports2004finance9
 
hca annual reports2005
hca annual reports2005hca annual reports2005
hca annual reports2005finance9
 
JP Morgan Presentation 15-Feb-2008
JP Morgan Presentation 15-Feb-2008JP Morgan Presentation 15-Feb-2008
JP Morgan Presentation 15-Feb-2008finance9
 
HCA Presents at Bank of America 2008 Credit Conference 20-Nov-2008
HCA Presents at Bank of America 2008 Credit Conference 20-Nov-2008HCA Presents at Bank of America 2008 Credit Conference 20-Nov-2008
HCA Presents at Bank of America 2008 Credit Conference 20-Nov-2008finance9
 
tyson foods 2007 Sustainability Report
tyson foods  2007 Sustainability Report tyson foods  2007 Sustainability Report
tyson foods 2007 Sustainability Report finance9
 
tyson foods Investor Fact Book
tyson foods Investor Fact Book tyson foods Investor Fact Book
tyson foods Investor Fact Book finance9
 
tyson foods 2008 Annual Report
tyson foods  2008 Annual Report tyson foods  2008 Annual Report
tyson foods 2008 Annual Report finance9
 
general dynamics 2008 Proxy Statement
general dynamics 2008 Proxy Statement	 general dynamics 2008 Proxy Statement
general dynamics 2008 Proxy Statement finance9
 
general dynamics 2007 Annual Report
general dynamics 2007 Annual Report	general dynamics 2007 Annual Report
general dynamics 2007 Annual Report finance9
 
general dynamics Restated Certificate of Incorporation
general dynamics Restated Certificate of Incorporation general dynamics Restated Certificate of Incorporation
general dynamics Restated Certificate of Incorporation finance9
 

More from finance9 (20)

enterprise gp holdings Organizational and Ownership Structure Chart
enterprise gp holdings  Organizational and Ownership Structure Chart enterprise gp holdings  Organizational and Ownership Structure Chart
enterprise gp holdings Organizational and Ownership Structure Chart
 
enterprise gp holdings Standards of Business Conduct
enterprise gp holdings Standards of Business Conductenterprise gp holdings Standards of Business Conduct
enterprise gp holdings Standards of Business Conduct
 
enterprise gp holdings Governance Guidelines
enterprise gp holdings Governance Guidelinesenterprise gp holdings Governance Guidelines
enterprise gp holdings Governance Guidelines
 
enterprise gp holdings Audit, Conflicts & Governance Committee
enterprise gp holdings Audit, Conflicts & Governance Committeeenterprise gp holdings Audit, Conflicts & Governance Committee
enterprise gp holdings Audit, Conflicts & Governance Committee
 
enterprise gp holdings Code of Conduct & Related Policies
enterprise gp holdings Code of Conduct & Related Policiesenterprise gp holdings Code of Conduct & Related Policies
enterprise gp holdings Code of Conduct & Related Policies
 
02/11/09 HCA Announces Offering of $300 Million Senior Secured Second Lien Notes
02/11/09 HCA Announces Offering of $300 Million Senior Secured Second Lien Notes02/11/09 HCA Announces Offering of $300 Million Senior Secured Second Lien Notes
02/11/09 HCA Announces Offering of $300 Million Senior Secured Second Lien Notes
 
hca annual reports2000
hca annual reports2000hca annual reports2000
hca annual reports2000
 
hca annual reports2001
hca annual reports2001hca annual reports2001
hca annual reports2001
 
hca annual reports2002
hca annual reports2002hca annual reports2002
hca annual reports2002
 
hca annual reports2003
hca annual reports2003hca annual reports2003
hca annual reports2003
 
hca annual reports2004
hca annual reports2004hca annual reports2004
hca annual reports2004
 
hca annual reports2005
hca annual reports2005hca annual reports2005
hca annual reports2005
 
JP Morgan Presentation 15-Feb-2008
JP Morgan Presentation 15-Feb-2008JP Morgan Presentation 15-Feb-2008
JP Morgan Presentation 15-Feb-2008
 
HCA Presents at Bank of America 2008 Credit Conference 20-Nov-2008
HCA Presents at Bank of America 2008 Credit Conference 20-Nov-2008HCA Presents at Bank of America 2008 Credit Conference 20-Nov-2008
HCA Presents at Bank of America 2008 Credit Conference 20-Nov-2008
 
tyson foods 2007 Sustainability Report
tyson foods  2007 Sustainability Report tyson foods  2007 Sustainability Report
tyson foods 2007 Sustainability Report
 
tyson foods Investor Fact Book
tyson foods Investor Fact Book tyson foods Investor Fact Book
tyson foods Investor Fact Book
 
tyson foods 2008 Annual Report
tyson foods  2008 Annual Report tyson foods  2008 Annual Report
tyson foods 2008 Annual Report
 
general dynamics 2008 Proxy Statement
general dynamics 2008 Proxy Statement	 general dynamics 2008 Proxy Statement
general dynamics 2008 Proxy Statement
 
general dynamics 2007 Annual Report
general dynamics 2007 Annual Report	general dynamics 2007 Annual Report
general dynamics 2007 Annual Report
 
general dynamics Restated Certificate of Incorporation
general dynamics Restated Certificate of Incorporation general dynamics Restated Certificate of Incorporation
general dynamics Restated Certificate of Incorporation
 

Recently uploaded

how to sell pi coins on Binance exchange
how to sell pi coins on Binance exchangehow to sell pi coins on Binance exchange
how to sell pi coins on Binance exchange
DOT TECH
 
innovative-invoice-discounting-platforms-in-india-empowering-retail-investors...
innovative-invoice-discounting-platforms-in-india-empowering-retail-investors...innovative-invoice-discounting-platforms-in-india-empowering-retail-investors...
innovative-invoice-discounting-platforms-in-india-empowering-retail-investors...
Falcon Invoice Discounting
 
how can i use my minded pi coins I need some funds.
how can i use my minded pi coins I need some funds.how can i use my minded pi coins I need some funds.
how can i use my minded pi coins I need some funds.
DOT TECH
 
BYD SWOT Analysis and In-Depth Insights 2024.pptx
BYD SWOT Analysis and In-Depth Insights 2024.pptxBYD SWOT Analysis and In-Depth Insights 2024.pptx
BYD SWOT Analysis and In-Depth Insights 2024.pptx
mikemetalprod
 
what is a pi whale and how to access one.
what is a pi whale and how to access one.what is a pi whale and how to access one.
what is a pi whale and how to access one.
DOT TECH
 
GeM ppt in railway for presentation on gem
GeM ppt in railway  for presentation on gemGeM ppt in railway  for presentation on gem
GeM ppt in railway for presentation on gem
CwierAsn
 
The WhatsPump Pseudonym Problem and the Hilarious Downfall of Artificial Enga...
The WhatsPump Pseudonym Problem and the Hilarious Downfall of Artificial Enga...The WhatsPump Pseudonym Problem and the Hilarious Downfall of Artificial Enga...
The WhatsPump Pseudonym Problem and the Hilarious Downfall of Artificial Enga...
muslimdavidovich670
 
Poonawalla Fincorp and IndusInd Bank Introduce New Co-Branded Credit Card
Poonawalla Fincorp and IndusInd Bank Introduce New Co-Branded Credit CardPoonawalla Fincorp and IndusInd Bank Introduce New Co-Branded Credit Card
Poonawalla Fincorp and IndusInd Bank Introduce New Co-Branded Credit Card
nickysharmasucks
 
Financial Assets: Debit vs Equity Securities.pptx
Financial Assets: Debit vs Equity Securities.pptxFinancial Assets: Debit vs Equity Securities.pptx
Financial Assets: Debit vs Equity Securities.pptx
Writo-Finance
 
where can I find a legit pi merchant online
where can I find a legit pi merchant onlinewhere can I find a legit pi merchant online
where can I find a legit pi merchant online
DOT TECH
 
Introduction to Indian Financial System ()
Introduction to Indian Financial System ()Introduction to Indian Financial System ()
Introduction to Indian Financial System ()
Avanish Goel
 
how can I sell/buy bulk pi coins securely
how can I sell/buy bulk pi coins securelyhow can I sell/buy bulk pi coins securely
how can I sell/buy bulk pi coins securely
DOT TECH
 
The European Unemployment Puzzle: implications from population aging
The European Unemployment Puzzle: implications from population agingThe European Unemployment Puzzle: implications from population aging
The European Unemployment Puzzle: implications from population aging
GRAPE
 
一比一原版BCU毕业证伯明翰城市大学毕业证成绩单如何办理
一比一原版BCU毕业证伯明翰城市大学毕业证成绩单如何办理一比一原版BCU毕业证伯明翰城市大学毕业证成绩单如何办理
一比一原版BCU毕业证伯明翰城市大学毕业证成绩单如何办理
ydubwyt
 
Introduction to Value Added Tax System.ppt
Introduction to Value Added Tax System.pptIntroduction to Value Added Tax System.ppt
Introduction to Value Added Tax System.ppt
VishnuVenugopal84
 
Scope Of Macroeconomics introduction and basic theories
Scope Of Macroeconomics introduction and basic theoriesScope Of Macroeconomics introduction and basic theories
Scope Of Macroeconomics introduction and basic theories
nomankalyar153
 
managementaccountingunitiv-230422140105-dd17d80b.ppt
managementaccountingunitiv-230422140105-dd17d80b.pptmanagementaccountingunitiv-230422140105-dd17d80b.ppt
managementaccountingunitiv-230422140105-dd17d80b.ppt
SuseelaPalanimuthu
 
This assessment plan proposal is to outline a structured approach to evaluati...
This assessment plan proposal is to outline a structured approach to evaluati...This assessment plan proposal is to outline a structured approach to evaluati...
This assessment plan proposal is to outline a structured approach to evaluati...
lamluanvan.net Viết thuê luận văn
 
what is the best method to sell pi coins in 2024
what is the best method to sell pi coins in 2024what is the best method to sell pi coins in 2024
what is the best method to sell pi coins in 2024
DOT TECH
 
Isios-2024-Professional-Independent-Trustee-Survey.pdf
Isios-2024-Professional-Independent-Trustee-Survey.pdfIsios-2024-Professional-Independent-Trustee-Survey.pdf
Isios-2024-Professional-Independent-Trustee-Survey.pdf
Henry Tapper
 

Recently uploaded (20)

how to sell pi coins on Binance exchange
how to sell pi coins on Binance exchangehow to sell pi coins on Binance exchange
how to sell pi coins on Binance exchange
 
innovative-invoice-discounting-platforms-in-india-empowering-retail-investors...
innovative-invoice-discounting-platforms-in-india-empowering-retail-investors...innovative-invoice-discounting-platforms-in-india-empowering-retail-investors...
innovative-invoice-discounting-platforms-in-india-empowering-retail-investors...
 
how can i use my minded pi coins I need some funds.
how can i use my minded pi coins I need some funds.how can i use my minded pi coins I need some funds.
how can i use my minded pi coins I need some funds.
 
BYD SWOT Analysis and In-Depth Insights 2024.pptx
BYD SWOT Analysis and In-Depth Insights 2024.pptxBYD SWOT Analysis and In-Depth Insights 2024.pptx
BYD SWOT Analysis and In-Depth Insights 2024.pptx
 
what is a pi whale and how to access one.
what is a pi whale and how to access one.what is a pi whale and how to access one.
what is a pi whale and how to access one.
 
GeM ppt in railway for presentation on gem
GeM ppt in railway  for presentation on gemGeM ppt in railway  for presentation on gem
GeM ppt in railway for presentation on gem
 
The WhatsPump Pseudonym Problem and the Hilarious Downfall of Artificial Enga...
The WhatsPump Pseudonym Problem and the Hilarious Downfall of Artificial Enga...The WhatsPump Pseudonym Problem and the Hilarious Downfall of Artificial Enga...
The WhatsPump Pseudonym Problem and the Hilarious Downfall of Artificial Enga...
 
Poonawalla Fincorp and IndusInd Bank Introduce New Co-Branded Credit Card
Poonawalla Fincorp and IndusInd Bank Introduce New Co-Branded Credit CardPoonawalla Fincorp and IndusInd Bank Introduce New Co-Branded Credit Card
Poonawalla Fincorp and IndusInd Bank Introduce New Co-Branded Credit Card
 
Financial Assets: Debit vs Equity Securities.pptx
Financial Assets: Debit vs Equity Securities.pptxFinancial Assets: Debit vs Equity Securities.pptx
Financial Assets: Debit vs Equity Securities.pptx
 
where can I find a legit pi merchant online
where can I find a legit pi merchant onlinewhere can I find a legit pi merchant online
where can I find a legit pi merchant online
 
Introduction to Indian Financial System ()
Introduction to Indian Financial System ()Introduction to Indian Financial System ()
Introduction to Indian Financial System ()
 
how can I sell/buy bulk pi coins securely
how can I sell/buy bulk pi coins securelyhow can I sell/buy bulk pi coins securely
how can I sell/buy bulk pi coins securely
 
The European Unemployment Puzzle: implications from population aging
The European Unemployment Puzzle: implications from population agingThe European Unemployment Puzzle: implications from population aging
The European Unemployment Puzzle: implications from population aging
 
一比一原版BCU毕业证伯明翰城市大学毕业证成绩单如何办理
一比一原版BCU毕业证伯明翰城市大学毕业证成绩单如何办理一比一原版BCU毕业证伯明翰城市大学毕业证成绩单如何办理
一比一原版BCU毕业证伯明翰城市大学毕业证成绩单如何办理
 
Introduction to Value Added Tax System.ppt
Introduction to Value Added Tax System.pptIntroduction to Value Added Tax System.ppt
Introduction to Value Added Tax System.ppt
 
Scope Of Macroeconomics introduction and basic theories
Scope Of Macroeconomics introduction and basic theoriesScope Of Macroeconomics introduction and basic theories
Scope Of Macroeconomics introduction and basic theories
 
managementaccountingunitiv-230422140105-dd17d80b.ppt
managementaccountingunitiv-230422140105-dd17d80b.pptmanagementaccountingunitiv-230422140105-dd17d80b.ppt
managementaccountingunitiv-230422140105-dd17d80b.ppt
 
This assessment plan proposal is to outline a structured approach to evaluati...
This assessment plan proposal is to outline a structured approach to evaluati...This assessment plan proposal is to outline a structured approach to evaluati...
This assessment plan proposal is to outline a structured approach to evaluati...
 
what is the best method to sell pi coins in 2024
what is the best method to sell pi coins in 2024what is the best method to sell pi coins in 2024
what is the best method to sell pi coins in 2024
 
Isios-2024-Professional-Independent-Trustee-Survey.pdf
Isios-2024-Professional-Independent-Trustee-Survey.pdfIsios-2024-Professional-Independent-Trustee-Survey.pdf
Isios-2024-Professional-Independent-Trustee-Survey.pdf
 

du pont Earnings Release2006 2nd

  • 1. July 25, 2006 Contact: Anthony Farina WILMINGTON, Del. 302-774-4005 Anthony.R.Farina@usa.dupont.com DUPONT REPORTS SECOND QUARTER 2006 EARNINGS OF $1.04 PER SHARE; SEES STRONG YEAR-OVER-YEAR EARNINGS GROWTH IN SECOND HALF Highlights • The company reported second quarter 2006 earnings of $1.04 per share. Excluding significant items, earnings per share were $1.01, up 12 percent from $.90 per share last year. • Average local prices were 2 percent higher and increased for the 10th consecutive quarter. Worldwide sales volumes increased 1 percent, while currency effects reduced sales 1 percent. • Total fixed costs declined $80 million year-over-year, and as a percentage of sales improved 70 basis points to 39.8 percent. • The company reaffirms its full year earnings outlook and expects second half earnings to be up significantly compared to 2005. “Our results this quarter reflect progress in executing our growth strategies and performance improvement initiatives,” said Charles O. Holliday, Jr., DuPont chairman and chief executive officer. “Our businesses delivered improved pricing, more new product innovations, and again demonstrated excellent cost control. We also achieved important milestones in our emerging biofuels business and in our seed pipeline. We are well-positioned for strong earnings growth in the second half.” Global Consolidated Net Income and Sales Consolidated net income for the second quarter was $975 million, or $1.04 per share compared to second quarter 2005 net income of $1,015 million, or $1.01 per share. Excluding significant items, earnings per share were $1.01 in the second quarter 2006 compared to $.90 in the prior year. See Schedule B for a summary of significant items. Second quarter 2006 net income reflects higher local selling prices across all regions, lower fixed costs, and the impact of higher energy and ingredient costs. The current quarter net income also reflects higher miscellaneous income and a lower income tax rate.
  • 2. Consolidated net sales for the second quarter were $7.4 billion versus $7.5 billion last year. On a comparable business basis, sales were up 2 percent. For the quarter, total company volumes increased 1 percent, reflecting increases in all regions except the United States. Three Months Ended Percentage Change Due to: June 30, 2006 Local Currency (Dollars in billions) $ % Change* Price Effect Volume U.S. $3.3 (1)% 2 - (3) Europe 2.0 - 1 (3) 2 Asia Pacific 1.2 7 2 (2) 7 Canada & Latin America 0.9 9 2 2 5 Total Consolidated Sales $7.4 2 2 (1) 1 Percentages shown are on a comparable business basis by excluding second quarter 2005 sales of $202 million for * former elastomers businesses transferred to The Dow Chemical Company on June 30, 2005. 2
  • 3. Earnings Per Share The table below shows the variances in second quarter 2006 earnings per share (EPS) versus second quarter 2005, by major element: EPS ANALYSIS 2nd Quarter EPS - 2005 $1.01 2Q'05 Significant items (see Schedule B) .11 $ .90 Local prices .11 Volume .01 Variable costs (.15) Fixed costs .03 Currency/Misc. income .04 Lower shares net of higher interest .05 Tax Rate .02 Subtotal 1.01 2Q'06 Significant item (see Schedule B) .03 EPS - 2006 $1.04 Improved local pricing and higher volumes offset a significant portion of higher raw material costs. Fixed cost productivity, measured as a percent of sales, improved 70 basis points versus last year, reflecting an $80 million year-over-year reduction in total fixed costs. After adjusting for currency effects, volume and portfolio changes, after-tax fixed costs were $.03 per share lower than last year. 3
  • 4. Business Segment Performance Segment pretax operating income (PTOI) for second quarter 2006 was $1.5 billion, 6 percent below last year. PTOI excluding significant items was essentially flat. Segment PTOI, sales, and percentage changes versus second quarter 2005 are shown in the tables below. Three Months Ended June 30 PRETAX OPERATING INCOME % Change (Dollars in millions) 2006 2005 vs. 2005 Agriculture & Nutrition $ 428 $ 511 (16) % Coatings & Color Technologies 222 188 18 Electronic & Communication Technologies 169 217 (22) * Performance Materials 193 190 2 Pharmaceuticals 200 192 4 Safety & Protection 310 283 10 Other (30) 7 (529) ** Total $1,492 $1,588 (6) % * 2005 PTOI includes a $48 million gain on the sale of Photomasks. ** 2005 includes a $39 million gain on the disposition of a Textiles & Interiors affiliate. Percentage Three Months Ended Change Due to: SEGMENT SALES* June 30 U.S. $ (Dollars in billions) $ % Change Price Volume Agriculture & Nutrition $2.0 (4) (1) (3) Coatings & Color Technologies 1.6 2 1 1 Electronic & Communication Technologies 1.0 3 1 2 Performance Materials 1.7 6 3 3 Safety & Protection 1.4 3 3 - * Segment sales include inter-segment transfers and a pro rata share of affiliates' sales. Percentages shown for Performance Materials are after excluding second quarter 2005 sales of $202 million for former elastomers businesses transferred to The Dow Chemical Company on June 30, 2005. Following are summaries of second quarter 2006 performance for the business segments. Additional information on segment performance is available on the DuPont Investor Center at http://www.dupont.com. 4
  • 5. Agriculture & Nutrition • PTOI decreased $83 million with current quarter earnings of $428 million versus $511 million in the prior year, primarily due to lower crop protection sales and higher cost of goods sold. • Second quarter sales of $2.0 billion were down 4 percent. Higher Pioneer seed sales of 3 percent, including share gain in soybeans, were more than offset by lower crop protection volumes and prices. • During the quarter, the company licensed rights to several of its pipeline candidates and recorded income of $30 million. Coatings & Color Technologies • PTOI was $222 million versus prior year PTOI of $188 million. Earnings improvement was broad-based across the titanium dioxide, refinish, OEM and advanced coatings product lines. PTOI margins increased to 13.6% and fixed costs declined. • Second quarter sales were $1.6 billion, up 2 percent reflecting higher local prices in all product lines. • Cost reductions and consolidation of facilities as part of the transformation program for the coatings unit remain on track. Electronic & Communication Technologies • PTOI was $169 million versus $217 million in the prior year. 2005 included a $48 million gain on the sale of photomasks. Higher earnings in electronic materials were offset by higher costs in other product lines. • Second quarter sales were $1.0 billion, up 3 percent on higher volumes. Key growth segments include photovoltaics, semiconductor fabrication and wire and cable. Performance Materials • PTOI was $193 million versus $190 million in 2005. Higher selling prices, increased volumes and lower fixed costs more than offset significantly higher raw material costs, a negative currency impact, and the absence of earnings from businesses transferred to The Dow Chemical Company. PTOI margins increased to 11.1%. • Second quarter sales of $1.7 billion increased 6 percent on a comparable business basis. Sales increased in all regions and volume growth was strong in most market segments. Safety & Protection • PTOI was $310 million versus $283 million in the prior year, largely as a result of sales growth across all business units while holding fixed costs flat. PTOI margins increased to 21.6% • Second quarter sales of $1.4 billion were up 3 percent, reflecting higher USD prices. • Demand remained firm across major markets such as construction, electrical, industrial and medical. 5
  • 6. Outlook For the second half, the company expects to earn about $.91 per share before significant items. This is nearly double the $.46 per share earned in the second half of last year, which was adversely affected by hurricanes. The company anticipates that continued pricing strength and new product introductions, combined with fixed cost control and modest volume growth, will more than offset higher energy and ingredient costs. The company expects its 2006 reported earnings to be about $2.83 per share. The company reaffirms its full-year 2006 outlook of about $2.85 per share, excluding significant items of $.02 per share. This is 22 percent higher than 2005 earnings per share of $2.34. “Our first half performance provides more positive momentum for our company,” Holliday said. “While we expect challenges, we are determined to deliver significantly higher earnings in the second half compared to last year. We will continue to rapidly advance and commercialize our technology pipelines and execute our performance improvement initiatives.” Use of Non-GAAP Measures Management believes that measures of income excluding significant items (“non-GAAP” information) are meaningful to investors because they provide insight with respect to ongoing operating results of the company. Such measurements are not recognized in accordance with generally accepted accounting principles (GAAP) and should not be viewed as an alternative to GAAP measures of performance. Reconciliations of non-GAAP measures to GAAP are provided in Schedule E. DuPont is a science company. Founded in 1802, DuPont puts science to work by creating sustainable solutions essential to a better, safer, healthier life for people everywhere. Operating in more than 70 countries, DuPont offers a wide range of innovative products and services for markets including agriculture, nutrition, electronics, communications, safety and protection, home and construction, transportation and protective apparel. 6
  • 7. Forward-Looking Statements: This news release contains forward-looking statements based on management's current expectations, estimates and projections. All statements that address expectations or projections about the future, including statements about the company's strategy for growth, product development, market position, expected expenditures and financial results are forward-looking statements. Some of the forward-looking statements may be identified by words like quot;expects,quot; quot;anticipates,quot; quot;plans,quot; quot;intends,quot; quot;projects,quot; quot;indicates,quot; and similar expressions. These statements are not guarantees of future performance and involve a number of risks, uncertainties and assumptions. Many factors, including those discussed more fully elsewhere in this release and in documents filed with the Securities and Exchange Commission by DuPont, particularly its latest annual report on Form 10-K and quarterly report on Form 10- Q, as well as others, could cause results to differ materially from those stated. These factors include, but are not limited to changes in the laws, regulations, policies and economic conditions, including inflation, interest and foreign currency exchange rates, of countries in which the company does business; competitive pressures; successful integration of structural changes, including restructuring plans, acquisitions, divestitures and alliances; cost of raw materials, research and development of new products, including regulatory approval and market acceptance; seasonality of sales of agricultural products; and severe weather events that cause business interruptions, including plant and power outages, or disruptions in supplier and customer operations. ### 7/25/06 7
  • 8. E. I. DU PONT DE NEMOURS AND COMPANY AND CONSOLIDATED SUBSIDIARIES SCHEDULE A Three Months Ended Six Months Ended CONSOLIDATED INCOME STATEMENT June 30, June 30, (Dollars in millions, except per share) 2006 2005 2006 2005 NET SALES $7,442 $7,511 $14,836 $14,942 Other Income, Net (a) 397 611 667 1,006 Total 7,839 8,122 15,503 15,948 Cost of Goods Sold and Other Operating Charges (b) 5,229 5,220 10,565 10,271 Selling, General and Administrative Expenses 853 866 1,644 1,673 Amortization of Intangible Assets 56 57 115 114 Research and Development Expense 328 339 641 652 Interest Expense 119 120 233 224 Separation Charges - Textiles & Interiors(c) - (39) - (39) Total 6,585 6,563 13,198 12,895 INCOME BEFORE INCOME TAXES AND MINORITY INTERESTS(d) 1,254 1,559 2,305 3,053 Provision for Income Taxes (e) 278 517 510 1,026 Minority Interests in Earnings of Consolidated Subsidiaries 1 27 3 45 NET INCOME $ 975 $1,015 $ 1,792 $ 1,982 BASIC EARNINGS PER SHARE OF COMMON STOCK (f) $ 1.05 $ 1.02 $ 1.94 $ 1.99 DILUTED EARNINGS PER SHARE OF COMMON STOCK (f) $ 1.04 $ 1.01 $ 1.92 $ 1.97 DIVIDENDS PER SHARE OF COMMON STOCK $ 0.37 $ 0.37 $ 0.74 $ 0.72 8
  • 9. NOTES TO CONSOLIDATED INCOME STATEMENT (a) Year-to-date 2006 includes a reversal of accrued interest of $7 ($4 after-tax) associated with the favorable settlement of certain prior year tax contingencies which had been previously reserved. Second quarter 2005 includes a gain of $23 resulting from the disposition of certain assets of DuPont Dow Elastomers LLC (DDE) to The Dow Chemical Company, a $28 benefit related to interest on certain prior year tax contingencies, and a gain of $48 resulting from the sale of the company's equity interest in DuPont Photomasks Inc. (b) Year-to-date 2006 includes a restructuring charge of $135 ($98 after-tax) in the Coatings & Color Technologies segment in connection with the company's plans to close and consolidate certain manufacturing and laboratory sites within the segment. The charge consists of employee separation charges, primarily in Europe, for approximately 1,300 employees and other exit costs. Second quarter 2005 includes a charge of $34 related to the shutdown of an Elastomers manufacturing facility in the United States. (c) Second quarter 2005 includes a net gain of $39 relating to the disposition of three equity affiliates associated with the ongoing separation of Textiles & Interiors, partly offset by other separation costs. (d) Second quarter 2005 includes $14 of operating income related to certain DDE assets that were disposed of on June 30, 2005. (e) Second quarter 2006 includes a tax benefit of $31 associated with an increase in the deferred tax assets of a European subsidiary for a tax basis investment loss recognized on the local tax return. Year-to-date 2006 includes the reversal of $44 of income taxes associated with favorable settlement of certain prior-year tax contingencies which had been previously reserved. Second quarter 2005 includes a net tax benefit of $24 related to certain prior year tax contingencies previously reserved. (f) Earnings per share are calculated on the basis of the following average number of common shares outstanding: Three Months Ended Six Months Ended June 30 June 30 Basic Diluted Basic Diluted 2006 922,227,761 931,953,934 921,723,199 930,892,168 2005 996,025,680 1,002,809,399 996,164,219 1,004,506,893 9
  • 10. E. I. DU PONT DE NEMOURS AND COMPANY AND CONSOLIDATED SUBSIDIARIES SCHEDULE B SIGNIFICANT ITEMS (Dollars in millions, except per share) Pretax After-Tax ($ Per Share) 2006 2005 2006 2005 2006 2005 1st Quarter - Total $(128) - $(50) - $(.05) - 2nd Quarter: DDE - Related Items Gain on Sale of Assets $ 23 $ 15 Operating Income from Assets Sold 14 10 Employee Separation Costs (34) (23) Total 3 2 Textiles & Interiors Separation Charges 39 26 $.03 Sale of Photomasks Stock 48 31 .03 Corporate Tax - Related Items 28 $ 31 52 $ .03 .05 2nd Quarter Total $ - $118 $ 31 $111 $ .03 $.11 SIGNIFICANT ITEMS BY SEGMENT (Dollars in millions on pretax basis) Three Months Ended Six Months Ended June 30, June 30, 2006 2005 2006 2005 Agriculture & Nutrition $ - $- $- $- Coating & Color Technologies - - (135) - Electronic & Communication Technologies - 48 - 48 Performance Materials - 3 - 3 Safety & Protection - - - - Textiles & Interiors - - - - Other - 39 - 39 Total (excluding Corporate) $ - $90 $(135) $90 See Notes to Consolidated Income Statement for additional details. 10
  • 11. E. I. DU PONT DE NEMOURS AND COMPANY AND CONSOLIDATED SUBSIDIARIES SCHEDULE C Three Months Ended Six Months Ended CONSOLIDATED SEGMENT INFORMATION (1) June 30, June 30, (Dollars in millions) 2006 2005 2006 2005 SALES (2) Agriculture & Nutrition $2,021 $2,102 $ 4,267 $ 4,458 Coatings & Color Technologies 1,630 1,601 3,112 3,105 Electronic & Communication Technologies 1,006 972 1,948 1,858 Performance Materials 1,735 1,836 3,450 3,621 Safety & Protection 1,435 1,388 2,818 2,670 Other 16 13 29 25 Elimination of Transfers (77) (82) (167) (160) Elimination of Equity Affiliate Sales (324) (319) (621) (635) CONSOLIDATED NET SALES $7,442 $7,511 $14,836 $14,942 PRETAX OPERATING INCOME (LOSS) (PTOI)(3) Agriculture & Nutrition $ 428 $ 511 $ 1,016 $ 1,268 Coatings & Color Technologies (b) 222 188 237 349 Electronic & Communication Technologies(a) 169 217 332 327 Performance Materials(a)(b)(d) 193 190 330 401 Pharmaceuticals 200 192 369 351 Safety & Protection 310 283 579 514 Other(c) (30) 7 (56) (14) Total Segment PTOI 1,492 1,588 $ 2,807 3,196 Exchange Gains and Losses (4) 26 183 8 294 Corporate Expenses & Net Interest (264) (212) (510) (437) INCOME BEFORE INCOME TAXES AND MINORITY INTERESTS $1,254 $1,559 $ 2,305 $ 3,053 (1) Certain reclassifications of segment data have been made to reflect changes in organizational structure. (2) Sales for the reporting segments include transfers and a pro rata share of equity affiliate sales. (3) Refer to the Notes to Consolidated Income Statement for additional information on significant items included in the reported results. (4) Net after-tax exchange activity for second quarter 2006 and 2005 were a gain of $10 and a loss of $10, respectively. Gains and losses resulting from the company's hedging program are largely offset by associated tax effects. 11
  • 12. E. I. DU PONT DE NEMOURS AND COMPANY AND CONSOLIDATED SUBSIDIARIES SCHEDULE D SELECTED INCOME STATEMENT DATA (Dollars in millions, except per share) Three Months Ended Six Months Ended June 30 June 30 2006 2005 % Chg. 2006 2005 % Chg. Consolidated Net Sales $7,442 $7,511 (1)% $14,836 $14,942 (1)% Segment Sales 7,843 7,912 (1) 15,624 15,737 (1) Segment PTOI 1,492 1,588 (6) 2,807 3,196 (12) Adjusted EBIT* 1,363 1,610 (15) 2,507 3,153 (20) Adjusted EBITDA* 1,696 1,935 (12) 3,177 3,810 (17) Income Before Income Taxes and Minority Interests 1,254 1,559 (20) 2,305 3,053 (25) EPS - Diluted 1.04 1.01 3 1.92 1.97 (3) * See Reconciliation of Non-GAAP measures (Schedule E). SCHEDULE E RECONCILIATION OF NON-GAAP MEASURES (Dollars in millions) Reconciliation of Adjusted EBIT / Adjusted EBITDA to Consolidated Income Statement Three Months Ended Six Months Ended June 30, June 30, 2006 2005 2006 2005 Income Before Income Taxes and Minority Interests $1,254 $1,559 $2,305 $3,053 Less: Minority Interest in Earnings of Consolidated Subsidiaries (1) (1) (31) (3) (54) Add: Net Interest Expense (2) 110 82 205 154 Adjusted EBIT 1,363 1,610 2,507 3,153 Add: Depreciation and Amortization (3) 333 325 670 657 Adjusted EBITDA $1,696 $1,935 $3,177 $3,810 (1) Excludes income taxes. (2) Includes interest expense plus amortization of capitalized interest less interest income. (3) Excludes amortization of capitalized interest. 12
  • 13. E. I. DU PONT DE NEMOURS AND COMPANY AND CONSOLIDATED SUBSIDIARIES SCHEDULE E -- (Continued) Reconciliation of Earnings Per Share (EPS) Three Months Ended Six Months Ended June 30, June 30, 2006 2005 2006 2005 Earnings Per Share before Significant Items $1.01 $ .90 $1.94 $1.86 Significant Items included in EPS .03 .11 (.02) .11 Reported EPS $1.04 $1.01 $1.92 $1.97 Reconciliation of Earnings Per Share (EPS) Outlook Year Ended December 31, 2006 2005 Outlook Actual Earnings Per Share before Significant Items Significant Items included in EPS: $2.85 $2.34 Coatings & Color Technologies - Restructuring Charges (.10) - American Jobs Creation Act - (.29) Hurricane Charges - (.09) Textiles & Interiors - Separation Charges - .03 Sale of Photomasks Stock - .03 Corporate Tax-Related Items .08 .05 Net Charge for Significant Items (.02) (.27) Reported EPS $2.83 $2.07 13
  • 14. E. I. DU PONT DE NEMOURS AND COMPANY AND CONSOLIDATED SUBSIDIARIES SCHEDULE E -- (Continued) Reconciliation of Base Income Tax Rate to Effective Income Tax Rate Three Months Ended Six Months Ended June 30, June 30, 2006 2005 2006 2005 Income Before Income Taxes and Minority Interests $1,254 $1,559 $2,305 $3,053 Remove: Significant Items - Charge/(Benefit) - (118) 128 (118) Net Exchange Gains (26) (183) (8) (294) Income Before Income Taxes, Significant Items, Exchange Gains and Minority Interests $1,228 $1,258 $2,425 $2,641 Provision for Income Taxes $ 278 $ 517 $ 510 $1,026 Remove: (Expense)/Benefit Tax on Significant Items 31 (7) 109 (7) Tax on Exchange Gains (16) (193) (20) (342) Provision for Income Taxes, Excluding Taxes on Significant Items and Exchange Gains $ 293 $ 317 $ 599 $ 677 Effective Income Tax Rate 22.2% 33.2% 22.1% 33.6% Base Income Tax Rate 23.8% 25.2% 24.7% 25.6% Reconciliation of Fixed Cost as a Percent of Sales Three Months Ended Six Months Ended June 30, June 30, 2006 2005 2006 2005 Total Charges and Expenses - Consolidated $6,585 $6,563 $13,198 $12,895 Income Statement Remove: Interest Expense 119 120 233 224 Fixed Cost - Textiles & Interiors - 8 - 18 Separation Charges - Textiles & Interiors - (39) - (39) Variable Costs (1) 3,507 3,401 6,943 6,646 Significant Items - Charge (2) - 34 135 34 Fixed Cost $2,959 $3,039 $ 5,887 $ 6,012 Consolidated Net Sales $7,442 $7,511 $14,836 $14,942 Fixed Costs as a Percent of Sales 39.8% 40.5% 39.7% 40.2% (1) Includes variable manufacturing costs, freight, commissions and other selling expenses which vary with the volume of sales. (2) See Schedule B for detail of significant items. 14