Download as PDF, PPTX


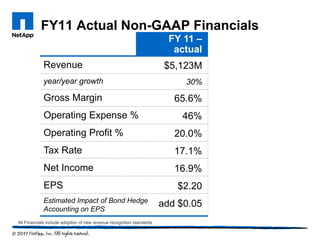
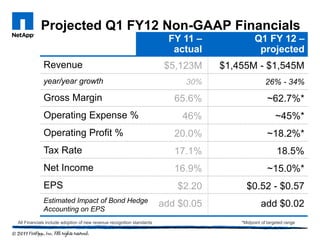
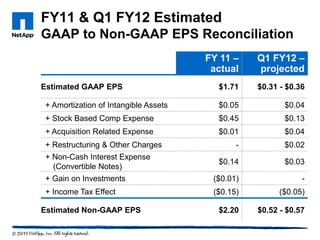
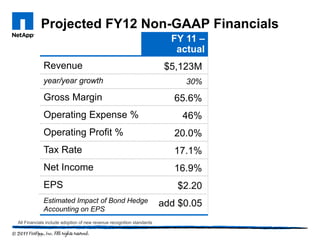
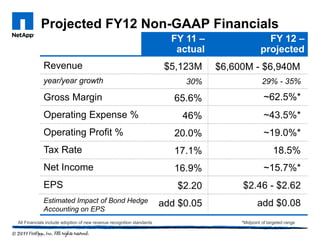
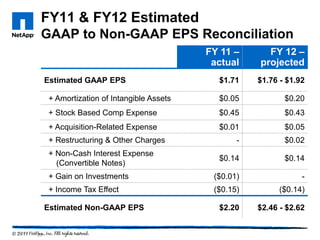
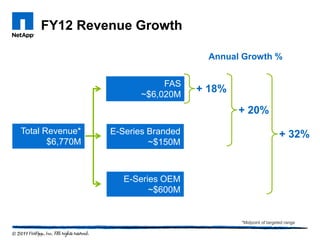
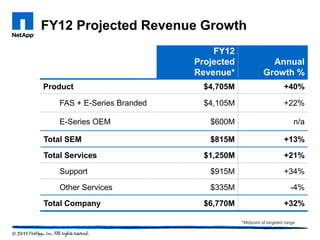
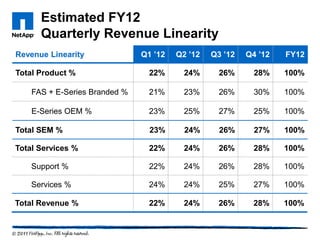
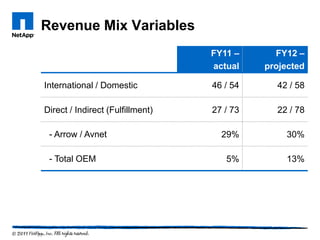
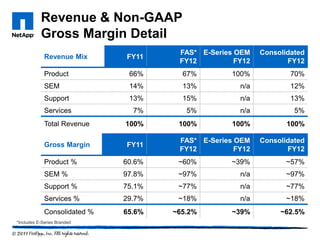
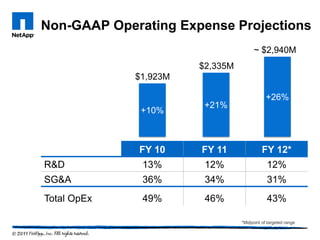
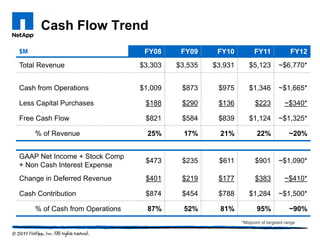


The presentation provided financial projections for Q1 FY12 and full year FY12, showing expected revenue growth of 26-34% and 29-35% respectively. Gross margins were projected to remain strong at around 62.5% for FY12. Operating expenses were projected to decline as a percentage of revenue to 43.5% for FY12. Cash flow was projected to remain robust at around 20% of revenue.