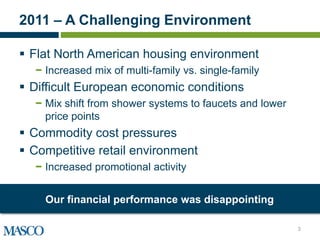
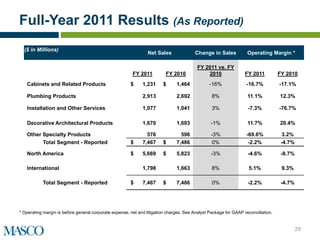
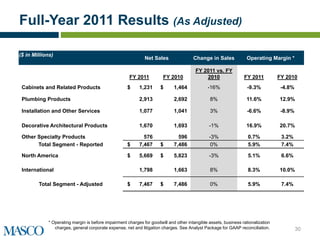
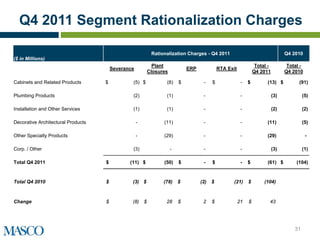
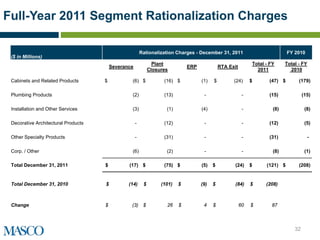
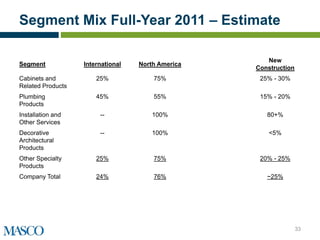
Fourth Quarter 2011
Masco Earnings Presentation
Tuesday, February 14, 2012
8:00 a.m. ET

                              1
Written and oral statements made in this presentation that reflect our views about our future performance
constitute "forward-looking statements" under the Private Securities Litigation Reform Act of 1995. Forward-
looking statements can be identified by words such as “believe,” “anticipate,” “appear,” “may,” “will,” “should,”
“intend,” “plan,” “estimate,” “expect,” “assume,” “seek,” “forecast,” and similar references to future periods.
These views involve risks and uncertainties that are difficult to predict and, accordingly, our actual results
may differ materially from the results discussed in our forward-looking statements. We caution you against
relying on any of these forward-looking statements. Our future performance may be affected by our reliance
on new home construction and home improvement, our reliance on key customers, the cost and availability of
raw materials, shifts in consumer preferences and purchasing practices, and our ability to achieve cost
savings through restructuring and other initiatives. These and other factors are discussed in detail in Item 1A,
“Risk Factors” in our Annual Report on Form 10-K, as well as in our Quarterly Reports on Form 10-Q and in
other filings we make with the Securities and Exchange Commission. Our forward-looking statements in this
presentation speak only as of the date of this presentation. Factors or events that could cause our actual
results to differ may emerge from time to time, and it is not possible for us to predict all of them. Unless
required by law, we undertake no obligation to update publicly any forward-looking statements as a result of
new information, future events or otherwise.

   Certain of the financial and statistical data included in this presentation and the related materials are non-
GAAP financial measures as defined under Regulation G. The Company believes that non-GAAP
performance measures and ratios used in managing the business may provide attendees of this presentation
with additional meaningful comparisons between current results and results in prior periods. Non-GAAP
performance measures and ratios should be viewed in addition to, and not as an alternative for, the
Company's reported results under accounting principles generally accepted in the United States. Additional
information about the Company is contained in the Company's filings with the SEC and is available on
Masco’s Web Site, www.masco.com.


                                                                                                             2
2011 – A Challenging Environment

 Flat North American housing environment
  − Increased mix of multi-family vs. single-family
 Difficult European economic conditions
  − Mix shift from shower systems to faucets and lower
    price points
 Commodity cost pressures
 Competitive retail environment
  − Increased promotional activity


    Our financial performance was disappointing

                                                         3
Key Financial Data

                                                                   Q4                           Q4                      Full-Year                   Full-Year
                                                                  2011                         2010                       2011                        2010

Net Sales (Millions)                                           $1,738                        $1,716                        $7,467                      $7,486

Adjusted EPS*                                                  $(0.09)                       $(0.08)                          $.02                        $.23

Adjusted Gross Profit Margins*                                  21.9%                         23.5%                        25.1%                        26.7%

Adjusted Operating Margins*                                      1.6%                          1.9%                          4.4%                        5.9%

Working Capital                                                     N/A                           N/A                      12.2%                        13.4%

Free Cash Flow (Millions)                                           N/A                           N/A                         $71                        $296


                 $1.7 Billion of cash at December 31, 2011
           *(Loss) as reported was $(1.42) per common share and $(2.92) per common share for the fourth quarter of 2011 and 2010, respectively and $(1.34) per
           common share and $(2.94) per common share for the years ended December 31, 2011 and 2010, respectively.
           Gross profit margins as reported were 19.1% and 18.0% for the fourth quarter of 2011 and 2010, respectively and 23.9% and 24.5% for the years ended
           December 31, 2011 and 2010, respectively. Operating margins as reported were (30.6)% and (44.8)% for the fourth quarter of 2011 and 2010,
                                                                                                                                                                 4
           respectively and (4.0)% and (6.2)% for the years ended December 31, 2011 and 2010, respectively.
We Took Actions in 2011 to Better Position for
the Current Environment and the Recovery
 Continued to rationalize our businesses
    − Closed/consolidated plants
    − Continued to reduce costs and headcount
    − Planned disposition of underperforming businesses
    − Product exits
 Completed the major restructuring of our North American Cabinet and
  Installation businesses
 Introduced new products and programs
 Invested in future growth opportunities
    − Including international growth
 Improved working capital management
 Successfully amended our credit agreement


  Held or improved share in most major product categories

                                                                        5
Cabinets and Related Products
Financial Performance Q4 2011                                                               Financial Performance FY 2011
                                                                    12/31/11                                                                                           12/31/11
                                    4th
                                   QTR                                 vs.                                                        Full-Year                               vs.
  ($ in Millions)            3 Months Ended                          12/31/10                  ($ in Millions)                12 Months Ended                           12/31/10
                         12/31/2011 12/31/2010                      $       %                                              12/31/2011 12/31/2010                       $       %
Net Sales                   $287                 $304             $(17)        (6%)        Net Sales                          $1,231               $1,464          $(233)         (16%)
Operating (Loss)*           $(38)                $(46)             $8          N/A         Operating (Loss)*                  $(115)                $(71)          $(44)           N/A
Operating Margin           (13.2%)              (15.1%)                                    Operating Margin                   (9.3%)               (4.8%)
Decremental Margin                                                N/A                      Decremental Margin                                                       (19%)


Commentary                                                                                  Brands
•Excluding sales related to the exit of certain product lines:
        •Q4 sales were up 2%
        •Full-year 2011 sales were down 5%
• Operating margins in the segment were impacted by:
        •Reduced volume and negative mix
        •Product exit and related loss of leverage
        •Aggressive promotional activity
        •Profit improvement initiatives
        •Unfavorable price/commodity relationship principally in Europe

                                                                                                                                                            ®


                       *Excludes business rationalization charges of $13M and $91M in the fourth quarters of 2011 & 2010, respectively and $47M and $179M for the full-year
                       2011 and 2010, respectively. Also excludes goodwill impairment charge of $44M in 2011. See Analyst Package for GAAP reconciliation.                    6
2012 Outlook - Cabinets
    Estimated Improvement
(in Millions)                                                                Sales                 Operating Profit
2011 Total Segment                                                           $1,230                    ($115)
                                          1
Less: 2011 International                                                      ($370)                       ($40)
2011 North America Cabinet Actual                                              $860                        ($75)
Product Exit                                                                     (10)                       $13
2011 N.A. Operating Loss                                                                                   ($62)
                                                     2
2012 Profit Improvements, Net                                                                               $30
                                                         2
2012 Revenue Opportunities, Net                                                  $30                        $10
2012 N.A. Cabinet Estimate                                                     $880                        ($22)
1
    Uncertain economic environments, identified cost reductions of ~$7M net in 2012
2
    Management estimates


    *Assumptions:                                                          Opportunities:
    • Reflects a flat retail and housing start environment of              • Adding new dealers and additional brands with existing
      600k starts with constant mix                                          dealers in 2011 starting to show solid results
    • Every 50k increase in lagged US starts = ~$25M in                    • New 2011 vanity/top programs at retail now generating
      revenues (assuming constant mix) which converts to ~$8-                growth opportunities
      $10M in profits                                                      • New 2011 kitchen countertop program at retail
                                                                             expanding throughout the East Coast
                                                                                                                              7
Installation and Other Services
Financial Performance Q4 2011                                                     Financial Performance FY 2011
                                                            12/31/11                                                                                       12/31/11
                                   4th
                                   QTR                        vs.                                                      Full-Year                             vs.
  ($ in Millions)            3 Months Ended                 12/31/10                ($ in Millions)                12 Months Ended                         12/31/10
                         12/31/2011 12/31/2010              $      %                                            12/31/2011 12/31/2010                      $      %
Net Sales                    $285             $254         $31      12%          Net Sales                         $1,077              $1,041            $36          3%
Operating (Loss)*            $(6)             $(19)        $13      N/A          Operating (Loss)*                  $(71)               $(93)            $22          N/A
Operating Margin            (2.1%)           (7.5%)                              Operating Margin                  (6.6%)              (8.9%)
Incremental Margin                                        42%                    Incremental Margin                                                      61%


Commentary                                                                         Businesses
 •Full-year and Q4 sales benefitted from residential insulation share gains
 and expansion of the retrofit and commercial businesses
                                                                                                                                                                  ®
 •Q4 sales also benefitted from an increase in lagged housing starts of 6%                                                ®

 •Sales were negatively impacted by a shift from single-family to multi-
 family units                                                                                                                                      ®

 •Operating margins were favorably impacted by:
        •Incremental volume
        •Profit improvement initiatives


                                                          *Excludes business rationalization charges of $2M in each of the fourth quarters of 2011 and 2010 and
                                                          $8M in each of the full-year 2011 and 2010. Also excludes goodwill impairment charges of $697M in       8
                                                          2010. See Analyst Package for GAAP reconciliation.
2012 Outlook – Installation
    Estimated Improvement
Sales
(in Millions)                                                     Sales                 Operating Profit
2011 Total Segment                                                $1,077                       ($71)
2011 Branch Closures                                              ($30)                          $6
2011 Adjusted Segment                                             $1,047                       ($65)
                                              1
2012 Profit Improvements, Net                                                                   $20
                                                  1
2012 Revenue Opportunities, Net                                    $40                          $10
2012 Installation Segment Estimate                                $1,087                       ($35)
1
    Management Estimates


     *Assumptions                                                 Opportunities:
     • Reflects a flat housing start environment of 600k starts   • Segment continues to add profitable retrofit
       with constant mix                                            and residential/commercial business
     • Every 50k increase in lagged US starts = ~$50M in          • Further cost reductions from lean
       revenues (assuming constant mix) which converts to           implementation, ERP leverage, vendor
       ~$12M-$15M in profits                                        partnership and supply chain benefits


                                                                                                            9
Plumbing Products
Financial Performance Q4 2011                                                           Financial Performance FY 2011
                                                                  12/31/11                                                                                         12/31/11
                                     4th
                                   QTR                              vs.                                                       Full-Year                               vs.
  ($ in Millions)            3 Months Ended                       12/31/10                ($ in Millions)                 12 Months Ended                           12/31/10
                         12/31/2011 12/31/2010                    $      %                                            12/31/2011    12/31/2010                     $       %
Net Sales                     $674            $661              $13         2%        Net Sales                          $2,913               $2,692              $221        8%
Operating Profit*             $56              $70             $(14)        N/A       Operating Profit*                   $338                 $347               $(9)        N/A
Operating Margin              8.3%            10.6%                                   Operating Margin                   11.6%                12.9%
Decremental Margin                                              N/A                   Decremental Margin                                                          N/A


 Commentary                                                                           Brands
•Sales increases were driven by:
         •Volume (full-year) and price increases
         •Positive effect of currency (full-year)

•Operating margins were impacted by:
       •Price/commodity relationships which were positive in the
       quarter but are negative for the full-year
       •Unfavorable product mix                                                                                            ®
       •New program costs
       •Strategic growth spend


                                                *Excludes business rationalization charges of $3M & $5M in the fourth quarters of 2011 & 2010, respectively and
                                                $15M in each of the full-year 2011 and 2010. Also excludes goodwill impairment charges of $1M in each of 2011 &
                                                2010. See Analyst Package for GAAP reconciliation.                                                                       10
2012 Outlook - Plumbing Products

 Focus on total cost productivity
   − Commodity cost management
 Executing on growth opportunities
   − International expansion
   − North American Retail
 Enhancing and leveraging brand equity
   − Growing share through leveraging our leadership
     brands


                                                       11
Decorative Architectural Products
Financial Performance Q4 2011                                                     Financial Performance FY 2011
                                                            12/31/11                                                                                          12/31/11
                                4th
                               QTR                            vs.                                                       Full-Year                               vs.
  ($ in Millions)        3 Months Ended                     12/31/10                 ($ in Millions)                12 Months Ended                           12/31/10
                     12/31/2011 12/31/2010                  $      %                                             12/31/2011 12/31/2010                        $       %
Net Sales               $348            $336               $12        4%          Net Sales                         $1,670               $1,693              $(23)    (1%)
Operating Profit*        $35             $50              $(15)       N/A         Operating Profit*                  $283                 $350               $(67)    N/A
Operating Margin        10.1%           14.9%                                     Operating Margin                  16.9%                20.7%
Decremental Margin                                         N/A                    Decremental Margin                                                     (291%)


Commentary                                                                        Brands
• Full-year and Q4 sales were impacted by:
       • Reduced volumes, including the loss of Wal-Mart paint
          and hardware business
       • Price increases

• Operating margins were negatively impacted in both the
  quarter and full-year by:
      • Volume declines
      • Unfavorable price/commodity relationships
      • Unfavorable mix
      • Strategic growth spend and program costs

                                      *Excludes business rationalization charges of $11M & $5M for the fourth quarters of 2011 and 2010, respectively and
                                      $12M & $5M for the full-year 2011 and 2010, respectively. Also excludes goodwill impairment charges of $75M in 2011.       12
                                      See Analyst Package for GAAP reconciliation.
2012 Outlook - Decorative Architectural
Products

 Focus on total cost productivity
   − Commodity cost management
 Executing on growth opportunities
   − Enhance the Core
   − Grow the Pro
   − International growth
 Enhancing and leveraging brand equity
   − New product introductions
   − Quality leadership


                                          13
Other Specialty Products
Financial Performance Q4 2011                                                               Financial Performance FY 2011
                                                                   12/31/11                                                                                    12/31/11
                                  4th
                                  QTR                                vs.                                                              Full-Year                  vs.
  ($ in Millions)           3 Months Ended                         12/31/10                     ($ in Millions)                   12 Months Ended              12/31/10
                        12/31/2011 12/31/2010                     $       %                                                  12/31/2011          12/31/2010    $         %
Net Sales                  $144                $161            $(17)         (11%)         Net Sales                              $576               $596     $(20)     (3%)
Operating Profit            $ ---               $3              $(3)          N/A          Operating Profit                        $4                 $19     $(15)     N/A
Operating Margin             ---%              1.9%                                        Operating Margin                       0.7%               3.2%
Decremental Margin                                             (18%)                       Decremental Margin                                                 (75%)


  Commentary                                                                               Brands
  •Full-Year and Q4 sales reflect:
          •Lower sales volume of windows in North America (principally
          due to the expiration of the tax credit in 2010) which more                                                      ®
          than offset share gains from new products and geographies

  •Operating margins were impacted by (both Q4 & full-year):
         • Volume decreases
         • New product launch and geographic expansion costs
         • Unfavorable product mix
         • Favorable price/commodity relationship
         • Profit improvement initiatives


                           *Excludes business rationalization charges of $29M for the fourth quarter of 2011 and $31M for the full-year 2011. Also                 14
                           excludes goodwill impairment charges of $374M in 2011. See Analyst Package for GAAP reconciliation.
2012 Outlook - Other Specialty Products

 Focus on total cost productivity
   − Realize benefits from Q4 2011 plant closures
 Executing on growth opportunities
   − Texas and Western Canada expansion
   − Expanding at Retail in UK and US
 Enhancing and leveraging brand equity
   − Leveraging Essence launch


                                                    15
2012 Guidance Estimates

           ($ in Millions)                          2012 Estimate                               2011 Actual
   Rationalization Charges*                                 ~ $20                                     $121

   Tax Rate**                                              ~ 50%                                      18%

   Interest Expense                                        ~ $260                                     $254

   General Corp. Expense                                   ~ $140                                     $118

   Capital Expenditures                                    ~ $180                                     $151

   Depreciation & Amortization                             ~ $220                                   $263***

   Outstanding Shares                                   348 million                               348 million

*Based on current business plans.

**Tax rate for 2011 excludes the valuation allowance on the Federal deferred income tax assets and the impairment charge
for goodwill and other intangible assets.

***2011 includes $58M of accelerated depreciation, which is also included in the rationalization charges.

                                                                                                                     16
2012 Strategic Initiatives
     1
                       • Leverage brands
     Expand market
     leadership        • Innovative products


     2
                       • Total cost productivity
     Reduce costs
                       • Drive lean benefits         Outperform
                                                         the
     3
                       • Focus on Cabinets,           recovery
     Improve             Installation
     underperforming
     businesses        • Return to profitability

     4
                       • Debt reduction
     Strengthen        • Credit facility amendment
     Balance Sheet


                                                           17
Questions & Answers


                      18
Appendix


           19
Q4 2011 EPS
Reconciliation
  (in Millions)                                                       Q4 2011         Q4 2010


  Loss from Continuing Operations before Income Taxes – As Reported   $    (593)      $    (824)


    Rationalization Charges                                                     61              104
    Impairment of goodwill and other intangible assets                       494                698
    Litigation Charge                                                            3                -
    Financial Investment (Income) Expense                                       (4)         (10)
  Loss from Continuing Operations before Income Taxes – As Adjusted         (39)            (32)


    Tax at 36% rate benefit (expense)                                           14               12
    Less: Net income attributable to non-controlling interest                   (5)             (9)
  Net Loss – as adjusted                                              $     (30)      $     (29)


  Loss per common share – as adjusted                                 $    (0.09)     $    (0.08)


  Shares                                                                     348                349


                                                                                            20
Full-Year 2011 EPS
Reconciliation

($ in Millions)                                                       YTD 12/31/11    YTD 12/31/10


Loss from Continuing Operations before Income Taxes – As Reported       $     (472)    $      (741)


  Rationalization Charges                                                      121             208
  Impairment of goodwill and other intangible assets                           494             698
  Litigation Charge                                                              9                   -
  Financial Investment (Income) Expense                                        (73)             25
Income from Continuing Operations before Income Taxes – As Adjusted             79             190


  Tax at 36% rate                                                              (28)            (68)
  Less: Net income attributable to non-controlling interest                    (42)            (41)
Net Income – as adjusted                                                $        9      $       81


Earnings per common share – as adjusted                                 $      0.02     $      0.23


Shares                                                                         348             349


                                                                                                         21
Q4 2011 Profit
Reconciliation

 ($ in Millions)                                       Q4 2011         Q4 2010


  Sales                                                $    1,738      $        1,716


  Gross Profit – As Reported                           $         332   $         309

  Rationalization Charges                                        48               95

  Gross Profit – As Adjusted                           $         380   $         404

    Gross Margin - As Reported                              19.1%              18.0%
    Gross Margin - As Adjusted                              21.9%              23.5%


  Operating Loss – As Reported                         $    (531)      $        (769)

  Rationalization Charges                                         61             104
  Impairment of goodwill and other intangible assets             494             698
  Litigation Charge                                                3                -

  Operating Profit – As Adjusted                       $          27       $      33

    Operating Margin - As Reported                         -30.6%              -44.8%
    Operating Margin - As Adjusted                           1.6%               1.9%

                                                                                    22
Full-Year 2011 Profit
Reconciliation
   ($ in Millions)                                       YTD 12/31/11     YTD 12/31/10


    Sales                                                     $   7,467     $    7,486

    Gross Profit – As Reported                                $   1,784     $    1,833

    Rationalization Charges                                          91            166

    Gross Profit – As Adjusted                                $   1,875     $    1,999

      Gross Margin - As Reported                                  23.9%         24.5%
      Gross Margin - As Adjusted                                  25.1%         26.7%

    Operating (Loss) Profit – As Reported                  $      (295)     $    (463)

    Rationalization Charges                                         121            208

    Impairment of goodwill and other intangible assets              494            698

    Litigation Charges                                                9                  -

    Operating Profit – As Adjusted                        $         329     $      443

      Operating Margin - As Reported                              -4.0%          -6.2%
      Operating Margin - As Adjusted                               4.4%           6.0%

                                                                                     23
2011 Impairment of Goodwill and Other
Intangible Assets

 Goodwill/intangible asset impairment of $494 million,
  primarily related to:
   − Milgard Manufacturing, our North American window business
   − Tvilum, our European ready-to-assemble cabinet business
   − Liberty, our North American builders’ hardware business
 Non-cash charge aggregated ($0.96) per common share


          Successfully Amended our Credit Line

                                                                 24
Credit Facility Amendment

 $1.25 billion line established in June 2010 with two financial covenants
    − Debt to capitalization (65%)
    − Interest coverage (adjusted EBITDA/Interest Expense)
 ~ $175 million of headroom on debt to capitalization covenant at
  December 31, 2011
 Amended Credit Facility in February 2012
    − Debt to capitalization covenant modified to add back ~$250M of Q4 2011
      non-cash charges along with new $250M deductible basket
    − Rollback of step-up on interest coverage covenant until Q1 2013
 As amended, we have ~ $630M of borrowing availability on the line


    Not in default of any covenants at December 31, 2011

                                                                          25
$0
                               $1,200


                 $400
                        $800
     2012
     2013
     2014
     2015
     2016
                                                                  December 31, 2011


     2017
     2018
     2019
     2020
     2021
     2022
     2023
     2024
                                        #REF!


     2025
                                                ($ In Millions)


     2026
     2027
                                                                                      Outstanding Debt Maturities


     2028
     2029
     2030
     2031
     2032
     2033
     2034
     2035
     2036
26
Q4 2011 Results (As Reported)

 ($ in Millions)                                              Net Sales              Change in Sales           Operating Margin *

                                                                                      Q4 2011 vs. Q4
                                                      Q4 2011         Q4 2010             2010               Q4 2011      Q4 2010
  Cabinets and Related Products                      $       287     $        304            -6%              -33.1%      -45.1%

  Plumbing Products                                          674              661            2%                7.7%        9.7%

  Installation and Other Services                            285              254           12%                -2.8%      -282.7%

  Decorative Architectural Products                          348              336            4%               -14.7%       13.4%

  Other Specialty Products                                   144              161           -11%              -279.9%      1.9%

          Total Segment-Reported                     $     1,738     $      1,716            1%               -29.1%      -43.3%

  North America                                      $     1,320     $      1,293            2%               -34.8%      -59.6%

  International                                              418              423            -1%              -11.0%       6.6%

          Total Segment - Reported                   $     1,738     $      1,716            1%               -29.1%      -43.3%


* Operating margin is before general corporate expense, net and litigation charges. See Analyst Package for GAAP
   reconciliation.

                                                                                                                                    27
Q4 2011 Results (As Adjusted)

($ in Millions)
                                                                Net Sales                Change in Sales             Operating Margin *

                                                                                          Q4 2011 vs. Q4
                                                        Q4 2011          Q4 2010              2010                   Q4 2011    Q4 2010
 Cabinets and Related Products                         $        287     $        304             -6%                 -13.2%      -15.1%

 Plumbing Products                                              674              661              2%                  8.3%       10.6%

 Installation and Other Services                                285              254             12%                  -2.1%      -7.5%

 Decorative Architectural Products                              348              336              4%                 10.1%       14.9%

 Other Specialty Products                                       144              161             -11%                 0.0%        1.9%

          Total Segment-Reported                       $     1,738      $      1,716              1%                  2.7%        3.4%

 North America                                         $     1,320      $      1,293              2%                  2.7%        2.1%

 International                                                  418              423             -1%                  2.9%        7.3%

          Total Segment - Adjusted                     $     1,738      $      1,716              1%                  2.7%        3.4%


* Operating margin is before impairment charges for goodwill and other intangible assets, business rationalization
   charges, general corporate expense, net and litigation charges. See Analyst Package for GAAP reconciliation.

                                                                                                                                          28
Full-Year 2011 Results (As Reported)
  ($ in Millions)
                                                                Net Sales               Change in Sales            Operating Margin *

                                                                                          FY 2011 vs. FY
                                                         FY 2011          FY 2010             2010                FY 2011          FY 2010
   Cabinets and Related Products                        $     1,231     $      1,464            -16%              -16.7%           -17.1%

   Plumbing Products                                          2,913            2,692             8%                11.1%           12.3%

   Installation and Other Services                            1,077            1,041             3%                -7.3%           -76.7%

   Decorative Architectural Products                          1,670            1,693            -1%                11.7%           20.4%

   Other Specialty Products                                     576              596            -3%               -69.6%             3.2%
         Total Segment - Reported                       $     7,467     $      7,486            0%                 -2.2%            -4.7%

   North America                                        $     5,669     $      5,823            -3%                -4.6%            -8.7%

   International                                              1,798            1,663             8%                 5.1%            9.3%

           Total Segment - Reported                     $     7,467     $      7,486             0%                -2.2%            -4.7%


* Operating margin is before general corporate expense, net and litigation charges. See Analyst Package for GAAP reconciliation.


                                                                                                                                            29
Full-Year 2011 Results (As Adjusted)

($ in Millions)
                                                             Net Sales                Change in Sales             Operating Margin *

                                                                                       FY 2011 vs. FY
                                                     FY 2011          FY 2010              2010                 FY 2011          FY 2010
 Cabinets and Related Products                      $     1,231      $      1,464            -16%                 -9.3%           -4.8%

 Plumbing Products                                        2,913             2,692              8%                11.6%           12.9%

 Installation and Other Services                          1,077             1,041              3%                 -6.6%           -8.9%

 Decorative Architectural Products                        1,670             1,693             -1%                16.9%           20.7%

 Other Specialty Products                                   576               596             -3%                 0.7%            3.2%
       Total Segment - Reported                     $     7,467      $      7,486              0%                 5.9%            7.4%

 North America                                      $     5,669      $      5,823             -3%                 5.1%            6.6%

 International                                            1,798             1,663              8%                 8.3%           10.0%

        Total Segment - Adjusted                    $     7,467      $      7,486              0%                 5.9%            7.4%


            * Operating margin is before impairment charges for goodwill and other intangible assets, business rationalization
               charges, general corporate expense, net and litigation charges. See Analyst Package for GAAP reconciliation.               30
Q4 2011 Segment Rationalization Charges

                                                             Rationalization Charges - Q4 2011                                      Q4 2010
($ in Millions)
                                                              Plant                                                 Total -          Total -
                                        Severance                              ERP             RTA Exit
                                                            Closures                                               Q4 2011          Q4 2010

Cabinets and Related Products       $           (5) $              (8)     $          -    $               -   $         (13) $           (91)

Plumbing Products                               (2)                (1)                -                    -                  (3)            (5)

Installation and Other Services                 (1)                (1)                -                    -                  (2)            (2)

Decorative Architectural Products                   -             (11)                -                    -             (11)                (5)

Other Specialty Products                            -             (29)                -                    -             (29)                  -

Corp. / Other                                   (3)                    -              -                    -                  (3)            (1)

Total Q4 2011                       $          (11) $             (50)     $          -    $               -   $         (61) $          (104)


Total Q4 2010                       $           (3) $             (78)     $         (2)   $          (21)     $        (104)


Change                              $           (8)     $          28      $          2    $              21   $          43


                                                                                                                                        31
Full-Year 2011 Segment Rationalization Charges

                                                         Rationalization Charges - December 31, 2011                           FY 2010
 ($ in Millions)
                                                                Plant                                          Total - FY     Total - FY
                                         Severance                             ERP             RTA Exit
                                                              Closures                                           2011           2010

 Cabinets and Related Products       $           (6) $              (16) $           (1)   $         (24)      $      (47) $        (179)

 Plumbing Products                               (2)                (13)              -                    -          (15)             (15)

 Installation and Other Services                 (3)                 (1)             (4)                   -            (8)             (8)

 Decorative Architectural Products                   -              (12)              -                    -          (12)              (5)

 Other Specialty Products                            -              (31)              -                    -          (31)                 -

 Corp. / Other                                   (6)                 (2)              -                    -            (8)             (1)

 Total December 31, 2011             $          (17) $              (75) $           (5)   $          (24)     $     (121) $        (208)


 Total December 31, 2010             $          (14)      $        (101)   $         (9)   $          (84)     $     (208)


 Change                              $           (3)      $          26    $          4    $              60   $       87


                                                                                                                                  32
Segment Mix Full-Year 2011 – Estimate

                                                      New
Segment            International   North America
                                                   Construction
Cabinets and           25%             75%          25% - 30%
Related Products
Plumbing               45%             55%          15% - 20%
Products
Installation and        --             100%           80+%
Other Services
Decorative              --             100%            <5%
Architectural
Products
Other Specialty        25%             75%          20% - 25%
Products
Company Total          24%             76%            ~25%


                                                                  33
2011 Masco International Revenue Split*


                                             *Based on company estimates


International sales accounted for ~ 24% of total 2011 Masco sales


                                                                     34

Fourth Quarter 2011 Masco Earnings Presentation

  • 1.
    Fourth Quarter 2011 MascoEarnings Presentation Tuesday, February 14, 2012 8:00 a.m. ET 1
  • 2.
    Written and oralstatements made in this presentation that reflect our views about our future performance constitute "forward-looking statements" under the Private Securities Litigation Reform Act of 1995. Forward- looking statements can be identified by words such as “believe,” “anticipate,” “appear,” “may,” “will,” “should,” “intend,” “plan,” “estimate,” “expect,” “assume,” “seek,” “forecast,” and similar references to future periods. These views involve risks and uncertainties that are difficult to predict and, accordingly, our actual results may differ materially from the results discussed in our forward-looking statements. We caution you against relying on any of these forward-looking statements. Our future performance may be affected by our reliance on new home construction and home improvement, our reliance on key customers, the cost and availability of raw materials, shifts in consumer preferences and purchasing practices, and our ability to achieve cost savings through restructuring and other initiatives. These and other factors are discussed in detail in Item 1A, “Risk Factors” in our Annual Report on Form 10-K, as well as in our Quarterly Reports on Form 10-Q and in other filings we make with the Securities and Exchange Commission. Our forward-looking statements in this presentation speak only as of the date of this presentation. Factors or events that could cause our actual results to differ may emerge from time to time, and it is not possible for us to predict all of them. Unless required by law, we undertake no obligation to update publicly any forward-looking statements as a result of new information, future events or otherwise. Certain of the financial and statistical data included in this presentation and the related materials are non- GAAP financial measures as defined under Regulation G. The Company believes that non-GAAP performance measures and ratios used in managing the business may provide attendees of this presentation with additional meaningful comparisons between current results and results in prior periods. Non-GAAP performance measures and ratios should be viewed in addition to, and not as an alternative for, the Company's reported results under accounting principles generally accepted in the United States. Additional information about the Company is contained in the Company's filings with the SEC and is available on Masco’s Web Site, www.masco.com. 2
  • 3.
    2011 – AChallenging Environment  Flat North American housing environment − Increased mix of multi-family vs. single-family  Difficult European economic conditions − Mix shift from shower systems to faucets and lower price points  Commodity cost pressures  Competitive retail environment − Increased promotional activity Our financial performance was disappointing 3
  • 4.
    Key Financial Data Q4 Q4 Full-Year Full-Year 2011 2010 2011 2010 Net Sales (Millions) $1,738 $1,716 $7,467 $7,486 Adjusted EPS* $(0.09) $(0.08) $.02 $.23 Adjusted Gross Profit Margins* 21.9% 23.5% 25.1% 26.7% Adjusted Operating Margins* 1.6% 1.9% 4.4% 5.9% Working Capital N/A N/A 12.2% 13.4% Free Cash Flow (Millions) N/A N/A $71 $296 $1.7 Billion of cash at December 31, 2011 *(Loss) as reported was $(1.42) per common share and $(2.92) per common share for the fourth quarter of 2011 and 2010, respectively and $(1.34) per common share and $(2.94) per common share for the years ended December 31, 2011 and 2010, respectively. Gross profit margins as reported were 19.1% and 18.0% for the fourth quarter of 2011 and 2010, respectively and 23.9% and 24.5% for the years ended December 31, 2011 and 2010, respectively. Operating margins as reported were (30.6)% and (44.8)% for the fourth quarter of 2011 and 2010, 4 respectively and (4.0)% and (6.2)% for the years ended December 31, 2011 and 2010, respectively.
  • 5.
    We Took Actionsin 2011 to Better Position for the Current Environment and the Recovery  Continued to rationalize our businesses − Closed/consolidated plants − Continued to reduce costs and headcount − Planned disposition of underperforming businesses − Product exits  Completed the major restructuring of our North American Cabinet and Installation businesses  Introduced new products and programs  Invested in future growth opportunities − Including international growth  Improved working capital management  Successfully amended our credit agreement Held or improved share in most major product categories 5
  • 6.
    Cabinets and RelatedProducts Financial Performance Q4 2011 Financial Performance FY 2011 12/31/11 12/31/11 4th QTR vs. Full-Year vs. ($ in Millions) 3 Months Ended 12/31/10 ($ in Millions) 12 Months Ended 12/31/10 12/31/2011 12/31/2010 $ % 12/31/2011 12/31/2010 $ % Net Sales $287 $304 $(17) (6%) Net Sales $1,231 $1,464 $(233) (16%) Operating (Loss)* $(38) $(46) $8 N/A Operating (Loss)* $(115) $(71) $(44) N/A Operating Margin (13.2%) (15.1%) Operating Margin (9.3%) (4.8%) Decremental Margin N/A Decremental Margin (19%) Commentary Brands •Excluding sales related to the exit of certain product lines: •Q4 sales were up 2% •Full-year 2011 sales were down 5% • Operating margins in the segment were impacted by: •Reduced volume and negative mix •Product exit and related loss of leverage •Aggressive promotional activity •Profit improvement initiatives •Unfavorable price/commodity relationship principally in Europe ® *Excludes business rationalization charges of $13M and $91M in the fourth quarters of 2011 & 2010, respectively and $47M and $179M for the full-year 2011 and 2010, respectively. Also excludes goodwill impairment charge of $44M in 2011. See Analyst Package for GAAP reconciliation. 6
  • 7.
    2012 Outlook -Cabinets Estimated Improvement (in Millions) Sales Operating Profit 2011 Total Segment $1,230 ($115) 1 Less: 2011 International ($370) ($40) 2011 North America Cabinet Actual $860 ($75) Product Exit (10) $13 2011 N.A. Operating Loss ($62) 2 2012 Profit Improvements, Net $30 2 2012 Revenue Opportunities, Net $30 $10 2012 N.A. Cabinet Estimate $880 ($22) 1 Uncertain economic environments, identified cost reductions of ~$7M net in 2012 2 Management estimates *Assumptions: Opportunities: • Reflects a flat retail and housing start environment of • Adding new dealers and additional brands with existing 600k starts with constant mix dealers in 2011 starting to show solid results • Every 50k increase in lagged US starts = ~$25M in • New 2011 vanity/top programs at retail now generating revenues (assuming constant mix) which converts to ~$8- growth opportunities $10M in profits • New 2011 kitchen countertop program at retail expanding throughout the East Coast 7
  • 8.
    Installation and OtherServices Financial Performance Q4 2011 Financial Performance FY 2011 12/31/11 12/31/11 4th QTR vs. Full-Year vs. ($ in Millions) 3 Months Ended 12/31/10 ($ in Millions) 12 Months Ended 12/31/10 12/31/2011 12/31/2010 $ % 12/31/2011 12/31/2010 $ % Net Sales $285 $254 $31 12% Net Sales $1,077 $1,041 $36 3% Operating (Loss)* $(6) $(19) $13 N/A Operating (Loss)* $(71) $(93) $22 N/A Operating Margin (2.1%) (7.5%) Operating Margin (6.6%) (8.9%) Incremental Margin 42% Incremental Margin 61% Commentary Businesses •Full-year and Q4 sales benefitted from residential insulation share gains and expansion of the retrofit and commercial businesses ® •Q4 sales also benefitted from an increase in lagged housing starts of 6% ® •Sales were negatively impacted by a shift from single-family to multi- family units ® •Operating margins were favorably impacted by: •Incremental volume •Profit improvement initiatives *Excludes business rationalization charges of $2M in each of the fourth quarters of 2011 and 2010 and $8M in each of the full-year 2011 and 2010. Also excludes goodwill impairment charges of $697M in 8 2010. See Analyst Package for GAAP reconciliation.
  • 9.
    2012 Outlook –Installation Estimated Improvement Sales (in Millions) Sales Operating Profit 2011 Total Segment $1,077 ($71) 2011 Branch Closures ($30) $6 2011 Adjusted Segment $1,047 ($65) 1 2012 Profit Improvements, Net $20 1 2012 Revenue Opportunities, Net $40 $10 2012 Installation Segment Estimate $1,087 ($35) 1 Management Estimates *Assumptions Opportunities: • Reflects a flat housing start environment of 600k starts • Segment continues to add profitable retrofit with constant mix and residential/commercial business • Every 50k increase in lagged US starts = ~$50M in • Further cost reductions from lean revenues (assuming constant mix) which converts to implementation, ERP leverage, vendor ~$12M-$15M in profits partnership and supply chain benefits 9
  • 10.
    Plumbing Products Financial PerformanceQ4 2011 Financial Performance FY 2011 12/31/11 12/31/11 4th QTR vs. Full-Year vs. ($ in Millions) 3 Months Ended 12/31/10 ($ in Millions) 12 Months Ended 12/31/10 12/31/2011 12/31/2010 $ % 12/31/2011 12/31/2010 $ % Net Sales $674 $661 $13 2% Net Sales $2,913 $2,692 $221 8% Operating Profit* $56 $70 $(14) N/A Operating Profit* $338 $347 $(9) N/A Operating Margin 8.3% 10.6% Operating Margin 11.6% 12.9% Decremental Margin N/A Decremental Margin N/A Commentary Brands •Sales increases were driven by: •Volume (full-year) and price increases •Positive effect of currency (full-year) •Operating margins were impacted by: •Price/commodity relationships which were positive in the quarter but are negative for the full-year •Unfavorable product mix ® •New program costs •Strategic growth spend *Excludes business rationalization charges of $3M & $5M in the fourth quarters of 2011 & 2010, respectively and $15M in each of the full-year 2011 and 2010. Also excludes goodwill impairment charges of $1M in each of 2011 & 2010. See Analyst Package for GAAP reconciliation. 10
  • 11.
    2012 Outlook -Plumbing Products  Focus on total cost productivity − Commodity cost management  Executing on growth opportunities − International expansion − North American Retail  Enhancing and leveraging brand equity − Growing share through leveraging our leadership brands 11
  • 12.
    Decorative Architectural Products FinancialPerformance Q4 2011 Financial Performance FY 2011 12/31/11 12/31/11 4th QTR vs. Full-Year vs. ($ in Millions) 3 Months Ended 12/31/10 ($ in Millions) 12 Months Ended 12/31/10 12/31/2011 12/31/2010 $ % 12/31/2011 12/31/2010 $ % Net Sales $348 $336 $12 4% Net Sales $1,670 $1,693 $(23) (1%) Operating Profit* $35 $50 $(15) N/A Operating Profit* $283 $350 $(67) N/A Operating Margin 10.1% 14.9% Operating Margin 16.9% 20.7% Decremental Margin N/A Decremental Margin (291%) Commentary Brands • Full-year and Q4 sales were impacted by: • Reduced volumes, including the loss of Wal-Mart paint and hardware business • Price increases • Operating margins were negatively impacted in both the quarter and full-year by: • Volume declines • Unfavorable price/commodity relationships • Unfavorable mix • Strategic growth spend and program costs *Excludes business rationalization charges of $11M & $5M for the fourth quarters of 2011 and 2010, respectively and $12M & $5M for the full-year 2011 and 2010, respectively. Also excludes goodwill impairment charges of $75M in 2011. 12 See Analyst Package for GAAP reconciliation.
  • 13.
    2012 Outlook -Decorative Architectural Products  Focus on total cost productivity − Commodity cost management  Executing on growth opportunities − Enhance the Core − Grow the Pro − International growth  Enhancing and leveraging brand equity − New product introductions − Quality leadership 13
  • 14.
    Other Specialty Products FinancialPerformance Q4 2011 Financial Performance FY 2011 12/31/11 12/31/11 4th QTR vs. Full-Year vs. ($ in Millions) 3 Months Ended 12/31/10 ($ in Millions) 12 Months Ended 12/31/10 12/31/2011 12/31/2010 $ % 12/31/2011 12/31/2010 $ % Net Sales $144 $161 $(17) (11%) Net Sales $576 $596 $(20) (3%) Operating Profit $ --- $3 $(3) N/A Operating Profit $4 $19 $(15) N/A Operating Margin ---% 1.9% Operating Margin 0.7% 3.2% Decremental Margin (18%) Decremental Margin (75%) Commentary Brands •Full-Year and Q4 sales reflect: •Lower sales volume of windows in North America (principally due to the expiration of the tax credit in 2010) which more ® than offset share gains from new products and geographies •Operating margins were impacted by (both Q4 & full-year): • Volume decreases • New product launch and geographic expansion costs • Unfavorable product mix • Favorable price/commodity relationship • Profit improvement initiatives *Excludes business rationalization charges of $29M for the fourth quarter of 2011 and $31M for the full-year 2011. Also 14 excludes goodwill impairment charges of $374M in 2011. See Analyst Package for GAAP reconciliation.
  • 15.
    2012 Outlook -Other Specialty Products  Focus on total cost productivity − Realize benefits from Q4 2011 plant closures  Executing on growth opportunities − Texas and Western Canada expansion − Expanding at Retail in UK and US  Enhancing and leveraging brand equity − Leveraging Essence launch 15
  • 16.
    2012 Guidance Estimates ($ in Millions) 2012 Estimate 2011 Actual Rationalization Charges* ~ $20 $121 Tax Rate** ~ 50% 18% Interest Expense ~ $260 $254 General Corp. Expense ~ $140 $118 Capital Expenditures ~ $180 $151 Depreciation & Amortization ~ $220 $263*** Outstanding Shares 348 million 348 million *Based on current business plans. **Tax rate for 2011 excludes the valuation allowance on the Federal deferred income tax assets and the impairment charge for goodwill and other intangible assets. ***2011 includes $58M of accelerated depreciation, which is also included in the rationalization charges. 16
  • 17.
    2012 Strategic Initiatives 1 • Leverage brands Expand market leadership • Innovative products 2 • Total cost productivity Reduce costs • Drive lean benefits Outperform the 3 • Focus on Cabinets, recovery Improve Installation underperforming businesses • Return to profitability 4 • Debt reduction Strengthen • Credit facility amendment Balance Sheet 17
  • 18.
  • 19.
  • 20.
    Q4 2011 EPS Reconciliation (in Millions) Q4 2011 Q4 2010 Loss from Continuing Operations before Income Taxes – As Reported $ (593) $ (824) Rationalization Charges 61 104 Impairment of goodwill and other intangible assets 494 698 Litigation Charge 3 - Financial Investment (Income) Expense (4) (10) Loss from Continuing Operations before Income Taxes – As Adjusted (39) (32) Tax at 36% rate benefit (expense) 14 12 Less: Net income attributable to non-controlling interest (5) (9) Net Loss – as adjusted $ (30) $ (29) Loss per common share – as adjusted $ (0.09) $ (0.08) Shares 348 349 20
  • 21.
    Full-Year 2011 EPS Reconciliation ($in Millions) YTD 12/31/11 YTD 12/31/10 Loss from Continuing Operations before Income Taxes – As Reported $ (472) $ (741) Rationalization Charges 121 208 Impairment of goodwill and other intangible assets 494 698 Litigation Charge 9 - Financial Investment (Income) Expense (73) 25 Income from Continuing Operations before Income Taxes – As Adjusted 79 190 Tax at 36% rate (28) (68) Less: Net income attributable to non-controlling interest (42) (41) Net Income – as adjusted $ 9 $ 81 Earnings per common share – as adjusted $ 0.02 $ 0.23 Shares 348 349 21
  • 22.
    Q4 2011 Profit Reconciliation ($ in Millions) Q4 2011 Q4 2010 Sales $ 1,738 $ 1,716 Gross Profit – As Reported $ 332 $ 309 Rationalization Charges 48 95 Gross Profit – As Adjusted $ 380 $ 404 Gross Margin - As Reported 19.1% 18.0% Gross Margin - As Adjusted 21.9% 23.5% Operating Loss – As Reported $ (531) $ (769) Rationalization Charges 61 104 Impairment of goodwill and other intangible assets 494 698 Litigation Charge 3 - Operating Profit – As Adjusted $ 27 $ 33 Operating Margin - As Reported -30.6% -44.8% Operating Margin - As Adjusted 1.6% 1.9% 22
  • 23.
    Full-Year 2011 Profit Reconciliation ($ in Millions) YTD 12/31/11 YTD 12/31/10 Sales $ 7,467 $ 7,486 Gross Profit – As Reported $ 1,784 $ 1,833 Rationalization Charges 91 166 Gross Profit – As Adjusted $ 1,875 $ 1,999 Gross Margin - As Reported 23.9% 24.5% Gross Margin - As Adjusted 25.1% 26.7% Operating (Loss) Profit – As Reported $ (295) $ (463) Rationalization Charges 121 208 Impairment of goodwill and other intangible assets 494 698 Litigation Charges 9 - Operating Profit – As Adjusted $ 329 $ 443 Operating Margin - As Reported -4.0% -6.2% Operating Margin - As Adjusted 4.4% 6.0% 23
  • 24.
    2011 Impairment ofGoodwill and Other Intangible Assets  Goodwill/intangible asset impairment of $494 million, primarily related to: − Milgard Manufacturing, our North American window business − Tvilum, our European ready-to-assemble cabinet business − Liberty, our North American builders’ hardware business  Non-cash charge aggregated ($0.96) per common share Successfully Amended our Credit Line 24
  • 25.
    Credit Facility Amendment $1.25 billion line established in June 2010 with two financial covenants − Debt to capitalization (65%) − Interest coverage (adjusted EBITDA/Interest Expense)  ~ $175 million of headroom on debt to capitalization covenant at December 31, 2011  Amended Credit Facility in February 2012 − Debt to capitalization covenant modified to add back ~$250M of Q4 2011 non-cash charges along with new $250M deductible basket − Rollback of step-up on interest coverage covenant until Q1 2013  As amended, we have ~ $630M of borrowing availability on the line Not in default of any covenants at December 31, 2011 25
  • 26.
    $0 $1,200 $400 $800 2012 2013 2014 2015 2016 December 31, 2011 2017 2018 2019 2020 2021 2022 2023 2024 #REF! 2025 ($ In Millions) 2026 2027 Outstanding Debt Maturities 2028 2029 2030 2031 2032 2033 2034 2035 2036 26
  • 27.
    Q4 2011 Results(As Reported) ($ in Millions) Net Sales Change in Sales Operating Margin * Q4 2011 vs. Q4 Q4 2011 Q4 2010 2010 Q4 2011 Q4 2010 Cabinets and Related Products $ 287 $ 304 -6% -33.1% -45.1% Plumbing Products 674 661 2% 7.7% 9.7% Installation and Other Services 285 254 12% -2.8% -282.7% Decorative Architectural Products 348 336 4% -14.7% 13.4% Other Specialty Products 144 161 -11% -279.9% 1.9% Total Segment-Reported $ 1,738 $ 1,716 1% -29.1% -43.3% North America $ 1,320 $ 1,293 2% -34.8% -59.6% International 418 423 -1% -11.0% 6.6% Total Segment - Reported $ 1,738 $ 1,716 1% -29.1% -43.3% * Operating margin is before general corporate expense, net and litigation charges. See Analyst Package for GAAP reconciliation. 27
  • 28.
    Q4 2011 Results(As Adjusted) ($ in Millions) Net Sales Change in Sales Operating Margin * Q4 2011 vs. Q4 Q4 2011 Q4 2010 2010 Q4 2011 Q4 2010 Cabinets and Related Products $ 287 $ 304 -6% -13.2% -15.1% Plumbing Products 674 661 2% 8.3% 10.6% Installation and Other Services 285 254 12% -2.1% -7.5% Decorative Architectural Products 348 336 4% 10.1% 14.9% Other Specialty Products 144 161 -11% 0.0% 1.9% Total Segment-Reported $ 1,738 $ 1,716 1% 2.7% 3.4% North America $ 1,320 $ 1,293 2% 2.7% 2.1% International 418 423 -1% 2.9% 7.3% Total Segment - Adjusted $ 1,738 $ 1,716 1% 2.7% 3.4% * Operating margin is before impairment charges for goodwill and other intangible assets, business rationalization charges, general corporate expense, net and litigation charges. See Analyst Package for GAAP reconciliation. 28
  • 29.
    Full-Year 2011 Results(As Reported) ($ in Millions) Net Sales Change in Sales Operating Margin * FY 2011 vs. FY FY 2011 FY 2010 2010 FY 2011 FY 2010 Cabinets and Related Products $ 1,231 $ 1,464 -16% -16.7% -17.1% Plumbing Products 2,913 2,692 8% 11.1% 12.3% Installation and Other Services 1,077 1,041 3% -7.3% -76.7% Decorative Architectural Products 1,670 1,693 -1% 11.7% 20.4% Other Specialty Products 576 596 -3% -69.6% 3.2% Total Segment - Reported $ 7,467 $ 7,486 0% -2.2% -4.7% North America $ 5,669 $ 5,823 -3% -4.6% -8.7% International 1,798 1,663 8% 5.1% 9.3% Total Segment - Reported $ 7,467 $ 7,486 0% -2.2% -4.7% * Operating margin is before general corporate expense, net and litigation charges. See Analyst Package for GAAP reconciliation. 29
  • 30.
    Full-Year 2011 Results(As Adjusted) ($ in Millions) Net Sales Change in Sales Operating Margin * FY 2011 vs. FY FY 2011 FY 2010 2010 FY 2011 FY 2010 Cabinets and Related Products $ 1,231 $ 1,464 -16% -9.3% -4.8% Plumbing Products 2,913 2,692 8% 11.6% 12.9% Installation and Other Services 1,077 1,041 3% -6.6% -8.9% Decorative Architectural Products 1,670 1,693 -1% 16.9% 20.7% Other Specialty Products 576 596 -3% 0.7% 3.2% Total Segment - Reported $ 7,467 $ 7,486 0% 5.9% 7.4% North America $ 5,669 $ 5,823 -3% 5.1% 6.6% International 1,798 1,663 8% 8.3% 10.0% Total Segment - Adjusted $ 7,467 $ 7,486 0% 5.9% 7.4% * Operating margin is before impairment charges for goodwill and other intangible assets, business rationalization charges, general corporate expense, net and litigation charges. See Analyst Package for GAAP reconciliation. 30
  • 31.
    Q4 2011 SegmentRationalization Charges Rationalization Charges - Q4 2011 Q4 2010 ($ in Millions) Plant Total - Total - Severance ERP RTA Exit Closures Q4 2011 Q4 2010 Cabinets and Related Products $ (5) $ (8) $ - $ - $ (13) $ (91) Plumbing Products (2) (1) - - (3) (5) Installation and Other Services (1) (1) - - (2) (2) Decorative Architectural Products - (11) - - (11) (5) Other Specialty Products - (29) - - (29) - Corp. / Other (3) - - - (3) (1) Total Q4 2011 $ (11) $ (50) $ - $ - $ (61) $ (104) Total Q4 2010 $ (3) $ (78) $ (2) $ (21) $ (104) Change $ (8) $ 28 $ 2 $ 21 $ 43 31
  • 32.
    Full-Year 2011 SegmentRationalization Charges Rationalization Charges - December 31, 2011 FY 2010 ($ in Millions) Plant Total - FY Total - FY Severance ERP RTA Exit Closures 2011 2010 Cabinets and Related Products $ (6) $ (16) $ (1) $ (24) $ (47) $ (179) Plumbing Products (2) (13) - - (15) (15) Installation and Other Services (3) (1) (4) - (8) (8) Decorative Architectural Products - (12) - - (12) (5) Other Specialty Products - (31) - - (31) - Corp. / Other (6) (2) - - (8) (1) Total December 31, 2011 $ (17) $ (75) $ (5) $ (24) $ (121) $ (208) Total December 31, 2010 $ (14) $ (101) $ (9) $ (84) $ (208) Change $ (3) $ 26 $ 4 $ 60 $ 87 32
  • 33.
    Segment Mix Full-Year2011 – Estimate New Segment International North America Construction Cabinets and 25% 75% 25% - 30% Related Products Plumbing 45% 55% 15% - 20% Products Installation and -- 100% 80+% Other Services Decorative -- 100% <5% Architectural Products Other Specialty 25% 75% 20% - 25% Products Company Total 24% 76% ~25% 33
  • 34.
    2011 Masco InternationalRevenue Split* *Based on company estimates International sales accounted for ~ 24% of total 2011 Masco sales 34