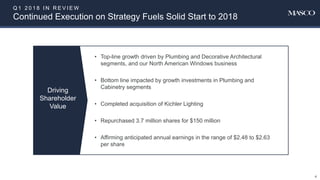
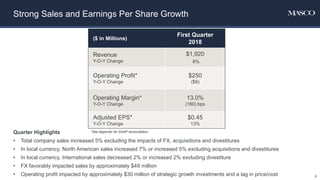
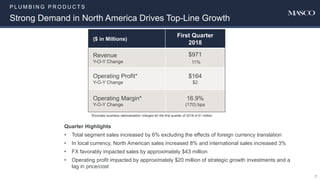
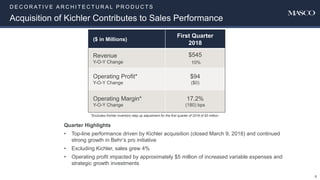
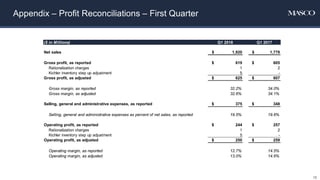
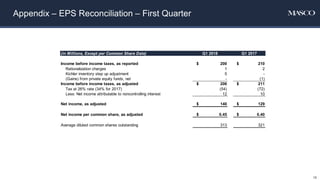
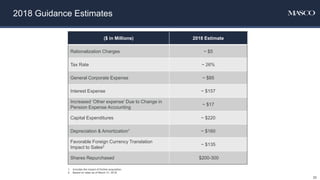
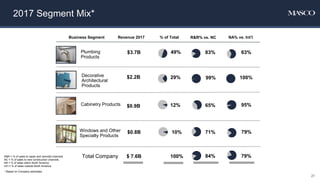
Masco Corporation
First Quarter 2018 Earnings Presentation
April 24, 2018
Safe Harbor Statement
This presentation contains statements that reflect our views about our future performance and constitute “forward-
looking statements” under the Private Securities Litigation Reform Act of 1995. Forward-looking statements can be
identified by words such as “outlook,” “believe,” “anticipate,” “appear,” “may,” “will,” “should,” “intend,” “plan,” “estimate,”
“expect,” “assume,” “seek,” “forecast,” and similar references to future periods. Our views about future performance
involve risks and uncertainties that are difficult to predict and, accordingly, our actual results may differ materially from
the results discussed in our forward-looking statements. We caution you against relying on any of these forward-looking
statements.
Our future performance may be affected by the levels of residential repair and remodel activity and new home
construction, our ability to maintain our strong brands and reputation and to develop new products, our ability to
maintain our competitive position in our industries, our reliance on key customers, the cost and availability of raw
materials, our dependence on third-party suppliers, risks associated with international operations and global strategies,
our ability to achieve the anticipated benefits of our strategic initiatives, our ability to successfully execute our acquisition
strategy and integrate businesses that we have and may acquire, our ability to attract, develop and retain talented
personnel, our ability to achieve the anticipated benefits from our investments in new technology, risks associated with
our reliance on information systems and technology, and our ability to sustain the improved results of our U.S. window
business. These and other factors are discussed in detail in Item 1A, “Risk Factors” in our most recent Annual Report on
Form 10-K, as well as in our Quarterly Reports on Form 10-Q and in other filings we make with the Securities and
Exchange Commission. Any forward-looking statement made by us speaks only as of the date on which it was made.
Factors or events that could cause our actual results to differ may emerge from time to time, and it is not possible for us
to predict all of them. Unless required by law, we undertake no obligation to update publicly any forward-looking
statements as a result of new information, future events or otherwise.
2
Masco Q1 2018 Results
Topic
• Summary of Results Keith Allman
• Financial/Operations Review John Sznewajs
• Q&A
3
Q 1 2 0 1 8 I N R E V I E W
Continued Execution on Strategy Fuels Solid Start to 2018
• Top-line growth driven by Plumbing and Decorative Architectural
segments, and our North American Windows business
• Bottom line impacted by growth investments in Plumbing and
Cabinetry segments
• Completed acquisition of Kichler Lighting
• Repurchased 3.7 million shares for $150 million
• Affirming anticipated annual earnings in the range of $2.48 to $2.63
per share
Driving
Shareholder
Value
4
Topic
• Summary of Results Keith Allman
• Financial/Operations Review John Sznewajs
• Q&A
Masco Q1 2018 Results
5
($ in Millions)
First Quarter
2018
Revenue
Y-O-Y Change
$1,920
8%
Operating Profit*
Y-O-Y Change
$250
($9)
Operating Margin*
Y-O-Y Change
13.0%
(160) bps
Adjusted EPS*
Y-O-Y Change
$0.45
13%
Strong Sales and Earnings Per Share Growth
*See Appendix for GAAP reconciliation.Quarter Highlights
• Total company sales increased 5% excluding the impacts of FX, acquisitions and divestitures
• In local currency, North American sales increased 7% or increased 5% excluding acquisitions and divestitures
• In local currency, International sales decreased 2% or increased 2% excluding divestiture
• FX favorably impacted sales by approximately $49 million
• Operating profit impacted by approximately $30 million of strategic growth investments and a lag in price/cost 6
P L U M B I N G P R O D U C T S
Strong Demand in North America Drives Top-Line Growth
7
($ in Millions)
First Quarter
2018
Revenue
Y-O-Y Change
$971
11%
Operating Profit*
Y-O-Y Change
$164
$2
Operating Margin*
Y-O-Y Change
16.9%
(170) bps
*Excludes business rationalization charges for the first quarter of 2018 of $1 million.
Quarter Highlights
• Total segment sales increased by 6% excluding the effects of foreign currency translation
• In local currency, North American sales increased 8% and international sales increased 3%
• FX favorably impacted sales by approximately $43 million
• Operating profit impacted by approximately $20 million of strategic growth investments and a
lag in price/cost
D E C O R AT I V E A R C H I T E C T U R A L P R O D U C T S
Acquisition of Kichler Contributes to Sales Performance
8
($ in Millions)
First Quarter
2018
Revenue
Y-O-Y Change
$545
10%
Operating Profit*
Y-O-Y Change
$94
($0)
Operating Margin*
Y-O-Y Change
17.2%
(180) bps
Quarter Highlights
• Top-line performance driven by Kichler acquisition (closed March 9, 2018) and continued
strong growth in Behr’s pro initiative
• Excluding Kichler, sales grew 4%
• Operating profit impacted by approximately $5 million of increased variable expenses and
strategic growth investments
*Excludes Kichler inventory step up adjustment for the first quarter of 2018 of $5 million.
C A B I N E T R Y P R O D U C T S
Strong Growth in Repair and Remodel Business
9
($ in Millions)
First Quarter
2018
Revenue
Y-O-Y Change
$217
(6%)
Operating Profit
Y-O-Y Change*
$6
($12)
Operating Margin
Y-O-Y Change*
2.8%
(500) bps
*Excludes business rationalization charges for the first quarter of 2017 of $2 million.
Quarter Highlights
• Segment sales decreased 1% excluding the divestiture of Moores
• Repair and remodel business achieved mid-single digit growth
• Operating profit impacted by investment spend of approximately $10 million due to the
roll out of the Cardell® cabinetry program at Menards
W I N D O W S A N D O T H E R S P E C I A LT Y P R O D U C T S
Milgard Windows Achieves Outstanding Top-Line Growth
10
($ in Millions)
First Quarter
2018
Revenue
Y-O-Y Change
$187
4%
Operating Profit
Y-O-Y Change
$4
($4)
Operating Margin
Y-O-Y Change
2.1%
(240) bps
Quarter Highlights
• Segment sales increased 12% excluding the divestiture of Arrow Fastener
• Milgard Windows achieved mid-teens sales growth
• Operating profit impacted by Arrow divestiture and restructuring costs in our UK window operation
Strong Balance Sheet
Liquidity as of 3/31/2018
Cash and cash investments $0.4B
Short-term bank deposits $0.1B
Total $0.5B
Disciplined Capital Allocation
• Repurchased approximately 3.7 million shares in Q1 for $150 million
• Repatriated approximately $425 million to partially fund Kichler acquisition
• Achieved investment grade rating by Moody’s
11
Masco Q1 2018 Results
12
Topic
• Summary of Results Keith Allman
• Financial/Operations Review John Sznewajs
• Q&A
Q&A
Appendix
Appendix – Profit Reconciliations – First Quarter
15
($ in Millions) Q1 2018 Q1 2017
Net sales $ 1,920 $ 1,778
Gross profit, as reported $ 619 $ 605
Rationalization charges 1 2
Kichler inventory step up adjustment 5 -
Gross profit, as adjusted $ 625 $ 607
Gross margin, as reported 32.2% 34.0%
Gross margin, as adjusted 32.6% 34.1%
Selling, general and administrative expenses, as reported $ 375 $ 348
Selling, general and administrative expenses as percent of net sales, as reported 19.5% 19.6%
Operating profit, as reported $ 244 $ 257
Rationalization charges 1 2
Kichler inventory step up adjustment 5 -
Operating profit, as adjusted $ 250 $ 259
Operating margin, as reported 12.7% 14.5%
Operating margin, as adjusted 13.0% 14.6%
Appendix – EPS Reconciliation – First Quarter
16
(in Millions, Except per Common Share Data) Q1 2018 Q1 2017
Income before income taxes, as reported $ 200 $ 210
Rationalization charges 1 2
Kichler inventory step up adjustment 5 -
(Gains) from private equity funds, net - (1)
Income before income taxes, as adjusted $ 206 $ 211
Tax at 26% rate (34% for 2017) (54) (72)
Less: Net income attributable to noncontrolling interest 12 10
Net income, as adjusted $ 140 $ 129
Net income per common share, as adjusted $ 0.45 $ 0.40
Average diluted common shares outstanding 313 321
Appendix – EPS Reconciliation – Remaining 2017 Periods
17
(in Millions, Except per Common Share Data) Q2 2017 Q3 2017 Q4 2017 Full Year 2017
Income before income taxes, as recasted $ 262 $ 264 $ 148 $ 884
Rationalization charges - 1 1 4
(Gains) from private equity funds, net (1) - (1) (3)
(Earnings) from equity investments, net (1) - - (1)
Impairment of private equity funds - 2 - 2
Loss on extinguishment of debt 107 - - 107
(Gain) loss on sales of businesses, net (49) (2) 64 13
Income before income taxes, as adjusted $ 318 $ 265 $ 212 $ 1,006
Tax at 34% rate (108) (90) (72) (342)
Less: Net income attributable to noncontrolling interest 13 12 12 47
Net income, as adjusted $ 197 $ 163 $ 128 $ 617
Net income per common share, as recasted and
adjusted $ 0.62 $ 0.52 $ 0.41 $ 1.94
Average diluted common shares outstanding 319 316 314 318
Appendix – 2018 EPS Outlook Reconciliation
18
Low End High End
Net income per common share 2.36$ 2.51$
Rationalization charges 0.01 0.01
Kichler inventory step up adjustment 0.09 0.09
Allocation to participating securities per share (1) 0.02 0.02
Net income per common share, as adjusted 2.48$ 2.63$
Twelve Months Ended
December 31, 2018
(1) Represents the impact of distributed dividends and undistributed earnings to unvested restricted
stock awards in accordance with the two-class method of calculating earnings per share.
19
2017 RESTATEMENTS
Reflecting impact of revenue recognition and pension accounting changes
2017 NET SALES, as recasted Q1 Q2 Q3 Q4 Full Year
Plumbing Products $872 $949 $950 $961 $3,732
Decorative Architectural Products 496 661 562 487 2,206
Cabinetry Products 231 251 229 223 934
Windows & Other Specialty Products 179 205 204 182 770
Total Net Sales $1,778 $2,066 $1,945 $1,853 $7,642
2017 OPERATING PROFIT, as
recasted
Q1 Q2 Q3 Q4 Full Year
Plumbing Products $162 $200 $175 $165 $702
Decorative Architectural Products 94 149 112 83 438
Cabinetry Products 16 31 20 25 92
Windows & Other Specialty Products 8 18 24 4 54
General Corporate Expense, Net (23) (26) (22) (21) (92)
Total Operating Profit $257 $372 $309 $256 $1,194
2017 EPS, as recasted and
adjusted
Q1 Q2 Q3 Q4 Full Year
Net income per common share $0.40 $0.62 $0.52 $0.41 $1.94
($ in Millions, except EPS)
($ in Millions) 2018 Estimate
Rationalization Charges ~ $5
Tax Rate ~ 26%
General Corporate Expense ~ $85
Interest Expense ~ $157
Increased ‘Other expense’ Due to Change in
Pension Expense Accounting
~ $17
Capital Expenditures ~ $220
Depreciation & Amortization1 ~ $160
Favorable Foreign Currency Translation
Impact to Sales2 ~ $135
Shares Repurchased $200-300
2018 Guidance Estimates
20
1. Includes the impact of Kichler acquisition.
2. Based on rates as of March 31, 2018.
2017 Segment Mix*
R&R = % of sales to repair and remodel channels
NC = % of sales to new construction channels
NA = % of sales within North America
Int’l = % of sales outside North America
* Based on Company estimates
Business Segment
Plumbing
Products
Decorative
Architectural
Products
$3.7B
$2.2B
Revenue 2017 % of Total
49%
29%
$ 7.6B 100%Total Company
Windows and Other
Specialty Products
$0.8B 10%
R&R% vs. NC NA% vs. Int’l
83% 63%
99% 100%
71% 79%
84% 79%
Cabinetry Products $0.9B 12% 65% 95%
21
2017 Geographic Revenue Split*
*Based on Company estimates
International Sales Accounted for ~21%
of Total 2017 Masco Sales
22

Q1 2018 earnings final (002)

  • 1.
    Masco Corporation First Quarter2018 Earnings Presentation April 24, 2018
  • 2.
    Safe Harbor Statement Thispresentation contains statements that reflect our views about our future performance and constitute “forward- looking statements” under the Private Securities Litigation Reform Act of 1995. Forward-looking statements can be identified by words such as “outlook,” “believe,” “anticipate,” “appear,” “may,” “will,” “should,” “intend,” “plan,” “estimate,” “expect,” “assume,” “seek,” “forecast,” and similar references to future periods. Our views about future performance involve risks and uncertainties that are difficult to predict and, accordingly, our actual results may differ materially from the results discussed in our forward-looking statements. We caution you against relying on any of these forward-looking statements. Our future performance may be affected by the levels of residential repair and remodel activity and new home construction, our ability to maintain our strong brands and reputation and to develop new products, our ability to maintain our competitive position in our industries, our reliance on key customers, the cost and availability of raw materials, our dependence on third-party suppliers, risks associated with international operations and global strategies, our ability to achieve the anticipated benefits of our strategic initiatives, our ability to successfully execute our acquisition strategy and integrate businesses that we have and may acquire, our ability to attract, develop and retain talented personnel, our ability to achieve the anticipated benefits from our investments in new technology, risks associated with our reliance on information systems and technology, and our ability to sustain the improved results of our U.S. window business. These and other factors are discussed in detail in Item 1A, “Risk Factors” in our most recent Annual Report on Form 10-K, as well as in our Quarterly Reports on Form 10-Q and in other filings we make with the Securities and Exchange Commission. Any forward-looking statement made by us speaks only as of the date on which it was made. Factors or events that could cause our actual results to differ may emerge from time to time, and it is not possible for us to predict all of them. Unless required by law, we undertake no obligation to update publicly any forward-looking statements as a result of new information, future events or otherwise. 2
  • 3.
    Masco Q1 2018Results Topic • Summary of Results Keith Allman • Financial/Operations Review John Sznewajs • Q&A 3
  • 4.
    Q 1 20 1 8 I N R E V I E W Continued Execution on Strategy Fuels Solid Start to 2018 • Top-line growth driven by Plumbing and Decorative Architectural segments, and our North American Windows business • Bottom line impacted by growth investments in Plumbing and Cabinetry segments • Completed acquisition of Kichler Lighting • Repurchased 3.7 million shares for $150 million • Affirming anticipated annual earnings in the range of $2.48 to $2.63 per share Driving Shareholder Value 4
  • 5.
    Topic • Summary ofResults Keith Allman • Financial/Operations Review John Sznewajs • Q&A Masco Q1 2018 Results 5
  • 6.
    ($ in Millions) FirstQuarter 2018 Revenue Y-O-Y Change $1,920 8% Operating Profit* Y-O-Y Change $250 ($9) Operating Margin* Y-O-Y Change 13.0% (160) bps Adjusted EPS* Y-O-Y Change $0.45 13% Strong Sales and Earnings Per Share Growth *See Appendix for GAAP reconciliation.Quarter Highlights • Total company sales increased 5% excluding the impacts of FX, acquisitions and divestitures • In local currency, North American sales increased 7% or increased 5% excluding acquisitions and divestitures • In local currency, International sales decreased 2% or increased 2% excluding divestiture • FX favorably impacted sales by approximately $49 million • Operating profit impacted by approximately $30 million of strategic growth investments and a lag in price/cost 6
  • 7.
    P L UM B I N G P R O D U C T S Strong Demand in North America Drives Top-Line Growth 7 ($ in Millions) First Quarter 2018 Revenue Y-O-Y Change $971 11% Operating Profit* Y-O-Y Change $164 $2 Operating Margin* Y-O-Y Change 16.9% (170) bps *Excludes business rationalization charges for the first quarter of 2018 of $1 million. Quarter Highlights • Total segment sales increased by 6% excluding the effects of foreign currency translation • In local currency, North American sales increased 8% and international sales increased 3% • FX favorably impacted sales by approximately $43 million • Operating profit impacted by approximately $20 million of strategic growth investments and a lag in price/cost
  • 8.
    D E CO R AT I V E A R C H I T E C T U R A L P R O D U C T S Acquisition of Kichler Contributes to Sales Performance 8 ($ in Millions) First Quarter 2018 Revenue Y-O-Y Change $545 10% Operating Profit* Y-O-Y Change $94 ($0) Operating Margin* Y-O-Y Change 17.2% (180) bps Quarter Highlights • Top-line performance driven by Kichler acquisition (closed March 9, 2018) and continued strong growth in Behr’s pro initiative • Excluding Kichler, sales grew 4% • Operating profit impacted by approximately $5 million of increased variable expenses and strategic growth investments *Excludes Kichler inventory step up adjustment for the first quarter of 2018 of $5 million.
  • 9.
    C A BI N E T R Y P R O D U C T S Strong Growth in Repair and Remodel Business 9 ($ in Millions) First Quarter 2018 Revenue Y-O-Y Change $217 (6%) Operating Profit Y-O-Y Change* $6 ($12) Operating Margin Y-O-Y Change* 2.8% (500) bps *Excludes business rationalization charges for the first quarter of 2017 of $2 million. Quarter Highlights • Segment sales decreased 1% excluding the divestiture of Moores • Repair and remodel business achieved mid-single digit growth • Operating profit impacted by investment spend of approximately $10 million due to the roll out of the Cardell® cabinetry program at Menards
  • 10.
    W I ND O W S A N D O T H E R S P E C I A LT Y P R O D U C T S Milgard Windows Achieves Outstanding Top-Line Growth 10 ($ in Millions) First Quarter 2018 Revenue Y-O-Y Change $187 4% Operating Profit Y-O-Y Change $4 ($4) Operating Margin Y-O-Y Change 2.1% (240) bps Quarter Highlights • Segment sales increased 12% excluding the divestiture of Arrow Fastener • Milgard Windows achieved mid-teens sales growth • Operating profit impacted by Arrow divestiture and restructuring costs in our UK window operation
  • 11.
    Strong Balance Sheet Liquidityas of 3/31/2018 Cash and cash investments $0.4B Short-term bank deposits $0.1B Total $0.5B Disciplined Capital Allocation • Repurchased approximately 3.7 million shares in Q1 for $150 million • Repatriated approximately $425 million to partially fund Kichler acquisition • Achieved investment grade rating by Moody’s 11
  • 12.
    Masco Q1 2018Results 12 Topic • Summary of Results Keith Allman • Financial/Operations Review John Sznewajs • Q&A
  • 13.
  • 14.
  • 15.
    Appendix – ProfitReconciliations – First Quarter 15 ($ in Millions) Q1 2018 Q1 2017 Net sales $ 1,920 $ 1,778 Gross profit, as reported $ 619 $ 605 Rationalization charges 1 2 Kichler inventory step up adjustment 5 - Gross profit, as adjusted $ 625 $ 607 Gross margin, as reported 32.2% 34.0% Gross margin, as adjusted 32.6% 34.1% Selling, general and administrative expenses, as reported $ 375 $ 348 Selling, general and administrative expenses as percent of net sales, as reported 19.5% 19.6% Operating profit, as reported $ 244 $ 257 Rationalization charges 1 2 Kichler inventory step up adjustment 5 - Operating profit, as adjusted $ 250 $ 259 Operating margin, as reported 12.7% 14.5% Operating margin, as adjusted 13.0% 14.6%
  • 16.
    Appendix – EPSReconciliation – First Quarter 16 (in Millions, Except per Common Share Data) Q1 2018 Q1 2017 Income before income taxes, as reported $ 200 $ 210 Rationalization charges 1 2 Kichler inventory step up adjustment 5 - (Gains) from private equity funds, net - (1) Income before income taxes, as adjusted $ 206 $ 211 Tax at 26% rate (34% for 2017) (54) (72) Less: Net income attributable to noncontrolling interest 12 10 Net income, as adjusted $ 140 $ 129 Net income per common share, as adjusted $ 0.45 $ 0.40 Average diluted common shares outstanding 313 321
  • 17.
    Appendix – EPSReconciliation – Remaining 2017 Periods 17 (in Millions, Except per Common Share Data) Q2 2017 Q3 2017 Q4 2017 Full Year 2017 Income before income taxes, as recasted $ 262 $ 264 $ 148 $ 884 Rationalization charges - 1 1 4 (Gains) from private equity funds, net (1) - (1) (3) (Earnings) from equity investments, net (1) - - (1) Impairment of private equity funds - 2 - 2 Loss on extinguishment of debt 107 - - 107 (Gain) loss on sales of businesses, net (49) (2) 64 13 Income before income taxes, as adjusted $ 318 $ 265 $ 212 $ 1,006 Tax at 34% rate (108) (90) (72) (342) Less: Net income attributable to noncontrolling interest 13 12 12 47 Net income, as adjusted $ 197 $ 163 $ 128 $ 617 Net income per common share, as recasted and adjusted $ 0.62 $ 0.52 $ 0.41 $ 1.94 Average diluted common shares outstanding 319 316 314 318
  • 18.
    Appendix – 2018EPS Outlook Reconciliation 18 Low End High End Net income per common share 2.36$ 2.51$ Rationalization charges 0.01 0.01 Kichler inventory step up adjustment 0.09 0.09 Allocation to participating securities per share (1) 0.02 0.02 Net income per common share, as adjusted 2.48$ 2.63$ Twelve Months Ended December 31, 2018 (1) Represents the impact of distributed dividends and undistributed earnings to unvested restricted stock awards in accordance with the two-class method of calculating earnings per share.
  • 19.
    19 2017 RESTATEMENTS Reflecting impactof revenue recognition and pension accounting changes 2017 NET SALES, as recasted Q1 Q2 Q3 Q4 Full Year Plumbing Products $872 $949 $950 $961 $3,732 Decorative Architectural Products 496 661 562 487 2,206 Cabinetry Products 231 251 229 223 934 Windows & Other Specialty Products 179 205 204 182 770 Total Net Sales $1,778 $2,066 $1,945 $1,853 $7,642 2017 OPERATING PROFIT, as recasted Q1 Q2 Q3 Q4 Full Year Plumbing Products $162 $200 $175 $165 $702 Decorative Architectural Products 94 149 112 83 438 Cabinetry Products 16 31 20 25 92 Windows & Other Specialty Products 8 18 24 4 54 General Corporate Expense, Net (23) (26) (22) (21) (92) Total Operating Profit $257 $372 $309 $256 $1,194 2017 EPS, as recasted and adjusted Q1 Q2 Q3 Q4 Full Year Net income per common share $0.40 $0.62 $0.52 $0.41 $1.94 ($ in Millions, except EPS)
  • 20.
    ($ in Millions)2018 Estimate Rationalization Charges ~ $5 Tax Rate ~ 26% General Corporate Expense ~ $85 Interest Expense ~ $157 Increased ‘Other expense’ Due to Change in Pension Expense Accounting ~ $17 Capital Expenditures ~ $220 Depreciation & Amortization1 ~ $160 Favorable Foreign Currency Translation Impact to Sales2 ~ $135 Shares Repurchased $200-300 2018 Guidance Estimates 20 1. Includes the impact of Kichler acquisition. 2. Based on rates as of March 31, 2018.
  • 21.
    2017 Segment Mix* R&R= % of sales to repair and remodel channels NC = % of sales to new construction channels NA = % of sales within North America Int’l = % of sales outside North America * Based on Company estimates Business Segment Plumbing Products Decorative Architectural Products $3.7B $2.2B Revenue 2017 % of Total 49% 29% $ 7.6B 100%Total Company Windows and Other Specialty Products $0.8B 10% R&R% vs. NC NA% vs. Int’l 83% 63% 99% 100% 71% 79% 84% 79% Cabinetry Products $0.9B 12% 65% 95% 21
  • 22.
    2017 Geographic RevenueSplit* *Based on Company estimates International Sales Accounted for ~21% of Total 2017 Masco Sales 22