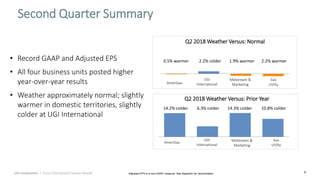
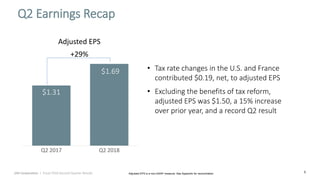
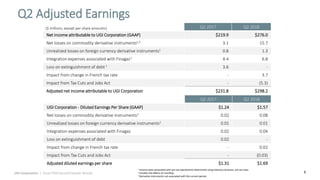
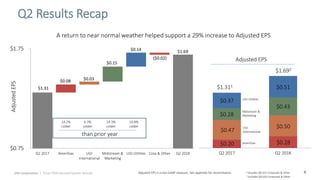
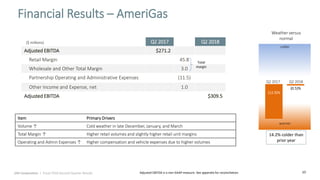
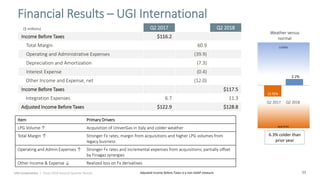
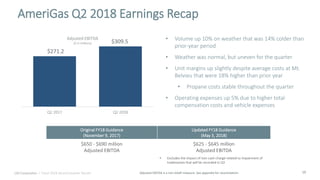
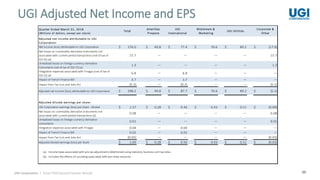
1
Fiscal Second Quarter Results
May 3, 2018
John L. Walsh
President & CEO, UGI Corporation
Kirk R. Oliver
Chief Financial Officer, UGI Corporation
Jerry E. Sheridan
President & CEO, AmeriGas Partners
2
About This Presentation
This presentation contains certain forward-looking statements that management believes to be
reasonable as of today’s date only. Actual results may differ significantly because of risks and uncertainties
that are difficult to predict and many of which are beyond management’s control. You should read UGI’s
Annual Report on Form 10-K for a more extensive list of factors that could affect results. Among them are
adverse weather conditions, cost volatility and availability of all energy products, including propane,
natural gas, electricity and fuel oil, increased customer conservation measures, the impact of pending and
future legal proceedings, continued analysis of recent tax legislation, liability for uninsured claims and for
claims in excess of insurance coverage, domestic and international political, regulatory and economic
conditions in the United States and in foreign countries, including the current conflicts in the Middle East,
and foreign currency exchange rate fluctuations (particularly the euro), changes in Marcellus Shale gas
production, the availability, timing and success of our acquisitions, commercial initiatives and investments
to grow our business, our ability to successfully integrate acquired businesses and achieve anticipated
synergies, and the interruption, disruption, failure, malfunction, or breach of our information technology
systems, including due to cyber-attack. UGI undertakes no obligation to release revisions to its forward-
looking statements to reflect events or circumstances occurring after today. In addition, this presentation
uses certain non-GAAP financial measures. Please see the appendix for reconciliations of these measures
to the most comparable GAAP financial measure.
UGI Corporation | Fiscal 2018 Second Quarter Results
3
John L. Walsh
President & CEO, UGI
Second Quarter Recap
4
Second Quarter Summary
Adjusted EPS is a non-GAAP measure. See Appendix for reconciliation.
AmeriGas
UGI
International
Gas
Utility
Midstream &
Marketing
Q2 2018 Weather Versus: Prior Year
14.2% colder 6.3% colder 14.3% colder 10.8% colder
UGI Corporation | Fiscal 2018 Second Quarter Results
Q2 2018 Weather Versus: Normal
AmeriGas
UGI
International
Gas
Utility
Midstream &
Marketing
2.2% warmer1.9% warmer2.2% colder0.5% warmer• Record GAAP and Adjusted EPS
• All four business units posted higher
year-over-year results
• Weather approximately normal; slightly
warmer in domestic territories, slightly
colder at UGI International
5
Q2 Earnings Recap
• Tax rate changes in the U.S. and France
contributed $0.19, net, to adjusted EPS
• Excluding the benefits of tax reform,
adjusted EPS was $1.50, a 15% increase
over prior year, and a record Q2 result
Adjusted EPS is a non-GAAP measure. See Appendix for reconciliation.
$1.31
$1.69
Q2 2017 Q2 2018
UGI Corporation | Fiscal 2018 Second Quarter Results
Adjusted EPS
+29%
6
Second Quarter Overview
UGI Corporation | Fiscal 2018 Second Quarter Results
• Working with PennEast property owners and have obtained 97% survey
permission in PA and 50% in NJ
• LNG investments continued to perform very well as peaking and power
generation demand across New England and the Mid-Atlantic remains high
• Gas Utility has added nearly 8,600 new residential and commercial heating
customers YTD and remains on pace with its infrastructure replacement
program
• AmeriGas adjusted EBITDA increased 14% over Q2 2017 as operations
successfully responded to variable weather conditions to ensure our
customers received high-quality service
• Contributions from recent acquisitions and the strength of the legacy
business enabled UGI International to have consecutive years of outstanding
heating-season results
7
Second Quarter Financial Review
Kirk R. Oliver
Chief Financial Officer, UGI
8
Q2 2017 Q2 2018
Net income attributable to UGI Corporation (GAAP) $219.9 $276.0
Net losses on commodity derivative instruments1,3 3.1 15.7
Unrealized losses on foreign currency derivative instruments1 0.8 1.3
Integration expenses associated with Finagaz1 4.4 6.8
Loss on extinguishment of debt1 3.6 -
Impact from change in French tax rate - 3.7
Impact from Tax Cuts and Jobs Act - (5.3)
Adjusted net income attributable to UGI Corporation $231.8 $298.2
Q2 Adjusted Earnings
Q2 2017 Q2 2018
UGI Corporation - Diluted Earnings Per Share (GAAP) $1.24 $1.57
Net losses on commodity derivative instruments3 0.02 0.08
Unrealized losses on foreign currency derivative instruments2 0.01 0.01
Integration expenses associated with Finagaz 0.02 0.04
Loss on extinguishment of debt 0.02 -
Impact from change in French tax rate - 0.02
Impact from Tax Cuts and Jobs Act - (0.03)
Adjusted diluted earnings per share $1.31 $1.69
1 Income taxes associated with pre-tax adjustments determined using statutory business unit tax rates
2 Includes the effects of rounding
3 Derivative instruments not associated with the current period.
($ millions, except per share amounts)
UGI Corporation | Fiscal 2018 Second Quarter Results
9
$1.31
$0.08 $0.03
$0.15
$0.14
($0.02)
$1.69
$0.75
$1.75
Q2 2017 AmeriGas UGI
International
Midstream &
Marketing
UGI Utilities Corp & Other Q2 2018
AdjustedEPS Q2 Results Recap
A return to near normal weather helped support a 29% increase to Adjusted EPS
Adjusted EPS is a non-GAAP measure. See appendix for reconciliation. 1 Includes $(0.01) Corporate & Other
$0.20 $0.28
$0.47
$0.50
$0.28
$0.43
$0.37
$0.51
Q2 2017 Q2 2018
$1.692
$1.311
UGI
International
6.3%
colder
14.2%
colder
14.3%
colder
10.8%
colder
Adjusted EPS
Midstream &
Marketing
UGI Utilities
AmeriGas
2 Includes $(0.03) Corporate & Other
than prior year
UGI Corporation | Fiscal 2018 Second Quarter Results
10
Q2 2017 Q2 2018
Adjusted EBITDA $271.2
Retail Margin 45.8
Wholesale and Other Total Margin 3.0
Partnership Operating and Administrative Expenses (11.5)
Other Income and Expense, net 1.0
Adjusted EBITDA $309.5
Financial Results – AmeriGas
Q2 2017 Q2 2018
colder
warmer
(13.5)%
(12.9)%
Weather versus
normal
14.2% colder than
prior year
Adjusted EBITDA is a non-GAAP measure. See appendix for reconciliation.
($ millions)
Total
margin
(0.5)%
Item Primary Drivers
Volume ↑ Cold weather in late December, January, and March
Total Margin ↑ Higher retail volumes and slightly higher retail unit margins
Operating and Admin Expenses ↑ Higher compensation and vehicle expenses due to higher volumes
UGI Corporation | Fiscal 2018 Second Quarter Results
11
Q2 2017 Q2 2018
Income Before Taxes $116.2
Total Margin 60.9
Operating and Administrative Expenses (39.9)
Depreciation and Amortization (7.3)
Interest Expense (0.4)
Other Income and Expense, net (12.0)
Income Before Taxes $117.5
Integration Expenses 6.7 11.3
Adjusted Income Before Taxes $122.9 $128.8
Financial Results – UGI International
Weather versus
normal
-6.2%-7.4%
6.3% colder than
prior year
($ millions)
Adjusted Income Before Taxes is a non-GAAP measure.
Q2 2017 Q2 2018
colder
warmer
2.2%
Item Primary Drivers
LPG Volume ↑ Acquisition of UniverGas in Italy and colder weather
Total Margin ↑ Stronger Fx rates; margin from acquisitions and higher LPG volumes from
legacy business
Operating and Admin Expenses ↑ Stronger Fx rates and incremental expenses from acquisitions; partially offset
by Finagaz synergies
Other Income & Expense ↓ Realized loss on Fx derivatives
UGI Corporation | Fiscal 2018 Second Quarter Results
(3.9)%
12
Q2 2017 Q2 2018
Income Before Taxes $ 83.8
Total Margin 32.7
Operating and Administrative Expenses (4.4)
Depreciation and Amortization (2.0)
Other Income and Expenses, net (2.5)
Income Before Taxes $107.6
Financial Results – Midstream & Marketing
Q2 2017 Q2 2018
colder
warmer
(14.2)%
Weather versus
normal
14.3% colder than
prior year
($ millions)
(1.9)%
Item Primary Drivers
Total Margin ↑ Higher capacity management, peaking, gathering and generation total margins
Operating and Admin Expenses ↑ Higher compensation and benefit expenses and greater peaking and gathering
activities related to new investments and expanded activities
Other Income & Expense ↓ Absence of AFUDC income associated with Sunbury
UGI Corporation | Fiscal 2018 Second Quarter Results
13
Q2 2017 Q2 2018
Income Before Taxes $106.1
Total Margin 30.4
Operating and Administrative Expenses (8.1)
Depreciation and Amortization (3.4)
Interest Expense (0.8)
Other Income and Expense, net (0.2)
Income Before Taxes $124.0
Financial Results – Utilities
Q2 2017 Q2 2018
colder
warmer
(2.2)%(11.7)%
Gas Utility
weather versus
normal
10.8% colder than
prior year
($ millions)
Item Primary Drivers
Volume ↑ Core market throughput higher due to colder weather and customer growth
Total Margin ↑ Higher core market throughput, higher large firm delivery service total margin,
and increase in PNG base rates
Operating and Admin Expenses ↑ Higher accounts receivable reserves, compensation and benefits due to
increased volumes
Depreciation and Amortization ↑ Increased capital expenditure activity
UGI Corporation | Fiscal 2018 Second Quarter Results
14
2013 – 2018 Adjusted EPS Growth
UGI Corporation | Fiscal 2018 Second Quarter Results
First Half 2013 First Half 2018
$2.42
$1.60
9% CAGR
First Half 2013 and 2018 periods both experienced approximately normal weather
11% CAGR
$2.70
$0.28 benefit from
tax reform
+69% Total
+51% Total
Adjusted EPS is a non-GAAP measure. See appendix for reconciliation.
15
AmeriGas
AmeriGas Second Quarter Recap
Jerry E. Sheridan
President & CEO, AmeriGas
16
• Volume up 10% on weather that was 14% colder than
prior-year period
• Weather was normal, but uneven for the quarter
• Unit margins up slightly despite average costs at Mt.
Belvieu that were 18% higher than prior year
• Propane costs stable throughout the quarter
• Operating expenses up 5% due to higher total
compensation costs and vehicle expenses
Adjusted EBITDA is a non-GAAP measure. See appendix for reconciliation.
AmeriGas Q2 2018 Earnings Recap
$551.2$271.2
$309.5
Q2 2017 Q2 2018
Adjusted EBITDA
($ in millions)$185.1
UGI Corporation | Fiscal 2018 Second Quarter Results
Original FY18 Guidance
(November 9, 2017)
Updated FY18 Guidance
(May 3, 2018)
$650 - $690 million
Adjusted EBITDA
$625 - $645 million
Adjusted EBITDA
• Excludes the impact of non-cash charge related to impairment of
tradenames that will be recorded in Q3
17
Growth Initiatives
Cylinder Exchange
• Volume was up 15% vs. Q2 2017
• 6% increase in same store sales
National Accounts
• Volume was up 18% vs. Q2 2017 due to
weather and new customers
Acquisitions
• Closed an acquisition in April; expected
to add 3 million gallons annually
• Pipeline remains strong
UGI Corporation | Fiscal 2018 Second Quarter Results
18
Trade Names and Distribution Update
UGI Corporation | Fiscal 2018 Second Quarter Results
Heritage Tradenames
• Recently completed a review of the operational
tradenames acquired with the Heritage
acquisition in 2012
• Analysis concluded that the tradenames will have
a finite life of 3-5 years and be amortized over
that time
• Will record a non-cash charge of approximately
$70 million in Q3 to adjust the fair value
• Impact of charge will be excluded from adjusted
EBITDA
Distribution and Leverage Update
• On April 23, Board of Directors approved a $0.95
distribution; unchanged from prior quarter
• Holding the distribution flat will contribute to building
distribution coverage following two record warm years
in 2016 and 2017
• Expect to finish FY18 with improved leverage of ~4.3x
and distribution coverage of greater than 1.0x
19
Investor Relations:
Will Ruthrauff
610-456-6571
ruthrauffw@ugicorp.com
Brendan Heck
610-456-6608
heckb@ugicorp.com
John L. Walsh
President & CEO, UGI
Conclusion and Q&A
20
Key Growth Drivers
UGI Corporation | Fiscal 2018 Second Quarter Results
Natural Gas Infrastructure
• Record natural gas demand in first two weeks of Q2
highlighted the need for additional infrastructure
• Peak sendouts were 7-14% above record-level set
in Polar Vortex of 2014
• UGI investments to meet higher ongoing demand
• PennEast
• Steelton LNG - completed
• Bethlehem LNG - recently approved
• Plan to deploy $1.2 billion of capital at Utilities over the
next four years
LPG and International
• AmeriGas scale continues to offer competitive
advantage; National Accounts and ACE up 15%+
this quarter
• Acquisitions in Europe
o DVEP – power and natural gas marketing in
Netherlands
o UniverGas – LPG distribution in Italy
o Finagaz – acquired in 2015; integration in
final stages
21
FY 2018 Guidance Update
UGI Corporation | Fiscal 2018 Second Quarter Results
Original FY18 Adjusted EPS Guidance
(November 9, 2017)
Updated FY18 Adjusted EPS Guidance
(May 3, 2018)
$2.45 – $2.65 $2.70 – $2.80
• Did not reflect impact of tax reform • Includes the benefit of tax reform (other than
one-time items)
• Reflects the strong underlying performance in
each of our businesses
• Excludes the impact of the non-cash charge
related to impairment of tradenames acquired
in the Heritage acquisition that will be
recorded in Q3
22
Q&A
23
APPENDIX
24
• Management uses "adjusted net income attributable to UGI" and "adjusted diluted earnings per share," both of which are non-GAAP financial measures, when
evaluating UGI's overall performance. For the periods presented, adjusted net income attributable to UGI is net income attributable to UGI Corporation after
excluding net after-tax gains and losses on commodity and certain foreign currency derivative instruments not associated with current period transactions
(principally comprising changes in unrealized gains and losses on derivative instruments), Finagaz integration expenses, losses associated with extinguishments
of debt and the impact on net deferred tax liabilities from a change in French corporate income tax rate and U.S. tax reform legislation. Volatility in net income
at UGI can occur as a result of gains and losses on commodity and certain foreign currency derivative instruments not associated with current period
transactions but included in earnings in accordance with U.S. generally accepted accounting principles ("GAAP").
• Non-GAAP financial measures are not in accordance with, or an alternative to, GAAP and should be considered in addition to, and not as a substitute for, the
comparable GAAP measures. Management believes that these non-GAAP measures provide meaningful information to investors about UGI’s performance
because they eliminate the impact of (1) gains and losses on commodity and certain foreign currency derivative instruments not associated with current-period
transactions and (2) other significant discrete items that can affect the comparison of period-over-period results.
• The following tables on the following slides reconcile net income attributable to UGI Corporation, the most directly comparable GAAP measure, to adjusted net
income attributable to UGI Corporation, and reconciles diluted earnings per share, the most comparable GAAP measure, to adjusted diluted earnings per
share, to reflect the adjustments referred to above.
UGI Supplemental Footnotes
UGI Corporation | Fiscal 2018 Second Quarter Results
25
UGI Adjusted Net Income and EPS
UGI Corporation | Fiscal 2018 Second Quarter Results
Quarter Ended March 31, 2018
(Millions of dollars, except per share)
Adjusted net income attributable to UGI
Corporation:
Net income (loss) attributable to UGI Corporation $ 276.0 $ 49.8 $ 77.4 $ 76.6 $ 89.2 $ (17.0)
Net losses on commodity derivative instruments not
associated with current-period transactions (net of tax of
$(3.9)) (a)
Unrealized losses on foreign currency derivative
instruments (net of tax of $(0.7)) (a)
Integration expenses associated with Finagaz (net of tax of
$(4.5)) (a)
Impact of French Finance Bill
Impact from Tax Cuts and Jobs Act (5.3) (0.2) — — (5.1)
Adjusted net income (loss) attributable to UGI Corporation $ 298.2 $ 49.8 $ 87.7 $ 76.6 $ 89.2 $ (5.1)
Adjusted diluted earnings per share:
UGI Corporation earnings (loss) per share - diluted $ 1.57 $ 0.28 $ 0.44 $ 0.43 $ 0.51 $ (0.09)
Net losses on commodity derivative instruments not
associated with current-period transactions (b)
Unrealized losses on foreign currency derivative
instruments
Integration expenses associated with Finagaz
Impact of French Finance Bill
Impact from Tax Cuts and Jobs Act
Adjusted diluted earnings (loss) per share $ 1.69 $ 0.28 $ 0.50 $ 0.43 $ 0.51 $ (0.03)
(a) Income taxes associated with pre-tax adjustments determined using statutory business unit tax rates.
(b) Includes the effects of rounding associated with per share amounts.
AmeriGas
Propane
Total UGI Utilities
Corporate &
Other
UGI
International
Midstream &
Marketing
1.3
15.7 — — — — 15.7
1.3 — — — —
—6.8 — 6.8 — —
3.7 — 3.7 — — —
—
0.080.08 — — — —
—
0.01 — — — — 0.01
0.04 — 0.04 — —
(0.03)
0.02 — 0.02 — — —
(0.03) — — — —
26
UGI Adjusted Net Income and EPS
UGI Corporation | Fiscal 2018 Second Quarter Results
Quarter Ended March 31, 2017
(Millions of dollars except per share)
Adjusted net income attributable to UGI
Corporation:
Net income (loss) attributable to UGI Corporation $ 219.9 $ 32.0 $ 79.3 $ 50.2 $ 65.1 $ (6.7)
Net losses on commodity derivative instruments not
associated with current-period transactions (net of tax of
$1.5) (a)
Unrealized losses on foreign currency derivative
instruments (net of tax of $(0.5)) (a)
0.8 — — — — 0.8
Loss on extinguishments of debt (net of tax of $(2.3)) (a)
Integration expenses associated with Finagaz (net of tax
of $(2.3)) (a)
Adjusted net income (loss) attributable to UGI
Corporation
$ 231.8 $ 35.6 $ 83.7 $ 50.2 $ 65.1 $ (2.8)
Adjusted diluted earnings per share:
UGI Corporation earnings (loss) per share - diluted $ 1.24 $ 0.18 $ 0.45 $ 0.28 $ 0.37 $ (0.04)
Net losses on commodity derivative instruments not
associated with current-period transactions
Unrealized losses on foreign currency derivative
instruments (b)
Loss on extinguishments of debt
Integration expenses associated with Finagaz 0.02 —
Adjusted diluted earnings (loss) per share $ 1.31 $ 0.20 $ 0.47 $ 0.28 $ 0.37 $ (0.01)
(a) Income taxes associated with pre-tax adjustments determined using statutory business unit tax rates.
(b) Includes the effects of rounding.
Total
AmeriGas
Propane
UGI
International
Midstream
&
Marketing
UGI Utilities
Corporate
& Other
—
3.1 — — — — 3.1
3.6 3.6 — — —
4.4 — 4.4 — — —
0.020.02 — — — —
0.01
0.02 0.02 — — —
0.01 — — — —
— —— 0.02
—
27
2013 UGI Adjusted Net Income and EPS
UGI Corporation | Fiscal 2018 Second Quarter Results
For the Six Months ended March 31, 2013
(Millions of dollars, except per share) 2013
Adjusted net income attributable to UGI Corporation:
Net income attributable to UGI Corporation 283.2$
Net unrealized gains on Midstream & Marketing's unsettled commodity
derivative instruments (net of tax of $2.4)(a) (3.4)
Net gains on certain Midstream & Marketings settled commodity derivative
instruments (net of tax of $3.3)(a) (4.6)
Adjusted net income attributable to UGI Corporation 275.2$
Adjusted diluted earnings per share
Earnings per share - diluted 1.65$
Net unrealized gains on Midstream & Marketings's unsettled commodity
derivative instruments (0.02)
Net gains on certain Midsream and Marketing settled commodity derivative
instruments (0.03)
Adjusted earnings per share - diluted 1.60$
(a) Income taxes associated with pre-tax adjustments determined using statutory business unit tax rates.
28
• The enclosed supplemental information contains a reconciliation of earnings before interest expense, income taxes, depreciation and
amortization ("EBITDA") and Adjusted EBITDA to Net Income.
• EBITDA and Adjusted EBITDA are not measures of performance or financial condition under GAAP. Management believes EBITDA and
Adjusted EBITDA are meaningful non-GAAP financial measures used by investors to compare the Partnership's operating performance
with that of other companies within the propane industry. The Partnership's definitions of EBITDA and Adjusted EBITDA may be different
from those used by other companies.
• EBITDA and Adjusted EBITDA should not be considered as alternatives to net income (loss) attributable to AmeriGas Partners, L.P.
Management uses EBITDA to compare year-over-year profitability of the business without regard to capital structure as well as to
compare the relative performance of the Partnership to that of other master limited partnerships without regard to their financing
methods, capital structure, income taxes or historical cost basis. Management uses Adjusted EBITDA to exclude from AmeriGas
Partners’ EBITDA gains and losses that competitors do not necessarily have to provide additional insight into the comparison of year-
over-year profitability to that of other master limited partnerships. In view of the omission of interest, income taxes, depreciation and
amortization, gains and losses on commodity derivative instruments not associated with current-period transactions, and other gains
and losses that competitors do not necessarily have from Adjusted EBITDA, management also assesses the profitability of the business
by comparing net income attributable to AmeriGas Partners, L.P. for the relevant periods. Management also uses Adjusted EBITDA to
assess the Partnership's profitability because its parent, UGI Corporation, uses the Partnership's Adjusted EBITDA to assess the
profitability of the Partnership, which is one of UGI Corporation’s business segments. UGI Corporation discloses the Partnership's
Adjusted EBITDA as the profitability measure for its domestic propane segment.
AmeriGas Supplemental Footnotes
UGI Corporation | Fiscal 2018 Second Quarter Results
29
AmeriGas EBITDA and Adjusted EBITDA
UGI Corporation | Fiscal 2018 Second Quarter Results
(Millions of dollars)
EBITDA and Adjusted EBITDA
Net income attributable to AmeriGas Partners $ 191.8 $ 135.1
Income tax expense (a)
Interest expense
Depreciation
Amortization
EBITDA 278.6 220.7
Add net losses on commodity derivative instruments not associated
with current-period transactions
Loss on extinguishments of debt - 22.1
Noncontrolling interest in net losses on commodity derivative
instruments not associated with current-period transactions (a)
Adjusted EBITDA $ 309.5 $ 271.2
(a) Includes the impact of rounding.
Quarter Ended March 31,
9.6 10.6
31.2 28.6
2018 2017
0.6 0.6
(0.3) (0.2)
41.0 40.0
35.6 34.4
30
Investor Relations:
Will Ruthrauff
610-456-6571
ruthrauffw@ugicorp.com
Brendan Heck
610-456-6608
heckb@ugicorp.com

Second Quarter 2018 Earnings Presentation

  • 1.
    1 Fiscal Second QuarterResults May 3, 2018 John L. Walsh President & CEO, UGI Corporation Kirk R. Oliver Chief Financial Officer, UGI Corporation Jerry E. Sheridan President & CEO, AmeriGas Partners
  • 2.
    2 About This Presentation Thispresentation contains certain forward-looking statements that management believes to be reasonable as of today’s date only. Actual results may differ significantly because of risks and uncertainties that are difficult to predict and many of which are beyond management’s control. You should read UGI’s Annual Report on Form 10-K for a more extensive list of factors that could affect results. Among them are adverse weather conditions, cost volatility and availability of all energy products, including propane, natural gas, electricity and fuel oil, increased customer conservation measures, the impact of pending and future legal proceedings, continued analysis of recent tax legislation, liability for uninsured claims and for claims in excess of insurance coverage, domestic and international political, regulatory and economic conditions in the United States and in foreign countries, including the current conflicts in the Middle East, and foreign currency exchange rate fluctuations (particularly the euro), changes in Marcellus Shale gas production, the availability, timing and success of our acquisitions, commercial initiatives and investments to grow our business, our ability to successfully integrate acquired businesses and achieve anticipated synergies, and the interruption, disruption, failure, malfunction, or breach of our information technology systems, including due to cyber-attack. UGI undertakes no obligation to release revisions to its forward- looking statements to reflect events or circumstances occurring after today. In addition, this presentation uses certain non-GAAP financial measures. Please see the appendix for reconciliations of these measures to the most comparable GAAP financial measure. UGI Corporation | Fiscal 2018 Second Quarter Results
  • 3.
    3 John L. Walsh President& CEO, UGI Second Quarter Recap
  • 4.
    4 Second Quarter Summary AdjustedEPS is a non-GAAP measure. See Appendix for reconciliation. AmeriGas UGI International Gas Utility Midstream & Marketing Q2 2018 Weather Versus: Prior Year 14.2% colder 6.3% colder 14.3% colder 10.8% colder UGI Corporation | Fiscal 2018 Second Quarter Results Q2 2018 Weather Versus: Normal AmeriGas UGI International Gas Utility Midstream & Marketing 2.2% warmer1.9% warmer2.2% colder0.5% warmer• Record GAAP and Adjusted EPS • All four business units posted higher year-over-year results • Weather approximately normal; slightly warmer in domestic territories, slightly colder at UGI International
  • 5.
    5 Q2 Earnings Recap •Tax rate changes in the U.S. and France contributed $0.19, net, to adjusted EPS • Excluding the benefits of tax reform, adjusted EPS was $1.50, a 15% increase over prior year, and a record Q2 result Adjusted EPS is a non-GAAP measure. See Appendix for reconciliation. $1.31 $1.69 Q2 2017 Q2 2018 UGI Corporation | Fiscal 2018 Second Quarter Results Adjusted EPS +29%
  • 6.
    6 Second Quarter Overview UGICorporation | Fiscal 2018 Second Quarter Results • Working with PennEast property owners and have obtained 97% survey permission in PA and 50% in NJ • LNG investments continued to perform very well as peaking and power generation demand across New England and the Mid-Atlantic remains high • Gas Utility has added nearly 8,600 new residential and commercial heating customers YTD and remains on pace with its infrastructure replacement program • AmeriGas adjusted EBITDA increased 14% over Q2 2017 as operations successfully responded to variable weather conditions to ensure our customers received high-quality service • Contributions from recent acquisitions and the strength of the legacy business enabled UGI International to have consecutive years of outstanding heating-season results
  • 7.
    7 Second Quarter FinancialReview Kirk R. Oliver Chief Financial Officer, UGI
  • 8.
    8 Q2 2017 Q22018 Net income attributable to UGI Corporation (GAAP) $219.9 $276.0 Net losses on commodity derivative instruments1,3 3.1 15.7 Unrealized losses on foreign currency derivative instruments1 0.8 1.3 Integration expenses associated with Finagaz1 4.4 6.8 Loss on extinguishment of debt1 3.6 - Impact from change in French tax rate - 3.7 Impact from Tax Cuts and Jobs Act - (5.3) Adjusted net income attributable to UGI Corporation $231.8 $298.2 Q2 Adjusted Earnings Q2 2017 Q2 2018 UGI Corporation - Diluted Earnings Per Share (GAAP) $1.24 $1.57 Net losses on commodity derivative instruments3 0.02 0.08 Unrealized losses on foreign currency derivative instruments2 0.01 0.01 Integration expenses associated with Finagaz 0.02 0.04 Loss on extinguishment of debt 0.02 - Impact from change in French tax rate - 0.02 Impact from Tax Cuts and Jobs Act - (0.03) Adjusted diluted earnings per share $1.31 $1.69 1 Income taxes associated with pre-tax adjustments determined using statutory business unit tax rates 2 Includes the effects of rounding 3 Derivative instruments not associated with the current period. ($ millions, except per share amounts) UGI Corporation | Fiscal 2018 Second Quarter Results
  • 9.
    9 $1.31 $0.08 $0.03 $0.15 $0.14 ($0.02) $1.69 $0.75 $1.75 Q2 2017AmeriGas UGI International Midstream & Marketing UGI Utilities Corp & Other Q2 2018 AdjustedEPS Q2 Results Recap A return to near normal weather helped support a 29% increase to Adjusted EPS Adjusted EPS is a non-GAAP measure. See appendix for reconciliation. 1 Includes $(0.01) Corporate & Other $0.20 $0.28 $0.47 $0.50 $0.28 $0.43 $0.37 $0.51 Q2 2017 Q2 2018 $1.692 $1.311 UGI International 6.3% colder 14.2% colder 14.3% colder 10.8% colder Adjusted EPS Midstream & Marketing UGI Utilities AmeriGas 2 Includes $(0.03) Corporate & Other than prior year UGI Corporation | Fiscal 2018 Second Quarter Results
  • 10.
    10 Q2 2017 Q22018 Adjusted EBITDA $271.2 Retail Margin 45.8 Wholesale and Other Total Margin 3.0 Partnership Operating and Administrative Expenses (11.5) Other Income and Expense, net 1.0 Adjusted EBITDA $309.5 Financial Results – AmeriGas Q2 2017 Q2 2018 colder warmer (13.5)% (12.9)% Weather versus normal 14.2% colder than prior year Adjusted EBITDA is a non-GAAP measure. See appendix for reconciliation. ($ millions) Total margin (0.5)% Item Primary Drivers Volume ↑ Cold weather in late December, January, and March Total Margin ↑ Higher retail volumes and slightly higher retail unit margins Operating and Admin Expenses ↑ Higher compensation and vehicle expenses due to higher volumes UGI Corporation | Fiscal 2018 Second Quarter Results
  • 11.
    11 Q2 2017 Q22018 Income Before Taxes $116.2 Total Margin 60.9 Operating and Administrative Expenses (39.9) Depreciation and Amortization (7.3) Interest Expense (0.4) Other Income and Expense, net (12.0) Income Before Taxes $117.5 Integration Expenses 6.7 11.3 Adjusted Income Before Taxes $122.9 $128.8 Financial Results – UGI International Weather versus normal -6.2%-7.4% 6.3% colder than prior year ($ millions) Adjusted Income Before Taxes is a non-GAAP measure. Q2 2017 Q2 2018 colder warmer 2.2% Item Primary Drivers LPG Volume ↑ Acquisition of UniverGas in Italy and colder weather Total Margin ↑ Stronger Fx rates; margin from acquisitions and higher LPG volumes from legacy business Operating and Admin Expenses ↑ Stronger Fx rates and incremental expenses from acquisitions; partially offset by Finagaz synergies Other Income & Expense ↓ Realized loss on Fx derivatives UGI Corporation | Fiscal 2018 Second Quarter Results (3.9)%
  • 12.
    12 Q2 2017 Q22018 Income Before Taxes $ 83.8 Total Margin 32.7 Operating and Administrative Expenses (4.4) Depreciation and Amortization (2.0) Other Income and Expenses, net (2.5) Income Before Taxes $107.6 Financial Results – Midstream & Marketing Q2 2017 Q2 2018 colder warmer (14.2)% Weather versus normal 14.3% colder than prior year ($ millions) (1.9)% Item Primary Drivers Total Margin ↑ Higher capacity management, peaking, gathering and generation total margins Operating and Admin Expenses ↑ Higher compensation and benefit expenses and greater peaking and gathering activities related to new investments and expanded activities Other Income & Expense ↓ Absence of AFUDC income associated with Sunbury UGI Corporation | Fiscal 2018 Second Quarter Results
  • 13.
    13 Q2 2017 Q22018 Income Before Taxes $106.1 Total Margin 30.4 Operating and Administrative Expenses (8.1) Depreciation and Amortization (3.4) Interest Expense (0.8) Other Income and Expense, net (0.2) Income Before Taxes $124.0 Financial Results – Utilities Q2 2017 Q2 2018 colder warmer (2.2)%(11.7)% Gas Utility weather versus normal 10.8% colder than prior year ($ millions) Item Primary Drivers Volume ↑ Core market throughput higher due to colder weather and customer growth Total Margin ↑ Higher core market throughput, higher large firm delivery service total margin, and increase in PNG base rates Operating and Admin Expenses ↑ Higher accounts receivable reserves, compensation and benefits due to increased volumes Depreciation and Amortization ↑ Increased capital expenditure activity UGI Corporation | Fiscal 2018 Second Quarter Results
  • 14.
    14 2013 – 2018Adjusted EPS Growth UGI Corporation | Fiscal 2018 Second Quarter Results First Half 2013 First Half 2018 $2.42 $1.60 9% CAGR First Half 2013 and 2018 periods both experienced approximately normal weather 11% CAGR $2.70 $0.28 benefit from tax reform +69% Total +51% Total Adjusted EPS is a non-GAAP measure. See appendix for reconciliation.
  • 15.
    15 AmeriGas AmeriGas Second QuarterRecap Jerry E. Sheridan President & CEO, AmeriGas
  • 16.
    16 • Volume up10% on weather that was 14% colder than prior-year period • Weather was normal, but uneven for the quarter • Unit margins up slightly despite average costs at Mt. Belvieu that were 18% higher than prior year • Propane costs stable throughout the quarter • Operating expenses up 5% due to higher total compensation costs and vehicle expenses Adjusted EBITDA is a non-GAAP measure. See appendix for reconciliation. AmeriGas Q2 2018 Earnings Recap $551.2$271.2 $309.5 Q2 2017 Q2 2018 Adjusted EBITDA ($ in millions)$185.1 UGI Corporation | Fiscal 2018 Second Quarter Results Original FY18 Guidance (November 9, 2017) Updated FY18 Guidance (May 3, 2018) $650 - $690 million Adjusted EBITDA $625 - $645 million Adjusted EBITDA • Excludes the impact of non-cash charge related to impairment of tradenames that will be recorded in Q3
  • 17.
    17 Growth Initiatives Cylinder Exchange •Volume was up 15% vs. Q2 2017 • 6% increase in same store sales National Accounts • Volume was up 18% vs. Q2 2017 due to weather and new customers Acquisitions • Closed an acquisition in April; expected to add 3 million gallons annually • Pipeline remains strong UGI Corporation | Fiscal 2018 Second Quarter Results
  • 18.
    18 Trade Names andDistribution Update UGI Corporation | Fiscal 2018 Second Quarter Results Heritage Tradenames • Recently completed a review of the operational tradenames acquired with the Heritage acquisition in 2012 • Analysis concluded that the tradenames will have a finite life of 3-5 years and be amortized over that time • Will record a non-cash charge of approximately $70 million in Q3 to adjust the fair value • Impact of charge will be excluded from adjusted EBITDA Distribution and Leverage Update • On April 23, Board of Directors approved a $0.95 distribution; unchanged from prior quarter • Holding the distribution flat will contribute to building distribution coverage following two record warm years in 2016 and 2017 • Expect to finish FY18 with improved leverage of ~4.3x and distribution coverage of greater than 1.0x
  • 19.
    19 Investor Relations: Will Ruthrauff 610-456-6571 ruthrauffw@ugicorp.com BrendanHeck 610-456-6608 heckb@ugicorp.com John L. Walsh President & CEO, UGI Conclusion and Q&A
  • 20.
    20 Key Growth Drivers UGICorporation | Fiscal 2018 Second Quarter Results Natural Gas Infrastructure • Record natural gas demand in first two weeks of Q2 highlighted the need for additional infrastructure • Peak sendouts were 7-14% above record-level set in Polar Vortex of 2014 • UGI investments to meet higher ongoing demand • PennEast • Steelton LNG - completed • Bethlehem LNG - recently approved • Plan to deploy $1.2 billion of capital at Utilities over the next four years LPG and International • AmeriGas scale continues to offer competitive advantage; National Accounts and ACE up 15%+ this quarter • Acquisitions in Europe o DVEP – power and natural gas marketing in Netherlands o UniverGas – LPG distribution in Italy o Finagaz – acquired in 2015; integration in final stages
  • 21.
    21 FY 2018 GuidanceUpdate UGI Corporation | Fiscal 2018 Second Quarter Results Original FY18 Adjusted EPS Guidance (November 9, 2017) Updated FY18 Adjusted EPS Guidance (May 3, 2018) $2.45 – $2.65 $2.70 – $2.80 • Did not reflect impact of tax reform • Includes the benefit of tax reform (other than one-time items) • Reflects the strong underlying performance in each of our businesses • Excludes the impact of the non-cash charge related to impairment of tradenames acquired in the Heritage acquisition that will be recorded in Q3
  • 22.
  • 23.
  • 24.
    24 • Management uses"adjusted net income attributable to UGI" and "adjusted diluted earnings per share," both of which are non-GAAP financial measures, when evaluating UGI's overall performance. For the periods presented, adjusted net income attributable to UGI is net income attributable to UGI Corporation after excluding net after-tax gains and losses on commodity and certain foreign currency derivative instruments not associated with current period transactions (principally comprising changes in unrealized gains and losses on derivative instruments), Finagaz integration expenses, losses associated with extinguishments of debt and the impact on net deferred tax liabilities from a change in French corporate income tax rate and U.S. tax reform legislation. Volatility in net income at UGI can occur as a result of gains and losses on commodity and certain foreign currency derivative instruments not associated with current period transactions but included in earnings in accordance with U.S. generally accepted accounting principles ("GAAP"). • Non-GAAP financial measures are not in accordance with, or an alternative to, GAAP and should be considered in addition to, and not as a substitute for, the comparable GAAP measures. Management believes that these non-GAAP measures provide meaningful information to investors about UGI’s performance because they eliminate the impact of (1) gains and losses on commodity and certain foreign currency derivative instruments not associated with current-period transactions and (2) other significant discrete items that can affect the comparison of period-over-period results. • The following tables on the following slides reconcile net income attributable to UGI Corporation, the most directly comparable GAAP measure, to adjusted net income attributable to UGI Corporation, and reconciles diluted earnings per share, the most comparable GAAP measure, to adjusted diluted earnings per share, to reflect the adjustments referred to above. UGI Supplemental Footnotes UGI Corporation | Fiscal 2018 Second Quarter Results
  • 25.
    25 UGI Adjusted NetIncome and EPS UGI Corporation | Fiscal 2018 Second Quarter Results Quarter Ended March 31, 2018 (Millions of dollars, except per share) Adjusted net income attributable to UGI Corporation: Net income (loss) attributable to UGI Corporation $ 276.0 $ 49.8 $ 77.4 $ 76.6 $ 89.2 $ (17.0) Net losses on commodity derivative instruments not associated with current-period transactions (net of tax of $(3.9)) (a) Unrealized losses on foreign currency derivative instruments (net of tax of $(0.7)) (a) Integration expenses associated with Finagaz (net of tax of $(4.5)) (a) Impact of French Finance Bill Impact from Tax Cuts and Jobs Act (5.3) (0.2) — — (5.1) Adjusted net income (loss) attributable to UGI Corporation $ 298.2 $ 49.8 $ 87.7 $ 76.6 $ 89.2 $ (5.1) Adjusted diluted earnings per share: UGI Corporation earnings (loss) per share - diluted $ 1.57 $ 0.28 $ 0.44 $ 0.43 $ 0.51 $ (0.09) Net losses on commodity derivative instruments not associated with current-period transactions (b) Unrealized losses on foreign currency derivative instruments Integration expenses associated with Finagaz Impact of French Finance Bill Impact from Tax Cuts and Jobs Act Adjusted diluted earnings (loss) per share $ 1.69 $ 0.28 $ 0.50 $ 0.43 $ 0.51 $ (0.03) (a) Income taxes associated with pre-tax adjustments determined using statutory business unit tax rates. (b) Includes the effects of rounding associated with per share amounts. AmeriGas Propane Total UGI Utilities Corporate & Other UGI International Midstream & Marketing 1.3 15.7 — — — — 15.7 1.3 — — — — —6.8 — 6.8 — — 3.7 — 3.7 — — — — 0.080.08 — — — — — 0.01 — — — — 0.01 0.04 — 0.04 — — (0.03) 0.02 — 0.02 — — — (0.03) — — — —
  • 26.
    26 UGI Adjusted NetIncome and EPS UGI Corporation | Fiscal 2018 Second Quarter Results Quarter Ended March 31, 2017 (Millions of dollars except per share) Adjusted net income attributable to UGI Corporation: Net income (loss) attributable to UGI Corporation $ 219.9 $ 32.0 $ 79.3 $ 50.2 $ 65.1 $ (6.7) Net losses on commodity derivative instruments not associated with current-period transactions (net of tax of $1.5) (a) Unrealized losses on foreign currency derivative instruments (net of tax of $(0.5)) (a) 0.8 — — — — 0.8 Loss on extinguishments of debt (net of tax of $(2.3)) (a) Integration expenses associated with Finagaz (net of tax of $(2.3)) (a) Adjusted net income (loss) attributable to UGI Corporation $ 231.8 $ 35.6 $ 83.7 $ 50.2 $ 65.1 $ (2.8) Adjusted diluted earnings per share: UGI Corporation earnings (loss) per share - diluted $ 1.24 $ 0.18 $ 0.45 $ 0.28 $ 0.37 $ (0.04) Net losses on commodity derivative instruments not associated with current-period transactions Unrealized losses on foreign currency derivative instruments (b) Loss on extinguishments of debt Integration expenses associated with Finagaz 0.02 — Adjusted diluted earnings (loss) per share $ 1.31 $ 0.20 $ 0.47 $ 0.28 $ 0.37 $ (0.01) (a) Income taxes associated with pre-tax adjustments determined using statutory business unit tax rates. (b) Includes the effects of rounding. Total AmeriGas Propane UGI International Midstream & Marketing UGI Utilities Corporate & Other — 3.1 — — — — 3.1 3.6 3.6 — — — 4.4 — 4.4 — — — 0.020.02 — — — — 0.01 0.02 0.02 — — — 0.01 — — — — — —— 0.02 —
  • 27.
    27 2013 UGI AdjustedNet Income and EPS UGI Corporation | Fiscal 2018 Second Quarter Results For the Six Months ended March 31, 2013 (Millions of dollars, except per share) 2013 Adjusted net income attributable to UGI Corporation: Net income attributable to UGI Corporation 283.2$ Net unrealized gains on Midstream & Marketing's unsettled commodity derivative instruments (net of tax of $2.4)(a) (3.4) Net gains on certain Midstream & Marketings settled commodity derivative instruments (net of tax of $3.3)(a) (4.6) Adjusted net income attributable to UGI Corporation 275.2$ Adjusted diluted earnings per share Earnings per share - diluted 1.65$ Net unrealized gains on Midstream & Marketings's unsettled commodity derivative instruments (0.02) Net gains on certain Midsream and Marketing settled commodity derivative instruments (0.03) Adjusted earnings per share - diluted 1.60$ (a) Income taxes associated with pre-tax adjustments determined using statutory business unit tax rates.
  • 28.
    28 • The enclosedsupplemental information contains a reconciliation of earnings before interest expense, income taxes, depreciation and amortization ("EBITDA") and Adjusted EBITDA to Net Income. • EBITDA and Adjusted EBITDA are not measures of performance or financial condition under GAAP. Management believes EBITDA and Adjusted EBITDA are meaningful non-GAAP financial measures used by investors to compare the Partnership's operating performance with that of other companies within the propane industry. The Partnership's definitions of EBITDA and Adjusted EBITDA may be different from those used by other companies. • EBITDA and Adjusted EBITDA should not be considered as alternatives to net income (loss) attributable to AmeriGas Partners, L.P. Management uses EBITDA to compare year-over-year profitability of the business without regard to capital structure as well as to compare the relative performance of the Partnership to that of other master limited partnerships without regard to their financing methods, capital structure, income taxes or historical cost basis. Management uses Adjusted EBITDA to exclude from AmeriGas Partners’ EBITDA gains and losses that competitors do not necessarily have to provide additional insight into the comparison of year- over-year profitability to that of other master limited partnerships. In view of the omission of interest, income taxes, depreciation and amortization, gains and losses on commodity derivative instruments not associated with current-period transactions, and other gains and losses that competitors do not necessarily have from Adjusted EBITDA, management also assesses the profitability of the business by comparing net income attributable to AmeriGas Partners, L.P. for the relevant periods. Management also uses Adjusted EBITDA to assess the Partnership's profitability because its parent, UGI Corporation, uses the Partnership's Adjusted EBITDA to assess the profitability of the Partnership, which is one of UGI Corporation’s business segments. UGI Corporation discloses the Partnership's Adjusted EBITDA as the profitability measure for its domestic propane segment. AmeriGas Supplemental Footnotes UGI Corporation | Fiscal 2018 Second Quarter Results
  • 29.
    29 AmeriGas EBITDA andAdjusted EBITDA UGI Corporation | Fiscal 2018 Second Quarter Results (Millions of dollars) EBITDA and Adjusted EBITDA Net income attributable to AmeriGas Partners $ 191.8 $ 135.1 Income tax expense (a) Interest expense Depreciation Amortization EBITDA 278.6 220.7 Add net losses on commodity derivative instruments not associated with current-period transactions Loss on extinguishments of debt - 22.1 Noncontrolling interest in net losses on commodity derivative instruments not associated with current-period transactions (a) Adjusted EBITDA $ 309.5 $ 271.2 (a) Includes the impact of rounding. Quarter Ended March 31, 9.6 10.6 31.2 28.6 2018 2017 0.6 0.6 (0.3) (0.2) 41.0 40.0 35.6 34.4
  • 30.