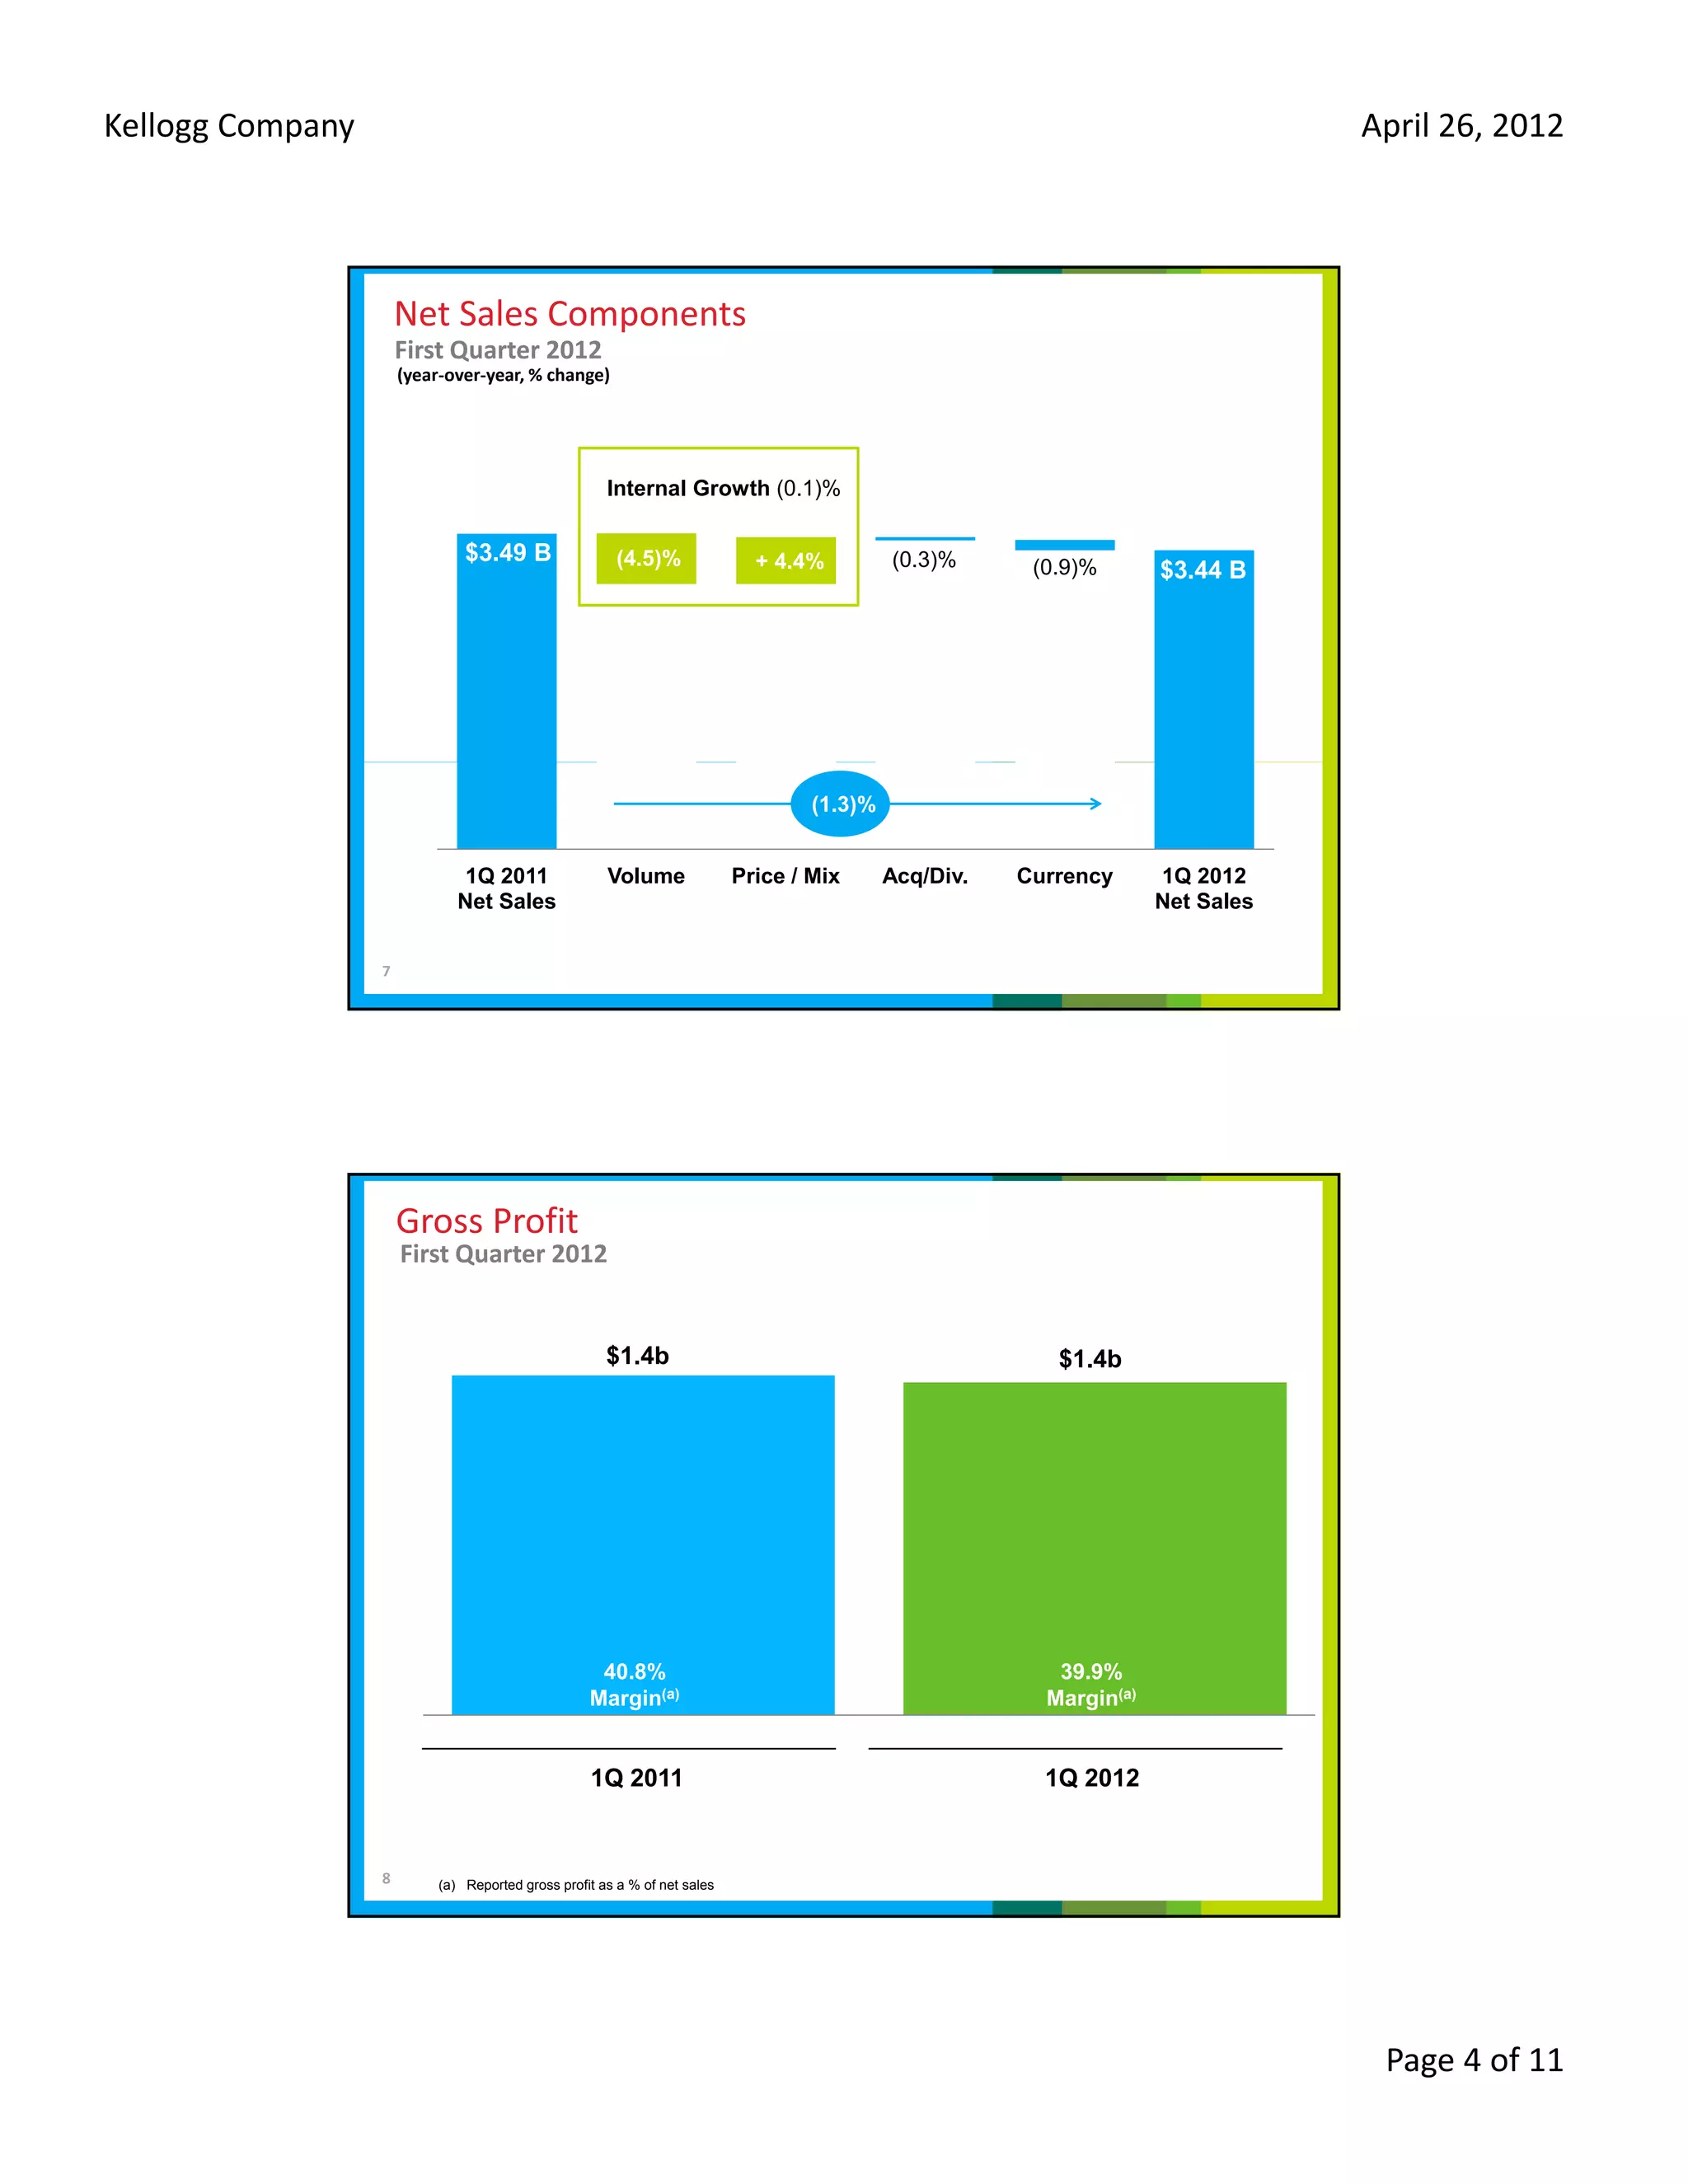
SlideShare a Scribd company logo
1 of 11
Download to read offline
Kellogg Company                                                                                                                                      April 26, 2012  


                  FIRST QUARTER 2012
                  FINANCIAL RESULTS
                  April 26, 2012


                      Forward‐Looking Statements
                      This presentation contains by reference, “forward‐looking statements” with projections concerning, among other things, 
                      the pending acquisition of the Pringles® business, the Company’s strategy, and the Company’s sales, earnings, margin, 
                      operating profit, costs and expenditures, interest expense, tax rate, capital expenditure, dividends, cash flow, debt 
                      reduction, share repurchases, costs, brand building, ROIC, working capital, growth, new products, innovation, cost 
                      reduction projects, and competitive pressures.  Forward‐looking statements include predictions of future results or 
                      activities and may contain the words “expects,” “believes,” “should,” “will,” “anticipates,” “projects,” “estimates,”  
                      “implies,” “can,” or words or phrases of similar meaning.

                      The Company’s actual results or activities may differ materially from these predictions.  The Company’s future results 
                      could also be affected by a variety of factors, including the ability to complete the acquisition of the Pringles® business 
                      and the realization of the anticipated benefits from the acquisition in the amounts and at the times expected, the impact 
                      of competitive conditions; the effectiveness of pricing, advertising, and promotional programs; the success of innovation, 
                      renovation and new product introductions; the recoverability of the carrying value of goodwill and other intangibles; the 
                      success of productivity improvements and business transitions; commodity and energy prices; labor costs; disruptions or 
                      inefficiencies in supply chain; the availability of and interest rates on short‐term and long‐term financing; actual market 
                      performance of benefit plan trust investments; the levels of spending on systems initiatives, properties, business 
                      opportunities, integration of acquired businesses, and other general and administrative costs; changes in consumer 
                      behavior and preferences; the effect of U.S. and foreign economic conditions on items such as interest rates, statutory 
                      tax rates, currency conversion and availability; legal and regulatory factors including changes in food safety, advertising 
                                                           d    l bl     l l d          l     f          l d    h         f d f         d
                      and labeling laws and regulations; the ultimate impact of product recalls; business disruption or other losses from war, 
                      terrorist acts or political unrest; and other items.  

                      Forward‐looking statements speak only as of the date they were made, and the Company undertakes no obligation to 
                      update them publicly.


                  2


                                                                                                                                                      Page 1 of 11
Kellogg Company                                                                  April 26, 2012  


                      First Quarter 2012 Overview

                          Results lower than expected


                          Adjusted sales and profit outlook for the full‐
                           year


                          Continued weakness in Europe impacting 
                           results


                          Acquisition of Pringles and supply‐chain 
                           process on‐track
                  3


                      First Quarter 2012 – Pringles Update

                       Full transition‐planning teams from P&G and Kellogg 
                         are up and running

                       Detailed checklists and critical‐path items are being 
                             l d h kl         d        l    h           b
                         managed by the team

                       Progress with financing is on track
                       Strategic rationale provides opportunities
                        • International scale, product expansion, and 
                            growth potential

                       We remain very excited about this business! 
                  4


                                                                                  Page 2 of 11
Kellogg Company                                                                                                                                                      April 26, 2012  


                      First Quarter 2012 – Supply‐Chain Update


                             Continued progress – more proactive 


                             Infrastructure – supporting growth strategy


                             People – empowerment


                             Processes and Systems


                  5


                      Summary of Financial Results
                      First Quarter 2012
                      ($ millions, except EPS)


                                Kellogg Company                                                                     First Quarter 2012

                                                                                                               2012                           Growth

                                                              (a)
                                Internal Net Sales                                                        $ 3,440                              0%

                                Internal Operating Profit(a)                                              $     535                           (6)%

                                Reported Earnings Per Share                                               $     1.00                           0%


                          (a)   Internal net sales and operating profit growth exclude the impact of foreign currency translation and if applicable, acquisitions,
                  6
                                dispositions and differences in the number of shipping days.


                                                                                                                                                                      Page 3 of 11
Kellogg Company                                                                                                                  April 26, 2012  


                      Net Sales Components
                      First Quarter 2012
                      (year‐over‐year, % change)


                                                      Internal Growth (0.1)%

                               $3.49 B                  (4.5)%               + 4.4%         (0.3)%      (0.9)%       $3.44 B


                                                                                   (1.3)%


                               1Q 2011                Volume               Price / Mix      Acq/Div.   Currency      1Q 2012
                              Net Sales                                                                              Net Sales


                  7


                      Gross Profit
                      First Quarter 2012 


                                                      $1.4b                                               $1.4b


                                                    40.8%
                                                    40 8%                                                 39.9%
                                                                                                          39 9%
                                                   Margin(a)                                             Margin(a)


                                                   1Q 2011                                               1Q 2012


                  8        (a) Reported gross profit as a % of net sales


                                                                                                                                  Page 4 of 11
Kellogg Company                                                                                                                                                                April 26, 2012  


                      Brand‐Building(a) Investment
                      First Quarter 2012
                   (brand building $)


                  Y-O-Y Change
                  Int. Growth (b)                10%                   4%                   (9)%                 (3)%                                       (4)%
                       Incr./(Decr.)

                                                  Q1                   Q2                   Q3                    Q4                                         Q1


                                                                               2011                                                                       2012
                              (a) Brand building includes advertising, consumer promotions, COGS promotions, and excludes trade spending.
                  9           (b) Internal brand building growth excludes the impact of foreign currency translation and if applicable,
                                   acquisitions, dispositions, and differences in the number of shipping days.


                      Internal Operating Profit Performance by Area
                      First Quarter 2012
                      (year‐over‐year % change, internal performance(a))


                                                                                                                                    11%


                                  (6)%                                             (5)%                   (20)%                                               (1)%


                                                                                 North                                              Latin                    Asia
                         Total Company                                                                    Europe
                                                                                America                                            America                  Pacific


                  10        (a) Internal operating profit performance excludes the impact of foreign currency translation and if applicable, acquisitions, dispositions, and
                                differences in the number of shipping days.


                                                                                                                                                                                Page 5 of 11
Kellogg Company                                                                                                                                                         April 26, 2012  


                   Cash Flow(a)
                   First Quarter 2012


                          Cash flow(a) $277 million

                          Capital expenditure was $63 million or 1.8% of
                           net sales

                          Remain focused on working capital

                          Repurchased $63 million of shares


                  11   (a) Kellogg defines cash flow as cash from operating activities, less capital expenditures; see reconciliation to GAAP cash flow at the end of
                            this presentation.


                   2012 Outlook:
                   Adjusting the Outlook

                                                                                                                             Full Year
                          Internal Net Sales (a)                                                                                   2 – 3%


                          Internal Operating Profit (a)                                                                       Lower by
                             Including Significant Investment in Innovation,                                                   2 – 4%
                             Brand Building, and SAP, but excluding Pringles


                          EPS                                                                                              $3.18 3.30
                                                                                                                           $3 18 – 3 30
                             (As Reported, including Pringles)


                  12    (a) Internal sales and operating profit growth exclude the impact of foreign currency translation and if applicable, acquisitions,
                             dispositions, and differences in the number of shipping days.


                                                                                                                                                                         Page 6 of 11
Kellogg Company                                                                                                                                                              April 26, 2012  


                   Net Sales
                   First Quarter 2012
                   (internal net sales growth(a), year‐over‐year % change)


                                                         2%


                                                                                                                           (4)%


                                              Kellogg North America                                        Kellogg International


                        (a)Internal
                                  sales growth excludes the impact of foreign currency translation and if applicable, acquisitions, dispositions and
                  13
                          differences in the number of shipping days.


                   North America Net Sales
                   First Quarter 2012
                   (internal net sales growth(a), year‐over‐year% change)


                                                                                                               8%


                                                                                                                                                     3%
                                                                        2%


                                 (2)%
                        U.S. Morning                            U.S. Snacks (c)                      U.S. Specialty (d)                      North America 
                       Foods & Kashi (b)                                                                                                        Other(e)

                               (a) Internal sales growth excludes the impact of foreign currency translation and if applicable, acquisitions, dispositions and differences
                                   in the number of shipping days.
                               (b) Includes  U.S. cereal, Pop-Tarts, health and wellness, and Kashi businesses.
                               (c) Includes U.S. cookies, crackers, cereal bars, and fruit-flavored snacks businesses.

                               (d) Includes food service, convenience and Girl Scouts businesses.
                  14
                               (e) Includes the U.S. frozen and Canadian businesses.


                                                                                                                                                                              Page 7 of 11
Kellogg Company                                                                                                                                                        April 26, 2012  


                   U.S. Morning Foods & Kashi(a)
                   First Quarter 2012
                  (net sales, MM)


                             $958
                                                                                                                                         $9
                                                                                                                                         $941
                                                  $927
                                                  $
                                                                       $897


                                                                                             $829

                                                                                                                                      (1.7)% 
                                                                                                                                     Growth(b)

                              Q1                    Q2                   Q3                    Q4                                          Q1

                                                             2011                                                                        2012


                          (a) Includes
                                    U.S. cereal, Pop-Tarts, health and wellness, and Kashi businesses.
                          (b) Internal
                                   sales growth excludes the impact of foreign currency translation and if applicable, acquisitions, dispositions and differences in
                  15
                            the number of shipping days.


                   U.S. Snacks(a)
                   First Quarter 2012
                  (net sales, MM)


                                                                                                                                          $742
                          $725                  $729                  $727
                                                                                             $702


                                                                                                                                        2.3% 
                                                                                                                                      Growth(b)

                            Q1                    Q2                    Q3                     Q4                                          Q1

                                                            2011                                                                         2012

                       (a) IncludesU.S. cookies, crackers, cereal bars, and fruit-flavored snacks businesses.
                       (b) Internal
                                  sales growth excludes the impact of foreign currency translation and if applicable, acquisitions, dispositions, and differences
                  16
                         in the number of shipping days.


                                                                                                                                                                        Page 8 of 11
Kellogg Company                                                                                                                                                          April 26, 2012  


                   U.S. Specialty(a)
                   First Quarter 2012
                  (net sales, MM)


                                                                                                                                        $348
                         $323


                                              $232                   $234
                                                                                           $219

                                                                                                                                      7.8% 
                                                                                                                                    Growth(b)

                          Q1                    Q2                     Q3                    Q4                                           Q1

                                                            2011                                                                        2012
                        (a) Includes food service, convenience and Girl Scouts businesses.
                  17    (b) Internal sales growth excludes the impact of foreign currency translation and if applicable, acquisitions, dispositions and differences in
                            the number of shipping days.


                   North America Other(a)
                   First Quarter 2012
                  (net sales, MM)


                                                                                                                                              $368
                         $358                                           $359
                                                $343
                                                                                               $311


                                                                                                                                            3.4% 
                                                                                                                                            3 4%
                                                                                                                                          Growth(b)

                          Q1                      Q2                     Q3                      Q4                                             Q1

                                                            2011                                                                              2012
                        (a) Includes U.S. Frozen and Canadian businesses.
                  18    (b) Internal sales growth excludes the impact of foreign currency translation and if applicable, acquisitions, dispositions and differences in
                            the number of shipping days.


                                                                                                                                                                          Page 9 of 11
Kellogg Company                                                                                                                                 April 26, 2012  


                   International Growth
                   First Quarter 2012
                  (internal net sales growth(a), year‐over‐year % change)


                                                                                                                                        7%


                                                                                         2%

                                  Europe                                         Asia Pacific                                   Latin America


                                     (10)%

                  19   (a) Internal sales growth excludes the impact of foreign currency translation and if applicable, acquisitions,
                            dispositions and differences in the number of shipping days.


                  Summary

                  While first quarter results were lower than expected, we:

                        Expect gradual sales improvement throughout 2012
                         Expect gradual sales improvement throughout 2012


                        Are continuing to invest in future growth

                  SUMMARY
                     Remain committed to our long‐term business model and 
                  SETTING THE FOUNDATION
                      targets


                        Are excited by the potential provided by the pending 
                         acquisition of Pringles
                  20


                                                                                                                                                Page 10 of 11
Kellogg Company                                                                                                                                                                        April 26, 2012  


                   Appendix 1
                       Reconciliation of Kellogg‐Defined Cash Flow to GAAP Cash Flow (a)

                                                                                                                                             Quarter ended
                                                                                                                                     March 31,                      April 2,
                               (unaudited)                                                                                            2012                           2011

                               Operating activities
                               Net income                                                                                                     $358                           $365
                               Adjustments to reconcile net income to
                               operating cash flows:
                                Depreciation and amortization                                                                                   95                              89
                                Deferred income taxes                                                                                         (53)                               6
                                Other                                                                                                           28                               6
                               Postretirement benefit plan contributions                                                                      (25)                           (178)
                               Changes in operating assets and liabilities                                                                    (63)                              22

                               Net cash provided by operating activities                                                                       340                             310

                               Less:
                               Additions to properties                                                                                        (63)                           (103)

                               Cash flow                                                                                                      $277                           $207


                                   (a) We use this non‐GAAP financial measure of cash flow to focus management and investors on the amount of cash 
                                   available for debt repayment, dividend distributions, acquisition opportunities, and share repurchases. 
                  21


                   Appendix 2
                       Analysis of net sales and operating profit performance

                           First quarter of 2012 versus 2011
                                                           U.S.
                                                          Morning Foods            U.S.           U.S.               North                    Latin     Asia      Corp-    Consoli-
                       (dollars in millions)                  & Kashi             Snacks  Specialty  America Other    Europe    America   Pacific  orate                    dated
                       2012 net sales                     $               941 $       742 $    348 $            368 $      538 $     270 $   233 $     -                   $ 3,440
                       2011 net sales                     $               958 $       725 $    323 $            358 $      621 $     261 $   239 $     -                   $ 3,485
                       % change - 2012 vs. 2011:
                       Internal business (a)                             -1.7%         2.3%           7.8%                   3.4%    -10.4%      7.5%      1.6%      -          -.1%
                       Dispositions (b)                                     -%           -%             -%                     -%        -%        -%    -4.0%       -         -.3%
                       Foreign currency impact                              -%           -%             -%                   -.8%     -3.0%     -3.8%      -.1%      -         -.9%
                       Total change                                      -1.7%         2.3%           7.8%                   2.6%    -13.4%      3.7%     -2.5%      -        -1.3%

                                                              U.S.
                                                          Morning Foods     U.S.     U.S.         North                    Latin      Asia      Corp-    Consoli-
                       (dollars in millions)                & Kashi        Snacks  Specialty   America Other    Europe    America    Pacific    orate      dated
                       2012 operating profit              $          159 $     118 $      71 $             70 $       78 $       51 $      34 $     (46) $    535
                       2011 operating profit              $          181 $     124 $      65 $             70 $      101 $       48 $      31 $     (48) $    572
                       % change - 2012 vs. 2011:
                                g
                       Internal business                              -12.2%          -4.6%           8.1%                     .9%   -19.8%     10.6%     -.6%      4.2%      -6.1%
                       Dispositions (b)                                   -%             -%             -%                      -%       -%        -%    5.7%         -%        .3%
                       Foreign currency impact                            -%             -%             -%                   -.8%     -2.3%     -4.4%    3.3%         -%       -.7%
                       Total change                                   -12.2%          -4.6%           8.1%                     .1%   -22.1%      6.2%    8.4%       4.2%      -6.5%

                       (a) Grow th rate includes volume and price/mix.
                       (b) Impact of results for the quarter ended March 31, 2012 from the divestiture of Navigable Foods.


                  22


                                                                                                                                                                                       Page 11 of 11

More Related Content

What's hot

AkzoNobel Q1 2012 Media Presentation
AkzoNobel Q1 2012 Media PresentationAkzoNobel Q1 2012 Media Presentation
AkzoNobel Q1 2012 Media PresentationAkzoNobel
 
Generali Group 2012 Results
Generali Group 2012 ResultsGenerali Group 2012 Results
Generali Group 2012 ResultsGenerali
 
Bemis Investor Briefing May 2016
Bemis Investor Briefing May 2016Bemis Investor Briefing May 2016
Bemis Investor Briefing May 2016Company Spotlight
 
Q3 2012 Masco Earnings Presentation
Q3 2012 Masco Earnings Presentation Q3 2012 Masco Earnings Presentation
Q3 2012 Masco Earnings Presentation Masco_Investors
 
Reshaping Generali: Discipline, simplicity and focus
Reshaping Generali: Discipline, simplicity and focus Reshaping Generali: Discipline, simplicity and focus
Reshaping Generali: Discipline, simplicity and focus Generali
 
Appendix investor day012215_gef
Appendix investor day012215_gefAppendix investor day012215_gef
Appendix investor day012215_gefgreif2015
 
4 q16 earnings presentation final
4 q16 earnings presentation final4 q16 earnings presentation final
4 q16 earnings presentation finalmasoniteinvestors
 
2018 annual meeting of shareholders final
2018 annual meeting of shareholders final2018 annual meeting of shareholders final
2018 annual meeting of shareholders finalgreif2015
 
jabil circuit Annual Report 2004
jabil circuit Annual Report 2004jabil circuit Annual Report 2004
jabil circuit Annual Report 2004finance22
 
Presentation 20130328 en
Presentation 20130328 enPresentation 20130328 en
Presentation 20130328 endgiplcorponline
 
avery denninson2007AnnualReport
avery denninson2007AnnualReportavery denninson2007AnnualReport
avery denninson2007AnnualReportfinance45
 
ecolab eco97fin
ecolab  eco97finecolab  eco97fin
ecolab eco97finfinance37
 
Inv pres q4 2011 final
Inv pres q4 2011 finalInv pres q4 2011 final
Inv pres q4 2011 finalCNOServices
 
Lehman Brothers Conference Presentation
Lehman Brothers Conference PresentationLehman Brothers Conference Presentation
Lehman Brothers Conference Presentationfinance10
 
Ge Q4 2008 Financial Results
Ge Q4 2008 Financial ResultsGe Q4 2008 Financial Results
Ge Q4 2008 Financial Resultsearningsreport
 

What's hot (20)

Guidance presentation jan 2013 final
Guidance presentation jan 2013 finalGuidance presentation jan 2013 final
Guidance presentation jan 2013 final
 
Chase Corp
Chase CorpChase Corp
Chase Corp
 
AkzoNobel Q1 2012 Media Presentation
AkzoNobel Q1 2012 Media PresentationAkzoNobel Q1 2012 Media Presentation
AkzoNobel Q1 2012 Media Presentation
 
Generali Group 2012 Results
Generali Group 2012 ResultsGenerali Group 2012 Results
Generali Group 2012 Results
 
Bemis Investor Briefing May 2016
Bemis Investor Briefing May 2016Bemis Investor Briefing May 2016
Bemis Investor Briefing May 2016
 
Q3 2012 Masco Earnings Presentation
Q3 2012 Masco Earnings Presentation Q3 2012 Masco Earnings Presentation
Q3 2012 Masco Earnings Presentation
 
Reshaping Generali: Discipline, simplicity and focus
Reshaping Generali: Discipline, simplicity and focus Reshaping Generali: Discipline, simplicity and focus
Reshaping Generali: Discipline, simplicity and focus
 
Appendix investor day012215_gef
Appendix investor day012215_gefAppendix investor day012215_gef
Appendix investor day012215_gef
 
4 q16 earnings presentation final
4 q16 earnings presentation final4 q16 earnings presentation final
4 q16 earnings presentation final
 
2018 annual meeting of shareholders final
2018 annual meeting of shareholders final2018 annual meeting of shareholders final
2018 annual meeting of shareholders final
 
jabil circuit Annual Report 2004
jabil circuit Annual Report 2004jabil circuit Annual Report 2004
jabil circuit Annual Report 2004
 
Raymond James 2013
Raymond James 2013 Raymond James 2013
Raymond James 2013
 
Presentation 20130328 en
Presentation 20130328 enPresentation 20130328 en
Presentation 20130328 en
 
avery denninson2007AnnualReport
avery denninson2007AnnualReportavery denninson2007AnnualReport
avery denninson2007AnnualReport
 
ecolab eco97fin
ecolab  eco97finecolab  eco97fin
ecolab eco97fin
 
Earnings Release Report 1Q12
Earnings Release Report 1Q12Earnings Release Report 1Q12
Earnings Release Report 1Q12
 
Inv pres q4 2011 final
Inv pres q4 2011 finalInv pres q4 2011 final
Inv pres q4 2011 final
 
Lehman Brothers Conference Presentation
Lehman Brothers Conference PresentationLehman Brothers Conference Presentation
Lehman Brothers Conference Presentation
 
Ge Q4 2008 Financial Results
Ge Q4 2008 Financial ResultsGe Q4 2008 Financial Results
Ge Q4 2008 Financial Results
 
Beazley
BeazleyBeazley
Beazley
 

Viewers also liked

The Transition Years
The Transition YearsThe Transition Years
The Transition Yearsemily_easybib
 
Education Is Now Social
Education Is Now SocialEducation Is Now Social
Education Is Now Socialemily_easybib
 
Under the Influence: Your fool-proof guide to influencer marketing
Under the Influence: Your fool-proof guide to influencer marketingUnder the Influence: Your fool-proof guide to influencer marketing
Under the Influence: Your fool-proof guide to influencer marketingExperticity
 
NGO平台組織之運作與挑戰:311災難與JANIC
NGO平台組織之運作與挑戰:311災難與JANICNGO平台組織之運作與挑戰:311災難與JANIC
NGO平台組織之運作與挑戰:311災難與JANICHans Huang
 
Scale Invariant Feature Tranform
Scale Invariant Feature TranformScale Invariant Feature Tranform
Scale Invariant Feature TranformShanker Naik
 
Personallity vs. Professionalism
Personallity vs. ProfessionalismPersonallity vs. Professionalism
Personallity vs. ProfessionalismArielle919
 
Influencer Marketing: The Honeymoon is Over
Influencer Marketing: The Honeymoon is OverInfluencer Marketing: The Honeymoon is Over
Influencer Marketing: The Honeymoon is OverExperticity
 
Scale Invariant feature transform
Scale Invariant feature transformScale Invariant feature transform
Scale Invariant feature transformShanker Naik
 
Business Strategy Analysis on Facebook
Business Strategy Analysis on FacebookBusiness Strategy Analysis on Facebook
Business Strategy Analysis on FacebookShanker Naik
 

Viewers also liked (16)

Paying attention
Paying attentionPaying attention
Paying attention
 
The Transition Years
The Transition YearsThe Transition Years
The Transition Years
 
Presentación1
Presentación1Presentación1
Presentación1
 
Education Is Now Social
Education Is Now SocialEducation Is Now Social
Education Is Now Social
 
Under the Influence: Your fool-proof guide to influencer marketing
Under the Influence: Your fool-proof guide to influencer marketingUnder the Influence: Your fool-proof guide to influencer marketing
Under the Influence: Your fool-proof guide to influencer marketing
 
Himym
HimymHimym
Himym
 
Ballet
BalletBallet
Ballet
 
Epp Example
Epp ExampleEpp Example
Epp Example
 
Pendekatan kodayl
Pendekatan kodaylPendekatan kodayl
Pendekatan kodayl
 
NGO平台組織之運作與挑戰:311災難與JANIC
NGO平台組織之運作與挑戰:311災難與JANICNGO平台組織之運作與挑戰:311災難與JANIC
NGO平台組織之運作與挑戰:311災難與JANIC
 
Delibera giunta n_175
Delibera giunta n_175Delibera giunta n_175
Delibera giunta n_175
 
Scale Invariant Feature Tranform
Scale Invariant Feature TranformScale Invariant Feature Tranform
Scale Invariant Feature Tranform
 
Personallity vs. Professionalism
Personallity vs. ProfessionalismPersonallity vs. Professionalism
Personallity vs. Professionalism
 
Influencer Marketing: The Honeymoon is Over
Influencer Marketing: The Honeymoon is OverInfluencer Marketing: The Honeymoon is Over
Influencer Marketing: The Honeymoon is Over
 
Scale Invariant feature transform
Scale Invariant feature transformScale Invariant feature transform
Scale Invariant feature transform
 
Business Strategy Analysis on Facebook
Business Strategy Analysis on FacebookBusiness Strategy Analysis on Facebook
Business Strategy Analysis on Facebook
 

Similar to Kellogg Company Announces First Quarter 2012 Financial Results

LinkedIn Q3 2012 Earnings
LinkedIn Q3 2012 Earnings LinkedIn Q3 2012 Earnings
LinkedIn Q3 2012 Earnings LinkedIn
 
Kerry Nelson - Carlson Fixed Income Fund - Returns and Attribution Analysis -...
Kerry Nelson - Carlson Fixed Income Fund - Returns and Attribution Analysis -...Kerry Nelson - Carlson Fixed Income Fund - Returns and Attribution Analysis -...
Kerry Nelson - Carlson Fixed Income Fund - Returns and Attribution Analysis -...kerrynelson
 
ITT Corporation Q1 2012 Earnings
ITT Corporation Q1 2012 EarningsITT Corporation Q1 2012 Earnings
ITT Corporation Q1 2012 EarningsITT Corporation
 
Jefferies industrials conf. aug 11 small
Jefferies industrials conf. aug 11 smallJefferies industrials conf. aug 11 small
Jefferies industrials conf. aug 11 smalldynamicmaterials
 
Second Quarter Masco Earnings Presentation
Second Quarter Masco Earnings PresentationSecond Quarter Masco Earnings Presentation
Second Quarter Masco Earnings PresentationMasco_Investors
 
Boom March 2011 IR Presentation
Boom March 2011 IR PresentationBoom March 2011 IR Presentation
Boom March 2011 IR Presentationdynamicmaterials
 
Dynamic Materials Investor Presentation
Dynamic Materials Investor PresentationDynamic Materials Investor Presentation
Dynamic Materials Investor PresentationCompany Spotlight
 
Boom may '11 ir presentation
Boom may '11 ir presentationBoom may '11 ir presentation
Boom may '11 ir presentationdynamicmaterials
 
Genworth MI Canada Inc. Second Quarter 2013
Genworth MI Canada Inc.  Second Quarter 2013Genworth MI Canada Inc.  Second Quarter 2013
Genworth MI Canada Inc. Second Quarter 2013genworth_financial
 
BG Group FY2012 results presentation
BG Group FY2012 results presentationBG Group FY2012 results presentation
BG Group FY2012 results presentationTradeWindsnews
 
NiSource FY 2012 Earnings PowerPoint Presentation
NiSource FY 2012 Earnings PowerPoint PresentationNiSource FY 2012 Earnings PowerPoint Presentation
NiSource FY 2012 Earnings PowerPoint PresentationMarcellus Drilling News
 
AmCham Taipei 2012 Business Climate Survey January
AmCham Taipei  2012 Business Climate Survey JanuaryAmCham Taipei  2012 Business Climate Survey January
AmCham Taipei 2012 Business Climate Survey JanuaryGordon Stewart
 
Am chamtaipei 2012 business climate survey january
Am chamtaipei  2012 business climate survey januaryAm chamtaipei  2012 business climate survey january
Am chamtaipei 2012 business climate survey januaryGordon10
 

Similar to Kellogg Company Announces First Quarter 2012 Financial Results (20)

LinkedIn Q3 2012 Earnings
LinkedIn Q3 2012 Earnings LinkedIn Q3 2012 Earnings
LinkedIn Q3 2012 Earnings
 
Q1 2012 presentation
Q1 2012 presentationQ1 2012 presentation
Q1 2012 presentation
 
4Q 2012 Presentation
4Q 2012 Presentation4Q 2012 Presentation
4Q 2012 Presentation
 
Kerry Nelson - Carlson Fixed Income Fund - Returns and Attribution Analysis -...
Kerry Nelson - Carlson Fixed Income Fund - Returns and Attribution Analysis -...Kerry Nelson - Carlson Fixed Income Fund - Returns and Attribution Analysis -...
Kerry Nelson - Carlson Fixed Income Fund - Returns and Attribution Analysis -...
 
ITT Corporation Q1 2012 Earnings
ITT Corporation Q1 2012 EarningsITT Corporation Q1 2012 Earnings
ITT Corporation Q1 2012 Earnings
 
Jefferies industrials conf. aug 11 small
Jefferies industrials conf. aug 11 smallJefferies industrials conf. aug 11 small
Jefferies industrials conf. aug 11 small
 
Q4 2012 Presentation
Q4 2012 PresentationQ4 2012 Presentation
Q4 2012 Presentation
 
Annual Meeting of Shareholders
 Annual Meeting of Shareholders Annual Meeting of Shareholders
Annual Meeting of Shareholders
 
Fourth Quarter 2012
Fourth Quarter 2012Fourth Quarter 2012
Fourth Quarter 2012
 
Second Quarter Masco Earnings Presentation
Second Quarter Masco Earnings PresentationSecond Quarter Masco Earnings Presentation
Second Quarter Masco Earnings Presentation
 
Boom March 2011 IR Presentation
Boom March 2011 IR PresentationBoom March 2011 IR Presentation
Boom March 2011 IR Presentation
 
Mfc 4 q12_slides
Mfc 4 q12_slidesMfc 4 q12_slides
Mfc 4 q12_slides
 
Dynamic Materials Investor Presentation
Dynamic Materials Investor PresentationDynamic Materials Investor Presentation
Dynamic Materials Investor Presentation
 
Boom may '11 ir presentation
Boom may '11 ir presentationBoom may '11 ir presentation
Boom may '11 ir presentation
 
Boom 3 12 final small
Boom 3 12 final smallBoom 3 12 final small
Boom 3 12 final small
 
Genworth MI Canada Inc. Second Quarter 2013
Genworth MI Canada Inc.  Second Quarter 2013Genworth MI Canada Inc.  Second Quarter 2013
Genworth MI Canada Inc. Second Quarter 2013
 
BG Group FY2012 results presentation
BG Group FY2012 results presentationBG Group FY2012 results presentation
BG Group FY2012 results presentation
 
NiSource FY 2012 Earnings PowerPoint Presentation
NiSource FY 2012 Earnings PowerPoint PresentationNiSource FY 2012 Earnings PowerPoint Presentation
NiSource FY 2012 Earnings PowerPoint Presentation
 
AmCham Taipei 2012 Business Climate Survey January
AmCham Taipei  2012 Business Climate Survey JanuaryAmCham Taipei  2012 Business Climate Survey January
AmCham Taipei 2012 Business Climate Survey January
 
Am chamtaipei 2012 business climate survey january
Am chamtaipei  2012 business climate survey januaryAm chamtaipei  2012 business climate survey january
Am chamtaipei 2012 business climate survey january
 

Recently uploaded

VIP Amritsar Call Girl 7001035870 Enjoy Call Girls With Our Escorts
VIP Amritsar Call Girl 7001035870 Enjoy Call Girls With Our EscortsVIP Amritsar Call Girl 7001035870 Enjoy Call Girls With Our Escorts
VIP Amritsar Call Girl 7001035870 Enjoy Call Girls With Our Escortssonatiwari757
 
CALL ON ➥8923113531 🔝Call Girls Fazullaganj Lucknow best sexual service
CALL ON ➥8923113531 🔝Call Girls Fazullaganj Lucknow best sexual serviceCALL ON ➥8923113531 🔝Call Girls Fazullaganj Lucknow best sexual service
CALL ON ➥8923113531 🔝Call Girls Fazullaganj Lucknow best sexual serviceanilsa9823
 
Corporate Presentation Probe May 2024.pdf
Corporate Presentation Probe May 2024.pdfCorporate Presentation Probe May 2024.pdf
Corporate Presentation Probe May 2024.pdfProbe Gold
 
VIP Call Girl Amritsar 7001035870 Enjoy Call Girls With Our Escorts
VIP Call Girl Amritsar 7001035870 Enjoy Call Girls With Our EscortsVIP Call Girl Amritsar 7001035870 Enjoy Call Girls With Our Escorts
VIP Call Girl Amritsar 7001035870 Enjoy Call Girls With Our Escortssonatiwari757
 
VIP Kolkata Call Girl Rishra 👉 8250192130 Available With Room
VIP Kolkata Call Girl Rishra 👉 8250192130  Available With RoomVIP Kolkata Call Girl Rishra 👉 8250192130  Available With Room
VIP Kolkata Call Girl Rishra 👉 8250192130 Available With Roomdivyansh0kumar0
 
VIP 7001035870 Find & Meet Hyderabad Call Girls Abids high-profile Call Girl
VIP 7001035870 Find & Meet Hyderabad Call Girls Abids high-profile Call GirlVIP 7001035870 Find & Meet Hyderabad Call Girls Abids high-profile Call Girl
VIP 7001035870 Find & Meet Hyderabad Call Girls Abids high-profile Call Girladitipandeya
 
CALL ON ➥8923113531 🔝Call Girls Vineet Khand Lucknow best Night Fun service 🧦
CALL ON ➥8923113531 🔝Call Girls Vineet Khand Lucknow best Night Fun service  🧦CALL ON ➥8923113531 🔝Call Girls Vineet Khand Lucknow best Night Fun service  🧦
CALL ON ➥8923113531 🔝Call Girls Vineet Khand Lucknow best Night Fun service 🧦anilsa9823
 
High Profile Call Girls Kolkata Gayatri 🤌 8250192130 🚀 Vip Call Girls Kolkata
High Profile Call Girls Kolkata Gayatri 🤌  8250192130 🚀 Vip Call Girls KolkataHigh Profile Call Girls Kolkata Gayatri 🤌  8250192130 🚀 Vip Call Girls Kolkata
High Profile Call Girls Kolkata Gayatri 🤌 8250192130 🚀 Vip Call Girls Kolkataanamikaraghav4
 
Call Girls In Amritsar 💯Call Us 🔝 76967 34778🔝 💃 Independent Escort In Amritsar
Call Girls In Amritsar 💯Call Us 🔝 76967 34778🔝 💃 Independent Escort In AmritsarCall Girls In Amritsar 💯Call Us 🔝 76967 34778🔝 💃 Independent Escort In Amritsar
Call Girls In Amritsar 💯Call Us 🔝 76967 34778🔝 💃 Independent Escort In Amritsaronly4webmaster01
 
VIP Kolkata Call Girl Entally 👉 8250192130 Available With Room
VIP Kolkata Call Girl Entally 👉 8250192130  Available With RoomVIP Kolkata Call Girl Entally 👉 8250192130  Available With Room
VIP Kolkata Call Girl Entally 👉 8250192130 Available With Roomdivyansh0kumar0
 
Teck Investor Presentation, April 24, 2024
Teck Investor Presentation, April 24, 2024Teck Investor Presentation, April 24, 2024
Teck Investor Presentation, April 24, 2024TeckResourcesLtd
 

Recently uploaded (20)

Vip Call Girls Vasant Kunj ➡️ Delhi ➡️ 9999965857 No Advance 24HRS Live
Vip Call Girls Vasant Kunj ➡️ Delhi ➡️ 9999965857 No Advance 24HRS LiveVip Call Girls Vasant Kunj ➡️ Delhi ➡️ 9999965857 No Advance 24HRS Live
Vip Call Girls Vasant Kunj ➡️ Delhi ➡️ 9999965857 No Advance 24HRS Live
 
VIP Amritsar Call Girl 7001035870 Enjoy Call Girls With Our Escorts
VIP Amritsar Call Girl 7001035870 Enjoy Call Girls With Our EscortsVIP Amritsar Call Girl 7001035870 Enjoy Call Girls With Our Escorts
VIP Amritsar Call Girl 7001035870 Enjoy Call Girls With Our Escorts
 
CALL ON ➥8923113531 🔝Call Girls Fazullaganj Lucknow best sexual service
CALL ON ➥8923113531 🔝Call Girls Fazullaganj Lucknow best sexual serviceCALL ON ➥8923113531 🔝Call Girls Fazullaganj Lucknow best sexual service
CALL ON ➥8923113531 🔝Call Girls Fazullaganj Lucknow best sexual service
 
Russian Call Girls Rohini Sector 22 💓 Delhi 9999965857 @Sabina Modi VVIP MODE...
Russian Call Girls Rohini Sector 22 💓 Delhi 9999965857 @Sabina Modi VVIP MODE...Russian Call Girls Rohini Sector 22 💓 Delhi 9999965857 @Sabina Modi VVIP MODE...
Russian Call Girls Rohini Sector 22 💓 Delhi 9999965857 @Sabina Modi VVIP MODE...
 
Call Girls 🫤 Mukherjee Nagar ➡️ 9999965857 ➡️ Delhi 🫦 Russian Escorts FULL ...
Call Girls 🫤 Mukherjee Nagar ➡️ 9999965857  ➡️ Delhi 🫦  Russian Escorts FULL ...Call Girls 🫤 Mukherjee Nagar ➡️ 9999965857  ➡️ Delhi 🫦  Russian Escorts FULL ...
Call Girls 🫤 Mukherjee Nagar ➡️ 9999965857 ➡️ Delhi 🫦 Russian Escorts FULL ...
 
Corporate Presentation Probe May 2024.pdf
Corporate Presentation Probe May 2024.pdfCorporate Presentation Probe May 2024.pdf
Corporate Presentation Probe May 2024.pdf
 
VIP Call Girl Amritsar 7001035870 Enjoy Call Girls With Our Escorts
VIP Call Girl Amritsar 7001035870 Enjoy Call Girls With Our EscortsVIP Call Girl Amritsar 7001035870 Enjoy Call Girls With Our Escorts
VIP Call Girl Amritsar 7001035870 Enjoy Call Girls With Our Escorts
 
Call Girls 🫤 Nehru Place ➡️ 9999965857 ➡️ Delhi 🫦 Russian Escorts FULL ENJOY
Call Girls 🫤 Nehru Place ➡️ 9999965857  ➡️ Delhi 🫦  Russian Escorts FULL ENJOYCall Girls 🫤 Nehru Place ➡️ 9999965857  ➡️ Delhi 🫦  Russian Escorts FULL ENJOY
Call Girls 🫤 Nehru Place ➡️ 9999965857 ➡️ Delhi 🫦 Russian Escorts FULL ENJOY
 
VIP Kolkata Call Girl Rishra 👉 8250192130 Available With Room
VIP Kolkata Call Girl Rishra 👉 8250192130  Available With RoomVIP Kolkata Call Girl Rishra 👉 8250192130  Available With Room
VIP Kolkata Call Girl Rishra 👉 8250192130 Available With Room
 
Call Girls In Vasant Kunj 📱 9999965857 🤩 Delhi 🫦 HOT AND SEXY VVIP 🍎 SERVICE
Call Girls In Vasant Kunj 📱  9999965857  🤩 Delhi 🫦 HOT AND SEXY VVIP 🍎 SERVICECall Girls In Vasant Kunj 📱  9999965857  🤩 Delhi 🫦 HOT AND SEXY VVIP 🍎 SERVICE
Call Girls In Vasant Kunj 📱 9999965857 🤩 Delhi 🫦 HOT AND SEXY VVIP 🍎 SERVICE
 
VIP 7001035870 Find & Meet Hyderabad Call Girls Abids high-profile Call Girl
VIP 7001035870 Find & Meet Hyderabad Call Girls Abids high-profile Call GirlVIP 7001035870 Find & Meet Hyderabad Call Girls Abids high-profile Call Girl
VIP 7001035870 Find & Meet Hyderabad Call Girls Abids high-profile Call Girl
 
CALL ON ➥8923113531 🔝Call Girls Vineet Khand Lucknow best Night Fun service 🧦
CALL ON ➥8923113531 🔝Call Girls Vineet Khand Lucknow best Night Fun service  🧦CALL ON ➥8923113531 🔝Call Girls Vineet Khand Lucknow best Night Fun service  🧦
CALL ON ➥8923113531 🔝Call Girls Vineet Khand Lucknow best Night Fun service 🧦
 
High Profile Call Girls Kolkata Gayatri 🤌 8250192130 🚀 Vip Call Girls Kolkata
High Profile Call Girls Kolkata Gayatri 🤌  8250192130 🚀 Vip Call Girls KolkataHigh Profile Call Girls Kolkata Gayatri 🤌  8250192130 🚀 Vip Call Girls Kolkata
High Profile Call Girls Kolkata Gayatri 🤌 8250192130 🚀 Vip Call Girls Kolkata
 
Call Girls In Amritsar 💯Call Us 🔝 76967 34778🔝 💃 Independent Escort In Amritsar
Call Girls In Amritsar 💯Call Us 🔝 76967 34778🔝 💃 Independent Escort In AmritsarCall Girls In Amritsar 💯Call Us 🔝 76967 34778🔝 💃 Independent Escort In Amritsar
Call Girls In Amritsar 💯Call Us 🔝 76967 34778🔝 💃 Independent Escort In Amritsar
 
Escort Service Call Girls In Shalimar Bagh, 99530°56974 Delhi NCR
Escort Service Call Girls In Shalimar Bagh, 99530°56974 Delhi NCREscort Service Call Girls In Shalimar Bagh, 99530°56974 Delhi NCR
Escort Service Call Girls In Shalimar Bagh, 99530°56974 Delhi NCR
 
VIP Kolkata Call Girl Entally 👉 8250192130 Available With Room
VIP Kolkata Call Girl Entally 👉 8250192130  Available With RoomVIP Kolkata Call Girl Entally 👉 8250192130  Available With Room
VIP Kolkata Call Girl Entally 👉 8250192130 Available With Room
 
Teck Investor Presentation, April 24, 2024
Teck Investor Presentation, April 24, 2024Teck Investor Presentation, April 24, 2024
Teck Investor Presentation, April 24, 2024
 
Model Call Girl in Uttam Nagar Delhi reach out to us at 🔝9953056974🔝
Model Call Girl in Uttam Nagar Delhi reach out to us at 🔝9953056974🔝Model Call Girl in Uttam Nagar Delhi reach out to us at 🔝9953056974🔝
Model Call Girl in Uttam Nagar Delhi reach out to us at 🔝9953056974🔝
 
Rohini Sector 17 Call Girls Delhi 9999965857 @Sabina Saikh No Advance
Rohini Sector 17 Call Girls Delhi 9999965857 @Sabina Saikh No AdvanceRohini Sector 17 Call Girls Delhi 9999965857 @Sabina Saikh No Advance
Rohini Sector 17 Call Girls Delhi 9999965857 @Sabina Saikh No Advance
 
VIP Call Girls Kolkata Kirti Call Now 8617697112 Kolkata Escorts
VIP Call Girls Kolkata Kirti Call Now 8617697112 Kolkata EscortsVIP Call Girls Kolkata Kirti Call Now 8617697112 Kolkata Escorts
VIP Call Girls Kolkata Kirti Call Now 8617697112 Kolkata Escorts
 

Kellogg Company Announces First Quarter 2012 Financial Results

  • 1. Kellogg Company April 26, 2012   FIRST QUARTER 2012 FINANCIAL RESULTS April 26, 2012 Forward‐Looking Statements This presentation contains by reference, “forward‐looking statements” with projections concerning, among other things,  the pending acquisition of the Pringles® business, the Company’s strategy, and the Company’s sales, earnings, margin,  operating profit, costs and expenditures, interest expense, tax rate, capital expenditure, dividends, cash flow, debt  reduction, share repurchases, costs, brand building, ROIC, working capital, growth, new products, innovation, cost  reduction projects, and competitive pressures.  Forward‐looking statements include predictions of future results or  activities and may contain the words “expects,” “believes,” “should,” “will,” “anticipates,” “projects,” “estimates,”   “implies,” “can,” or words or phrases of similar meaning. The Company’s actual results or activities may differ materially from these predictions.  The Company’s future results  could also be affected by a variety of factors, including the ability to complete the acquisition of the Pringles® business  and the realization of the anticipated benefits from the acquisition in the amounts and at the times expected, the impact  of competitive conditions; the effectiveness of pricing, advertising, and promotional programs; the success of innovation,  renovation and new product introductions; the recoverability of the carrying value of goodwill and other intangibles; the  success of productivity improvements and business transitions; commodity and energy prices; labor costs; disruptions or  inefficiencies in supply chain; the availability of and interest rates on short‐term and long‐term financing; actual market  performance of benefit plan trust investments; the levels of spending on systems initiatives, properties, business  opportunities, integration of acquired businesses, and other general and administrative costs; changes in consumer  behavior and preferences; the effect of U.S. and foreign economic conditions on items such as interest rates, statutory  tax rates, currency conversion and availability; legal and regulatory factors including changes in food safety, advertising  d l bl l l d l f l d h f d f d and labeling laws and regulations; the ultimate impact of product recalls; business disruption or other losses from war,  terrorist acts or political unrest; and other items.   Forward‐looking statements speak only as of the date they were made, and the Company undertakes no obligation to  update them publicly. 2 Page 1 of 11
  • 2. Kellogg Company April 26, 2012   First Quarter 2012 Overview  Results lower than expected  Adjusted sales and profit outlook for the full‐ year  Continued weakness in Europe impacting  results  Acquisition of Pringles and supply‐chain  process on‐track 3 First Quarter 2012 – Pringles Update  Full transition‐planning teams from P&G and Kellogg  are up and running  Detailed checklists and critical‐path items are being  l d h kl d l h b managed by the team  Progress with financing is on track  Strategic rationale provides opportunities • International scale, product expansion, and  growth potential  We remain very excited about this business!  4 Page 2 of 11
  • 3. Kellogg Company April 26, 2012   First Quarter 2012 – Supply‐Chain Update  Continued progress – more proactive   Infrastructure – supporting growth strategy  People – empowerment  Processes and Systems 5 Summary of Financial Results First Quarter 2012 ($ millions, except EPS) Kellogg Company First Quarter 2012 2012 Growth (a) Internal Net Sales $ 3,440 0% Internal Operating Profit(a) $ 535 (6)% Reported Earnings Per Share $ 1.00 0% (a) Internal net sales and operating profit growth exclude the impact of foreign currency translation and if applicable, acquisitions, 6 dispositions and differences in the number of shipping days. Page 3 of 11
  • 4. Kellogg Company April 26, 2012   Net Sales Components First Quarter 2012 (year‐over‐year, % change) Internal Growth (0.1)% $3.49 B (4.5)% + 4.4% (0.3)% (0.9)% $3.44 B (1.3)% 1Q 2011 Volume Price / Mix Acq/Div. Currency 1Q 2012 Net Sales Net Sales 7 Gross Profit First Quarter 2012  $1.4b $1.4b 40.8% 40 8% 39.9% 39 9% Margin(a) Margin(a) 1Q 2011 1Q 2012 8 (a) Reported gross profit as a % of net sales Page 4 of 11
  • 5. Kellogg Company April 26, 2012   Brand‐Building(a) Investment First Quarter 2012 (brand building $) Y-O-Y Change Int. Growth (b) 10% 4% (9)% (3)% (4)% Incr./(Decr.) Q1 Q2 Q3 Q4 Q1 2011 2012 (a) Brand building includes advertising, consumer promotions, COGS promotions, and excludes trade spending. 9 (b) Internal brand building growth excludes the impact of foreign currency translation and if applicable, acquisitions, dispositions, and differences in the number of shipping days. Internal Operating Profit Performance by Area First Quarter 2012 (year‐over‐year % change, internal performance(a)) 11% (6)% (5)% (20)% (1)% North Latin Asia Total Company Europe America America Pacific 10 (a) Internal operating profit performance excludes the impact of foreign currency translation and if applicable, acquisitions, dispositions, and differences in the number of shipping days. Page 5 of 11
  • 6. Kellogg Company April 26, 2012   Cash Flow(a) First Quarter 2012  Cash flow(a) $277 million  Capital expenditure was $63 million or 1.8% of net sales  Remain focused on working capital  Repurchased $63 million of shares 11 (a) Kellogg defines cash flow as cash from operating activities, less capital expenditures; see reconciliation to GAAP cash flow at the end of this presentation. 2012 Outlook: Adjusting the Outlook Full Year Internal Net Sales (a) 2 – 3% Internal Operating Profit (a) Lower by Including Significant Investment in Innovation, 2 – 4% Brand Building, and SAP, but excluding Pringles EPS $3.18 3.30 $3 18 – 3 30 (As Reported, including Pringles) 12 (a) Internal sales and operating profit growth exclude the impact of foreign currency translation and if applicable, acquisitions, dispositions, and differences in the number of shipping days. Page 6 of 11
  • 7. Kellogg Company April 26, 2012   Net Sales First Quarter 2012 (internal net sales growth(a), year‐over‐year % change) 2% (4)% Kellogg North America Kellogg International (a)Internal sales growth excludes the impact of foreign currency translation and if applicable, acquisitions, dispositions and 13 differences in the number of shipping days. North America Net Sales First Quarter 2012 (internal net sales growth(a), year‐over‐year% change) 8% 3% 2% (2)% U.S. Morning  U.S. Snacks (c) U.S. Specialty (d) North America  Foods & Kashi (b) Other(e) (a) Internal sales growth excludes the impact of foreign currency translation and if applicable, acquisitions, dispositions and differences in the number of shipping days. (b) Includes U.S. cereal, Pop-Tarts, health and wellness, and Kashi businesses. (c) Includes U.S. cookies, crackers, cereal bars, and fruit-flavored snacks businesses. (d) Includes food service, convenience and Girl Scouts businesses. 14 (e) Includes the U.S. frozen and Canadian businesses. Page 7 of 11
  • 8. Kellogg Company April 26, 2012   U.S. Morning Foods & Kashi(a) First Quarter 2012 (net sales, MM) $958 $9 $941 $927 $ $897 $829 (1.7)%  Growth(b) Q1 Q2 Q3 Q4 Q1 2011 2012 (a) Includes U.S. cereal, Pop-Tarts, health and wellness, and Kashi businesses. (b) Internal sales growth excludes the impact of foreign currency translation and if applicable, acquisitions, dispositions and differences in 15 the number of shipping days. U.S. Snacks(a) First Quarter 2012 (net sales, MM) $742 $725 $729 $727 $702 2.3%  Growth(b) Q1 Q2 Q3 Q4 Q1 2011 2012 (a) IncludesU.S. cookies, crackers, cereal bars, and fruit-flavored snacks businesses. (b) Internal sales growth excludes the impact of foreign currency translation and if applicable, acquisitions, dispositions, and differences 16 in the number of shipping days. Page 8 of 11
  • 9. Kellogg Company April 26, 2012   U.S. Specialty(a) First Quarter 2012 (net sales, MM) $348 $323 $232 $234 $219 7.8%  Growth(b) Q1 Q2 Q3 Q4 Q1 2011 2012 (a) Includes food service, convenience and Girl Scouts businesses. 17 (b) Internal sales growth excludes the impact of foreign currency translation and if applicable, acquisitions, dispositions and differences in the number of shipping days. North America Other(a) First Quarter 2012 (net sales, MM) $368 $358 $359 $343 $311 3.4%  3 4% Growth(b) Q1 Q2 Q3 Q4 Q1 2011 2012 (a) Includes U.S. Frozen and Canadian businesses. 18 (b) Internal sales growth excludes the impact of foreign currency translation and if applicable, acquisitions, dispositions and differences in the number of shipping days. Page 9 of 11
  • 10. Kellogg Company April 26, 2012   International Growth First Quarter 2012 (internal net sales growth(a), year‐over‐year % change) 7% 2% Europe Asia Pacific Latin America (10)% 19 (a) Internal sales growth excludes the impact of foreign currency translation and if applicable, acquisitions, dispositions and differences in the number of shipping days. Summary While first quarter results were lower than expected, we:  Expect gradual sales improvement throughout 2012 Expect gradual sales improvement throughout 2012  Are continuing to invest in future growth SUMMARY  Remain committed to our long‐term business model and  SETTING THE FOUNDATION targets  Are excited by the potential provided by the pending  acquisition of Pringles 20 Page 10 of 11
  • 11. Kellogg Company April 26, 2012   Appendix 1 Reconciliation of Kellogg‐Defined Cash Flow to GAAP Cash Flow (a) Quarter ended March 31, April 2, (unaudited) 2012 2011 Operating activities Net income $358 $365 Adjustments to reconcile net income to operating cash flows: Depreciation and amortization 95 89 Deferred income taxes (53) 6 Other 28 6 Postretirement benefit plan contributions (25) (178) Changes in operating assets and liabilities (63) 22 Net cash provided by operating activities 340 310 Less: Additions to properties (63) (103) Cash flow $277 $207 (a) We use this non‐GAAP financial measure of cash flow to focus management and investors on the amount of cash  available for debt repayment, dividend distributions, acquisition opportunities, and share repurchases.  21 Appendix 2 Analysis of net sales and operating profit performance First quarter of 2012 versus 2011 U.S. Morning Foods U.S. U.S. North Latin Asia Corp- Consoli- (dollars in millions) & Kashi Snacks Specialty America Other Europe America Pacific orate dated 2012 net sales $ 941 $ 742 $ 348 $ 368 $ 538 $ 270 $ 233 $ - $ 3,440 2011 net sales $ 958 $ 725 $ 323 $ 358 $ 621 $ 261 $ 239 $ - $ 3,485 % change - 2012 vs. 2011: Internal business (a) -1.7% 2.3% 7.8% 3.4% -10.4% 7.5% 1.6% - -.1% Dispositions (b) -% -% -% -% -% -% -4.0% - -.3% Foreign currency impact -% -% -% -.8% -3.0% -3.8% -.1% - -.9% Total change -1.7% 2.3% 7.8% 2.6% -13.4% 3.7% -2.5% - -1.3% U.S. Morning Foods U.S. U.S. North Latin Asia Corp- Consoli- (dollars in millions) & Kashi Snacks Specialty America Other Europe America Pacific orate dated 2012 operating profit $ 159 $ 118 $ 71 $ 70 $ 78 $ 51 $ 34 $ (46) $ 535 2011 operating profit $ 181 $ 124 $ 65 $ 70 $ 101 $ 48 $ 31 $ (48) $ 572 % change - 2012 vs. 2011: g Internal business -12.2% -4.6% 8.1% .9% -19.8% 10.6% -.6% 4.2% -6.1% Dispositions (b) -% -% -% -% -% -% 5.7% -% .3% Foreign currency impact -% -% -% -.8% -2.3% -4.4% 3.3% -% -.7% Total change -12.2% -4.6% 8.1% .1% -22.1% 6.2% 8.4% 4.2% -6.5% (a) Grow th rate includes volume and price/mix. (b) Impact of results for the quarter ended March 31, 2012 from the divestiture of Navigable Foods. 22 Page 11 of 11