Downloaded 44 times


![Bill of Materials
Sl. No. Item Qty Remarks
1. Q-Insure Core (Installer, Data 1 Base component
Manager, Monitor)
2. Q-Insure Life Data Model 1
3. Q-Insure P&C Data Model 1
4. Q-Insure Deployer 1
5. Q-Insure ODS/DWH Connector 1
6. Admin Enablement 1 10 days on-site
7. Qlikview Server 1 Production Server
8. QlikView Test Server 1 Test / UAT Server
9. QlikView Local Clients 5 Development Client
10. QlikView Named CALs [n] # of power users
11. QlikView Document CALs [m] # of User / Document combinations for non-
power users
12. Requirements Assessment Fixed 10 days consulting
Mapping, Design, Develoment, Testing, Integration & Deployment service as needed.
Estimates after Requirements Assessment](https://image.slidesharecdn.com/q-insure-120422053114-phpapp01/85/Q-insure-20-320.jpg)


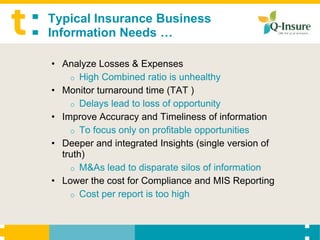
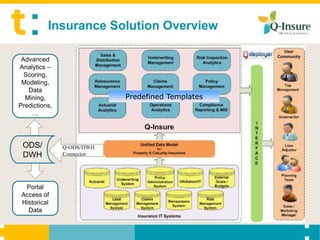
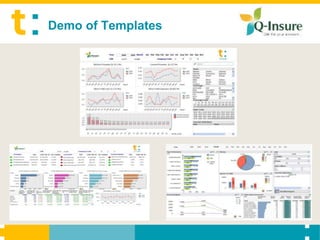
Interactive Insurance Analytics provides a readymade insurance reporting and analytics solution built on the QlikView platform. It features predefined templates and dashboards for key insurance functions that integrate various insurance data sources using a unified insurance data model. The solution is designed to provide concise, accurate insights while keeping the cost per report low and time to deploy short.


![Getting Started with Apache Spark: Big Data Made Simple [Free Meetup]](https://cdn.slidesharecdn.com/ss_thumbnails/apachesparkgettingstarted-260203175547-8361bcc3-thumbnail.jpg?width=640&height=640&fit=bounds)


