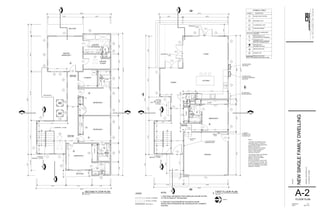
Backgammon MWC estimator by pr difference and match length v03Wayne Joseph
MWC = Match Winning Chances.
I knocked up an Excel sheet to display estimated percentage chances of the person with a better (lower) PR winning a backgammon match (based on match length).
Now I can know how lucky I was to beat the better players! :-)
Google Analytics is one of the most powerful tools for monitoring and analyzing traffic on your website. It gives you enormous data on who is visiting your site, what they are looking for, and how they are getting to your site. There is so much data available that it is easy to get lost in this data. Things get even more complex when it comes to client reporting. Marketers and Ad Agencies often use excel for preparing Google Analytics Reports but this is tedious and time consuming.
When it comes to client reporting, especially Google Analytics data, it is crucial to present this huge data in a meaningful way. Data visualization becomes tremendously important in this regards. Reportgarden solves this problem in 3 simple steps:
1. Select a default reporting template
2. Customize your reports using the simple drag and drop editor. Add all the metrics you want.
3. Schedule the report to be automatically to your clients
This is a sample ReportGarden Google Analytics Report.
The ability to customize and build your own reports allows marketers to gain truly valuable insights from the tool + this is huge timesaver.
Key sections to included in a Google Analytics Report:
1. Overall Website Performance
2. Vistor Sessions
3. Organic Sessions Data
4. Traffic Sources/Mediums
5. Top Refferal Sites
6. Browser Report
7. Device Report
8. Traffic Sources by City
9. Traffic Sources by Country
10. Top Landing Pages
11. Visitor Acquisition Efficiency Analysis Report
12. Mobile Performance Report
13. Content Efficiency Report
14. Page Flow
15. Recommendations
At the beginning of every month you need to justify your SEO strategy, your efforts and yourself. With the challenging landscape of SEO comes the challenging landscape of SEO reporting. It is a tough task to make all the data points and metrics indicate real progress, and more importantly meet your clients' expectations. In the case of SEO reports there is so much data available that it is easy to get lost in this data. SEOs and marketers often use excel for preparing SEO reports but this is tedious and time consuming.
When it comes to client reporting, especially SEO reports, it is crucial to present this complex data in a meaningful way. Data visualization becomes tremendously important in this regards. Reportgarden solves this problem in 3 simple steps:
1. Select a default reporting template
2. Customize your reports using the simple drag and drop editor. Add all the metrics you want.
3. Schedule the report to be sent automatically to all your clients
This is a sample ReportGarden SEO Performance Report.
The ability to customize and build your own reports allows marketers to gain truly valuable insights from the tool + this is huge timesaver.
Key sections to included in a SEO Reports:
1. SEO Performance Overview
2. Wesite Traffic
3. Traffic Sources
4. Device Performance
5. Site Health
6. Laning Page Performance
7. Top Referrals
8. Top Referrals traffic
9. Keyword Performance
10. Recommendations
Carte Blanche would like to dedicate this Sunday's broadcast to the memory of Simiso Nokoyo, a young journalism intern who dreamt of working with us on Carte Blanche. He achieved his dream, but sadly, for all too short a time. His young life ended abruptly this week in a motor accident. Simiso, we will miss you.
Build-a-Genome Advances Knowledge in DNA and GenomesJef Boeke
New York resident Jef Boeke, PhD, serves as a director and professor at NYU Langone Medical Center. With an interest in yeast and human mobile genetic elements, Dr. Jef Boeke supports efforts like the Build-a-Genome course.
Vi er trådt ind i en ny tidsalder for digital markedsføring, hvor marketing, salg og forretningsudvikling smelter sammen for at imødekomme kundernes forventninger og behov. Udviklingen medfører både udfordringer og potentialer: På den ene side bliver virksomheder udfordret af kunder, der aldrig før har haft så let ved at sammenligne og skifte leverandører - på den anden side har der aldrig eksisteret så mange, gode værktøjer til at afdække og udbygge kundens tilfredshed og loyalitet som nu.
Som B2B marketing- eller salgsansvarlig er dit ansvarsområde at skabe indsigt og momentum - og ikke mindst - at prioritere rigtigt.
På denne morgenbriefing giver vi dig indblik i fire strategier, som de bedste B2B-virksomheder følger for at fange og fastholde kundernes opmærksomhed og integrere virksomhedens samarbejde omkring marketing, salg og udviklingen af nye produkter og services:
Vær værdifuld
Vær relevant
Kom tæt på
Integrér
Hør om de mange, ofte uudnyttede digitale muligheder på B2B-markedet, og få inspiration i dit eget arbejde med online marketing.
Civil Service Eligibility Review Class (Overview)Maam Lumanglas
Course Overview Civil Service Eligibility Review Class held on October 9-12, 2007 in DENR Visayas Ave., Diliman, Quezon City,Philippines. This activity is conducted by the DENR Human Resource Development Service (Trainers Development Division)
5 Reasons Why You Don’t Train Your EmployeesEduson.tv
Why do small companies refuse to train employees?
Almost every business owner has a couple really good
reasons for that. We’ve guessed five.
Do you agree with them?
В.Мизгулин -- программа магистратуры по системной инженерииAnatoly Levenchuk
Доклад В.Мизгулина "Программа магистратуры по системной инженерии" на 7й рабочей встрече Русского отделения INCOSE по проблемам системной инженерии, 23 апреля 2016г.
Евгений Смирнов, основатель Newtonew, учитель в школе №184 г. Санкт-Петербурга. В рамках VII ежегодной межрегиональной научно-практической конференции по вопросам естественнонаучного, технологического и технопредпринимательского образования.
1. 28'-5"
13'-3"10'-6"15'-3"
4'-6"
5'-3"
6'-5"3'-6"
31'-3"
20'-0"10'-0"
14'-0"
53'-5"9'-6"
3'-6"
8'-1"
1'-10"12'-0"
62'-11"
19'-0"
5'-8"
2'-6"
15" MIN
5'-6"
15"MIN
2'-7"
24" MIN
1'-10"
GARAGE
BEDROOM 5
33'-8"
19'-8"12'-9"
12'-0"
21'-10"15'-3"
4'-6"
5'-3"
6'-5"3'-6"
28'-9"
12'-0"15'-6"
15'-6"
58'-5"9'-6"
63'-11"
5'-6"
33'-8"
11'-3"12'-9"
7'-6"
8'-0"12'-0"
15" MIN
2'-6"
5'-6"
2'-11"
BALCONY
15"MIN
11'-8"
8'-0"
5'-3"
8'-0"
5'-9"
6'-6"8'-6"
5'-6"
15"MIN
8'-5"
3'-2"
15" MIN
24"MIN
5'-0"
LAUNDRY
MASTER
BEDROOM 1
4'-6"
BALCONY
BEDROOM 2
BEDROOM 3
BEDROOM 4
MASTER
CLOSET
MASTER
BATHROOM
7'-6"
W/D
DN UP
ROOF BELOW
LIVING
DINING
1/4"=1'-0"
FIRST FLOOR PLAN
11/4"=1'-0"
SECOND FLOOR PLAN
2
(E) WALL TO REMAIN
(E) WALL TO DEMO
LEGEND
NEW WALLS
1/A4 1/A41/A4 1/A4
2/A4
4/A3
1/A3
2/A4
3/A3
2/A3
2/A4
2/A4
S
S
S
S
S
SD/CM
SD/CM
SD/CM
F
F
F
F
24" MIN
24" MIN
24"MIN
2'-4"
NOTES:
1. FANS SHALL BE ENERGY STAR COMPLAINT AND BE DUCTED
TO THE OUTSIDE OF THE BUILDING
2. FANS NOT FUNCTIONINGFOR THE WHOLE HOUSE
VENTILATION SYSTEM MUST BE CONTROLLED BY A HUMIDITY
CONTROL
THRESHOLD < 1.5"
(TYP.)
THRESHOLD < 1.5"
(TYP.)
(N) STAIR
MIN. 10" RUN
MAX. 7.75" HEIGHT
(TYPICAL)
KITCHEN
CLOSET
CLOSET
CLOSET
CLOSET
5'-1"
8'-2"
7'-6"
13'-9"
2'-7"
14'-5"
11'-6"
11'-11"2'-11"
F
F
2'-0"
8'-3"
1'-10"
4'-8"3'-0"8'-1"
5'-6" 14'-2"
2'-1"
7'-31/4"
13'-9"
5'-0"
8'-6"
6'-0"
A/C
A/C
1'-1"9'-1"
7'-3"
2'-6"
(N) TANKLESS
WATER HEATERS
1" CONDUIT
TERMINAL FOR
FUTURE EVSE
NOTES:
“THE PANEL OR SUBPANEL SHALL
PROVIDE CAPACITY TO INSTALL
A 40-AMPERE MINIMUM DEDICATED
BRANCH CIRCUIT AND
SPACE(S) RESERVED TO PERMIT
INSTALLATION OF A BRANCH
CIRCUIT OVERCURRENT
PROTECTIVE DEVICE.”
“THE SERVICE PANEL OR SUBPANEL
CIRCUIT DIRECTORY SHALL
IDENTIFY THE OVERCURRENT
PROTECTIVE DEVICE
SPACE(S) RESERVED FOR FUTURE
EV CHARGING AS EV CAPABLE. THE
RACEWAY TERMINATION LOCATION
SHALL BE PERMANENT AND VISIBLY
MARKED EV CAPABLE.”
FUTURE SOLAR
INVERTER EQUIPMENT
LOCATION
(N) MAIN PANEL
(200 A) MIN.
8'-5"
GUARDRAIL - 42" MIN.
STARIWAY
HANDRAIL - 42" MIN.
STARIWAY
HANDRAIL - 42" MIN.
(N) STAIR
(TYP)
1- HR FIRE RATED
CONSTRUCTION
CEILING LIGHT FIXTURE
FLUORESCENT LIGHT
LIGHTING PENDANT
RECESSED LIGHT
SYMBOL DESCRIPTION
EXTERIOR FLUORESCENT
LIGHTING
SYMBOLS TABLE
UNLESS NOTED OTHERWISE
PLUG @ 12" A.F.F.
SWITCH @ 44" A.F.F.
UNLESS NOTED OTHERWISE
ARC FAULT INTERRUPTOR
INTERRUPTOR (GFI)
GROUND FAULT
(GFI)
CARBON MONOXIDE ALARM
F EXHAUST FAN
SMOKE DETECTOR /
SD/CM
SMOKE DETECTOR
S
NORTH
205/240
EVSE
3/A43/A4
3/A43/A4
A-2FLOOR PLAN
DRAWN BY: ALF
DATE: SEP.27.16
PROJECT:
NEWSINGLEFAMILYDWELLING
ADDRESS:3563PURDUEAVE.
LOSANGELES,CA90066