Download to read offline

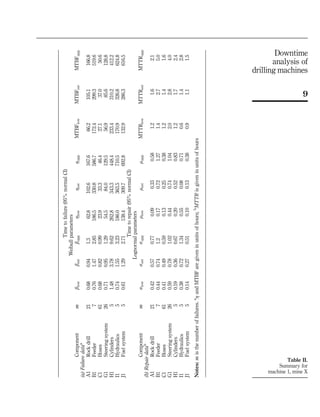
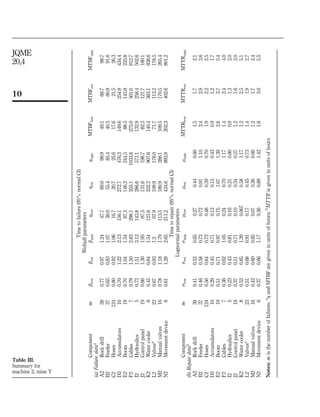
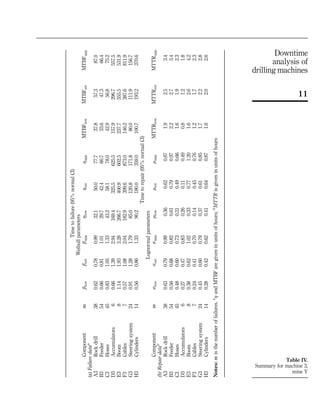
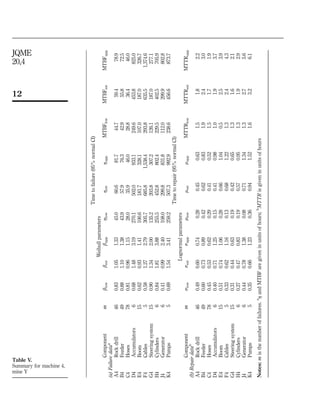
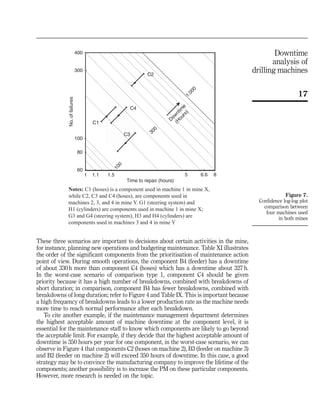
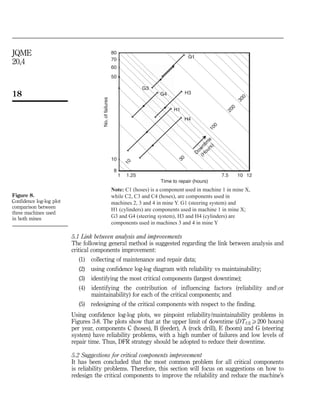
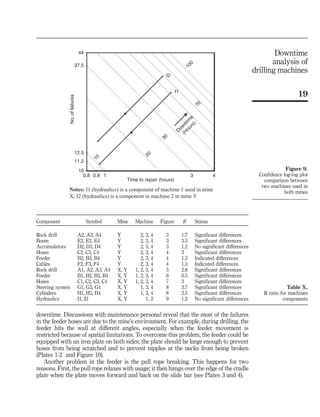
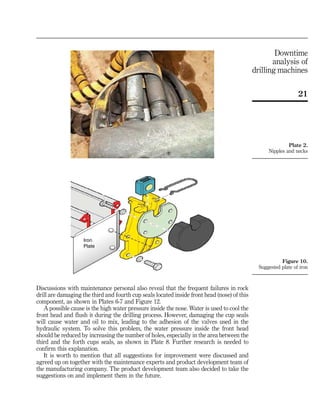
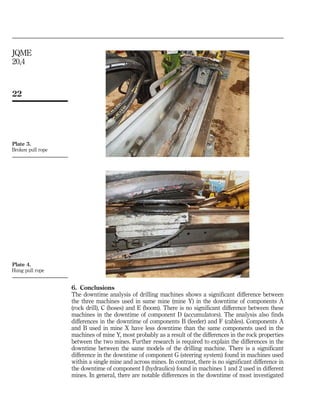
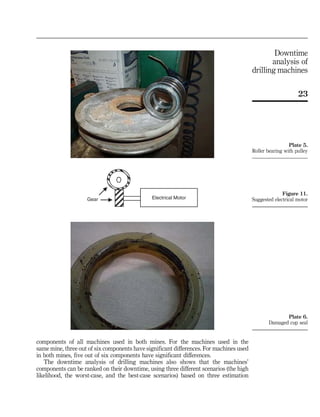
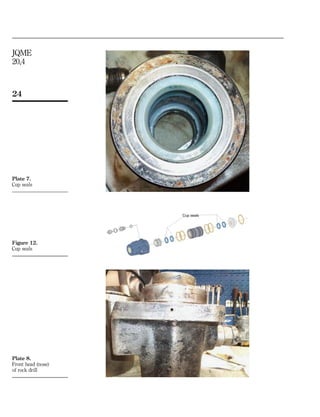

This document analyzes downtime data from four drilling machines used in two underground mines in Sweden over a two-year period. It finds that hoses and feeders have relatively high downtime. The downtime of components is ranked into three groups. The downtime is due to reliability problems of critical components. The study suggests improving reliability of components to reduce drilling machine downtime. It analyzes downtime using log-log diagrams with confidence intervals to identify components contributing most to downtime and determine strategies like design for reliability/maintainability to reduce it.


![[IJET V2I5P14] Authors: Miss Kirti. S. Kakade, Prof. P. A. Narwade](https://cdn.slidesharecdn.com/ss_thumbnails/ijet-v2i5p14-161107142948-thumbnail.jpg?width=640&height=640&fit=bounds)


