Novel RP-HPLC Method for Simultanious Determination of Sitagliptin and Simvas...
Publications-Indian_drugs__2016[1]-Mohan
1. 40 INDIAN DRUGS 53 (06) june 2016
Keywords:Vitamin-D3
,RP-HPLC,Isocratic,UVDetector,
Validation.
INTRODUCTION
Vitamin-D is a micronutrient that is needed for
maintaining an optimal healthy life. It plays a vital role in
maintainingcalciumabsorptionandbonemineralization1
.
In addition, Vitamin-D plays a role in muscle contraction,
nerve conduction, maintains a healthy immune system
and also helps to maintain normal cell growth and
differentiation2,3
. Vitamin-D2
and Vitamin-D3
are two
different forms that differ in the side chain at the 17β
position on the secosteroid molecule. Vitamin-D3
is a fine
colourlesscrystalsanditiswaterinsolublehasamolecular
formula C27
H44
O with molecular weight 384.63766 g/mol.
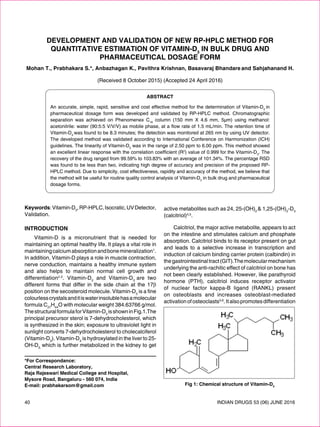
ThestructuralformulaforVitamin-D3
isshowninFig.1.The
principal precursor sterol is 7-dehydrocholesterol, which
is synthesized in the skin; exposure to ultraviolet light in
sunlight converts 7-dehydrocholesterol to cholecalciferol
(Vitamin-D3
). Vitamin-D3
is hydroxylated in the liver to 25-
OH-D3,
which is further metabolized in the kidney to get
active metabolites such as 24, 25-(OH)2
& 1,25-(OH)2
-D3
(calcitriol)4,5
.
Calcitriol, the major active metabolite, appears to act
on the intestine and stimulates calcium and phosphate
absorption. Calcitriol binds to its receptor present on gut
and leads to a selective increase in transcription and
induction of calcium binding carrier protein (calbindin) in
thegastrointestinaltract(GIT).Themolecularmechanism
underlying the anti-rachitic effect of calcitriol on bone has
not been clearly established. However, like parathyroid
hormone (PTH), calcitriol induces receptor activator
of nuclear factor kappa-B ligand (RANKL) present
on osteoblasts and increases osteoblast-mediated
activationofosteoclasts5,6
.Italsopromotesdifferentiation
Fig 1: Chemical structure of Vitamin-D3
DEVELOPMENT AND VALIDATION OF NEW RP-HPLC METHOD FOR
QUANTITATIVE ESTIMATION OF VITAMIN-D3
IN BULK DRUG AND
PHARMACEUTICAL DOSAGE FORM
Mohan T., Prabhakara S.*, Anbazhagan K., Pavithra Krishnan, Basavaraj Bhandare and Sahjahanand H.
(Received 8 october 2015) (Accepted 24 April 2016)
ABSTRACT
An accurate, simple, rapid, sensitive and cost effective method for the determination of Vitamin-D3
in
pharmaceutical dosage form was developed and validated by RP-HPLC method. Chromatographic
separation was achieved on phenomenex C18
column (150 mm X 4.6 mm, 5μm) using methanol:
acetonitrile: water (90:5:5 V/V/V) as mobile phase, at a flow rate of 1.5 mL/min. The retention time of
Vitamin-D3
was found to be 8.3 minutes; the detection was monitored at 265 nm by using UV detector.
The developed method was validated according to International Conference on Harmonization (ICH)
guidelines. The linearity of Vitamin-D3
was in the range of 2.50 ppm to 6.00 ppm. This method showed
an excellent linear response with the correlation coefficient (R2
) value of 0.999 for the Vitamin-D3
. The
recovery of the drug ranged from 99.59% to 103.83% with an average of 101.34%. The percentage RSD
was found to be less than two, indicating high degree of accuracy and precision of the proposed RP-
HPLC method. Due to simplicity, cost effectiveness, rapidity and accuracy of the method, we believe that
the method will be useful for routine quality control analysis of Vitamin-D3
in bulk drug and pharmaceutical
dosage forms.
*For Correspondance:
Central Research Laboratory,
Raja Rajeswari Medical College and Hospital,
Mysore Road, Bangaluru - 560 074, India
E-mail: prabhakarsom@gmail.com
2. INDIAN DRUGS 53 (06) june 2016 41
of osteoclast precursor. Calcitriol enhances proximal
tubular reabsorption of both Ca2+
ions and Po4
3-
in the
kidney.The net effects of Vitamin-D3
are to raise both
Ca2+
and Po4
3-
levels6
. Deficiency of Vitamin-D3
is now
recognized as a global problem for both children and
adults. Inadequate intake with insufficient sunlight
exposure leads to liver or kidney disorders or rarely by
a number of hereditary disorders. Vitamin-D3
deficiency
also results in bone mineral disorders, such as rickets
and osteoporosis7,8
. Hence, there is a need for increase
Vitamin-D3
supplementtoovercomeVitamin-D3
deficiency
disorders9
. Development of efficient formulation for
Vitamin-D3
supplement requires methods to evaluate and
validate the quality and quantity of Vitamin-D3
dosage.
In the present work, a RP-HPLC method for
estimation of Vitamin-D3
was developed and validated
as per ICH guidelines10
. Estimation of Vitamin-D3,
in the
pharmaceutical products has been determined by many
chromatographic methods2-4,11
. Most of these methods
includecomplexstageslikepre-treatment,extractionand
sample purification steps for quantification of Vitamin-
D3
. However, our procedure does not include any such
complex stages as compared to reported studies. This
method also showed excellent recovery as compared to
other studies. Our proposed method has less retention
time,goodsymmetricalpeakshapeandtheoreticalplates
as compared to reported studies. Further, to the best of
ourknowledge,themobilephaseusedinthepresentstudy
has less organic solvent (5% acetonitrile) as compared to
other studies. This may decrease cost of analysis, which
may be economical to quality control labs. Hence, this
new RP-HPLC method is simple, rapid, reliable, robust
and cost effective as compared to other studies.
MATERIALS AND METHODS
Reagents and Chemicals
Vitamin-D3
standard was purchased from Sigma-
Aldrich, USA. Sample cholecalciferol chewable tablets
(Micro-D3 Tablets; 60000 IU) were obtained from Raja
Rajeswari Medical College and Hospital (RRMCH)
Pharmacy. HPLC-grade acetonitrile and methanol were
obtained from S. D. Fine Chem. Ltd, India.
Instrumentation
Chromatographic separation was performed using
HPLC-2010CHT (Shimadzu, Japan) equipped with UV
detector, photodiode array detector (PDA), quaternary
gradient pump and auto injector with 100μl fixed loop.
The analyte was monitored at 265nm. A reversed phase
phenomenex C18
column having 150 cm X 4.6 mm, 5μm
particle size was used. All the drugs and the chemicals
were weighed on the electronic balance (BSA224S-CW,
Sartorius, Germany). HPLC grade 18.2 MΩ water (ELGA,
UK) was used throughout the analysis.
Chromatographic conditions
The elution of Vitamin-D3
was achieved by running
HPLC in isocratic mode by using the phenomenex C18
columnandequilibratedwiththemobilephase;Methanol:
acetonitrile: water (90:5:5 V/V/V). The mobile phase and
diluent (methanol) was filtered through 0.45µL filter. The
injection volume was kept at 100μl and the active drug
was monitored with UV detector at 265nm. The flow rate
was maintained at 1.5mL/min and the total run time was
kept 12 minutes.
Preparation of standard solution
10mgofVitamin-D3
workingstandardwastransferred
to 10 mL volumetric flask (VF) and dissolved in the
diluent to get a solution containing 1mg/mL (standard
stock solution). HPLC grade 100% Methanol was used
as a diluent. Intermediate stock solution was prepared by
diluting 1 mL of standard stock solution to 100 mL VF with
diluent. The standard solution was prepared by adding
5 mL of diluted intermediate stock solution to 10 mL VF
with diluent to obtain the working standard of 5 ppm.
Preparation of sample solution
20tablets(Labelclaim:60000IU/tablet)wereweighed
and average weight was calculated and found to be 600
mg, then crushed and powdered finely. 1.0 gm of sample
(equivalent to 100000 IU) was transferred in to 200mL
VF and 3 mL of deionized water was added to disperse
properly in the flask. Later 100 mL of diluent was added
and sonicated for 30 minutes. Finally the volume was
made up to the mark with diluent and the sample was
filtered through 0.2µm Sartorius syringe filter. Further
10 mL of above solution was diluted to 25 mL VF with
the diluent to obtain the sample concentration of 5 ppm.
Solutions were kept in amber-colored VF and stored at
4-8°C until use.
RESULTS AND DISCUSSION
Method Development
In order to develop a suitable RP-HPLC method,
different organic solvent concentration and column
chemistry were applied to achieve the isocratic elution
of Vitamin-D3
. The mobile phase; methanol: acetonitrile:
water (90:5:5 V/V/V) with the flow rate of 1.5mL/min and
detectorwavelengthat265nmwasfoundtobesatisfactory.
3. 42 INDIAN DRUGS 53 (06) june 2016
This optimized method gives best system suitability
parametersandrecovery.Thetypicalstandardandsample
chromatograms were shown in Fig. 2 and Fig. 3.
systemandsystemsuitabilityparameterswereevaluated.
The results (Mean ±% RSD) of the chromatographic
parameters are shown in Table I, indicating the good
performance of the system.
Linearity and Range
The linearity of the method was determined at seven
concentration levels ranging from 2.50 ppm to 6.00 ppm
for Vitamin-D3
. The regression equation for Vitamin-D3
was y = 20800x – 2070 and the correlation coefficient (R2
= 0.999) was highly significant. The calibration curve was
shown in Fig. 4. The result shows an excellent correlation
exists between the response factor on y-axis and the
concentration of drug on x-axis.
Accuracy
To check accuracy of the method, recovery studies
were carried out by addition of standard drug solution to
pre-analyzed sample at three different levels of 80, 100,
120%.MeanpercentagerecoveryofVitamin-D3
drugwas
calculated and is shown in the Table II.The percentage
recoveryvariedfrom99.59%to103.83%withanaverage
of 101.34 % for Vitamin-D3
, indicates good accuracy of
the method.
Precision
Precision of the method was determined by the
repeatability (intra-day precision) and intermediate
precision (inter-day precision) of both standard and
sample solutions. Precision was determined in six
replicates of standard and sample solution (5 ppm) on
the same day and the next day. The values of % RSD
for intra-day and inter-day variations are given in Table
III (A-D). In both cases, % RSD values were found well
within 2% limit, indicating that the current method is
precise.
Sensitivity
The LOD (k =3.3) and LOQ (k =10) of the proposed
method was calculated using the following equation: A =
Kσ/S, where A = LOD or LOQ, σ is the standard deviation
of the response, and S is the slope of the calibration
curve. The LOD and LOQ of Vitamin-D3
were found to be
0.5 ppm and 1.0 ppm, respectively. Hence the proposed
method was found to be sensitive.
Specificity
To check the noninterference of placebo, placebo
solution was prepared in the same way of sample solution
in the presence of all inactive ingredients of the Micro-D3
Fig 2: Chromatogram of Vitamin-D3
standard.
Fig 3: Chromatogram of Vitamin-D3
sample.
Fig 4: Linearity curve for Vitamin-D3
Method Validation
The developed analytical method was further
subjected to validation according to International
ConferenceonHarmonizationICHQ2(B)guidelines10
.All
theparameterswereevaluatedsuchaslinearity,accuracy,
precision, limit of detection (LOD), limit of quantification
(LOQ), specificity and robustness.
System Suitability
The working standard solution was prepared as
per procedure and was injected five times into HPLC
4. INDIAN DRUGS 53 (06) june 2016 43
peak purity was estimated by using a PDA detector, and
the purity index was found to be greater than 0.9999 as
shown in Fig.5. Separation of pre-cholecalciferol and
trans-cholecalciferol was observed with a resolution of
2.25 as shown in Fig.6.
Robustness
To determine the robustness of the current method,
the effect of flow rate was studied at 1.35 mL/min and
1.65 mL/min instead of 1.50 mL/min. The effect of column
temperature was studied at 23°C and 27°C instead of
25°C.The%RSDoftherobustnesstestingunderdifferent
altered conditions is given in Table IV, indicating that the
current method is robust.
Fig 5: Peak purity of cholecalciferol derived from PDA detector
Fig 6: Typical chromatogram showing separation of
pre-cholecalciferol and trans-cholecalciferol
Table I: System Suitability Parameters
Sl. No Parameter Value [mean ± % RSD]*
1 Retention Time 8.341 ± 0.057
2 Peak Area 926256 ± 0.088
3 Theoretical plates 3792 ± 0.432
4 Tailing Factor 1.10 ± 0.076
* Mean ± % Relative Standard Deviation of six replicates.
Table II: Recovery Studies
Concentration of Added Amount Recovered Amount Recovered Amount
Vitamin-D3 (%) (mg) (mg) % [mean ± % RSD]*
(n=3)
80 0.410 0.424 103.32 ± 0.669
100 0.510 0.512 100.37 ± 0.278
120 0.610 0.612 100.35 ± 0.655
* Mean ± Standard Deviation of three replicates.
tablet formulation but without Vitamin-D3
. The specificity
of the method was noticed by the complete separation
of Vitamin-D3
peak in the presence of excipients. The
5. 44 INDIAN DRUGS 53 (06) june 2016
Table III: Method Precision
A: Repeatability
Sl. No Sample Area Amount Recovered (in mg) % Recovery
1 1622221 1.503 100.21
2 1619540 1.502 100.13
3 1619493 1.503 100.18
4 1617902 1.501 100.04
5 1615915 1.508 100.51
6 1621044 1.500 100.02
Mean 1619353 1.503 100.18
Std Dev 2239.0 0.00279 0.17747
% RSD 0.14 0.19 0.18
B: Intermediate precision (Analyst 1-Day 1)
Sl. No Sample Area Amount Recovered (in mg) % Recovery
1 1589623 1.511 100.74
2 1599990 1.503 100.17
3 1588679 1.511 100.70
4 1590671 1.511 100.72
5 1588006 1.513 100.86
6 1572829 1.501 100.04
Mean 1588300 1.508 100.54
Std Dev 8759.1 0.00501 0.34272
% RSD 0.55 0.33 0.34
C: Intermediate precision (Analyst 2-Day 2)
Sl. No Sample Area Amount Recovered (in mg) % Recovery
1 1563516 1.510 100.69
2 1593114 1.507 100.46
3 1556054 1.504 100.29
4 1558580 1.501 100.05
5 1553972 1.503 100.18
6 1531469 1.508 100.55
Mean 1559451 1.506 100.37
Std Dev 19874.8 0.00339 0.23992
% RSD 1.27 0.23 0.24
D: Comparison between Intermediate Precision of Analyst 1 and Analyst 2
Sample Amount of Sample Analyst-1 Analyst-2
Vit-D3 taken (mg) Amount found (mg) % Recovery (± SD)* Amount found (mg) % Recovery (± SD)*
Micro-D3 1.500 1.508 100.54 ± 0.342 1.506 100.37 ± 0.239
Tablet
6. INDIAN DRUGS 53 (06) june 2016 45
CONCLUSION
The proposed study describes the new RP-HPLC
methodfortheidentificationandquantificationofVitamin-
D3
. The method was validated and found to be simple,
sensitive, rapid, accurate and precise. Hence, for the
simplicity, less time consumption and economical with
high percentage of recovery, the proposed method can
be successfully applied for routine analysis of Vitamin-D3
in bulk drug and tablet dosage form.
REFRENCES
1. Fraser WD, Milan AM. Vitamin D Assays: Past and Present
Debates, Difficulties, and Developments. Calcif Tissue Int
2013; 92(2): 118-127.
2. Qadi EA, Battah A, Hadidi K. Development of High
Performance Liquid Chromatographic Method for Vitamin
D3
analysis in Pharmaceutical Preparation. Jordan J.
Pharm. Sci., 2010; 3(2): 78-85.
3. Cirunay JJN, HeydenYV, Vercammen JP. Separation from
Related Compounds and Assay of Calcipotriol by High
Performance Liquid Chromatography. J. Chromatogr.
Sci., 1998; 36: 417-421.
4. Gracia LG, Carmona MMJ, Castro MDLD. Determination
of Vitamins D2
and D3
in Pharmaceuticals by Supercritical-
Fluid Extraction and HPLC Separation with UV Detection.
Chromatogra. 2000; 51(7/8): 428-432.
5. Holick MF. Vitamin D Deficiency. N. Engl. J. Med., 2007;
357: 266-281.
6. Adams JS, Hewison M. Update in Vitamin D. J. Clin.
Endocrinol. Metab. 2010; 95(2): 471–478.
7. Bischoff-Ferrari HA, Dietrich T, Orav EJ, Dawson-Hughes
B. Positive association between 25-hydroxy vitamin D
levels and bone mineral density: a population-based study
of younger and older adults. Amer. J. Med., 2004; 116(9):
634-639.
8. Lips P. Vitamin D deficiency and secondary
hyperparathyroidismintheelderly:Consequencesforbone
lossandfracturesandtherapeuticimplications.Endocrine
Rev. 2001; 22(4): 477-501.
9. Holick MF. Vitamin D: Importance in the prevention of
cancers, type I diabetes, heart disease, and osteoporosis.
Amer. J. Clin. Nutr., 2004; 79: 362-371.
10. ICH, Q2 (R1) Validation of Analytical Procedures:
Methodology, International Conference on Harmonization.
November (2005).
11. Sathya Priya LS. Development and Validation of RP-
HPLC Method for the Estimation of Vitamin D3 in Liquid
Formulations. Research Gate: Pharm. Sci., 2012;
1: 5-7.
Table IV: Robustness of the method
Parameter Variations Amount of Amount of % RSD
Vitamin-D3 Added (mg) Vitamin-D3 Detected (mg)
Change in flow rate 1.35 ml/Min 1.500 1.574 0.38
1.50 ml/Min 1.500 1.528 0.15
1.65 ml/Min 1.500 1.552 0.96
Change in column temperature 23.0°C 1.500 1.524 0.69
25.0°C 1.500 1.528 0.15
27.0°C 1.500 1.534 0.77
For Advertising in the Classified Columns and also for Series Advertisement discount
Please contact: Mr Chettiar (+9820629907) Publications Department
INDIAN DRUGS
Tel.: 022 - 2494 4624 / 2497 4308 / Fax: 022 - 2495 0723 E-mail: mail_idma@idmaindia.com,
Website: www.idma-assn.org /www.indiandrugsonline.org