The poverty reduction strategy paper for the North Western Frontier Province (NWFP) of Pakistan outlines the province's severe poverty issues, with a poverty headcount of 43% compared to the national average of 33%. The strategy emphasizes governance reforms, improving public service delivery, financial management, private sector development, and addressing gender disparities to achieve the overarching goal of poverty reduction. This consultative process is designed to ensure ownership and sustainability of the strategy, which aims to leverage the untapped economic potential of the region while addressing the vulnerabilities faced by its population.

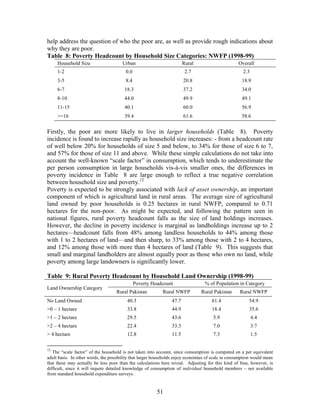
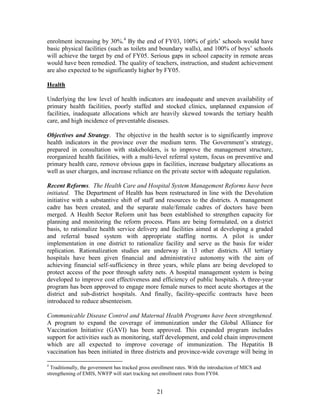
![5
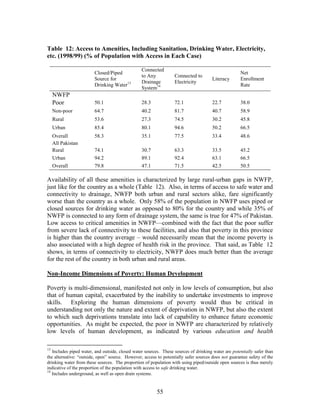
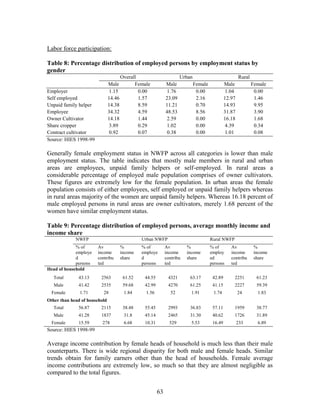
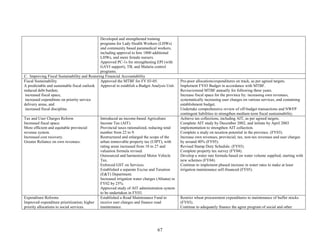
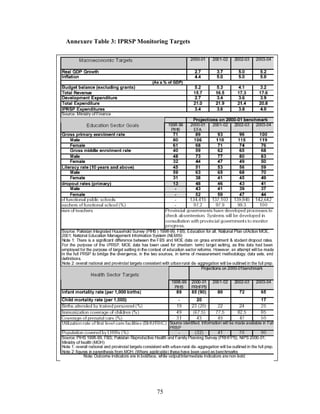
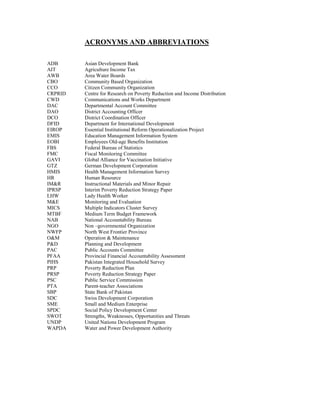
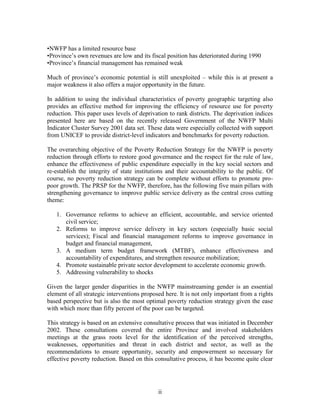
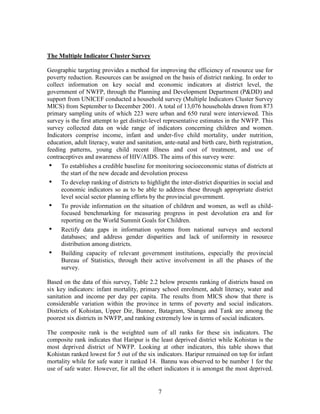
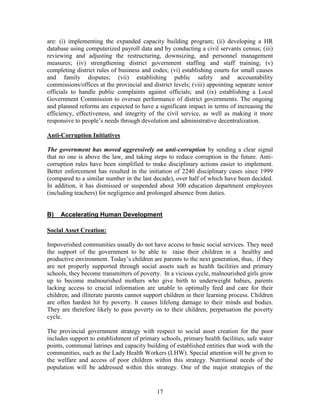
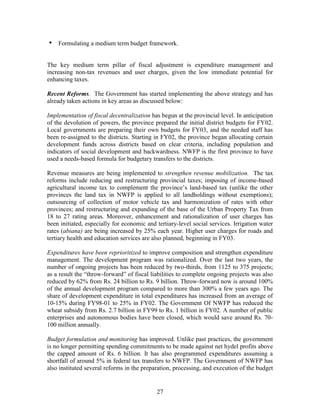
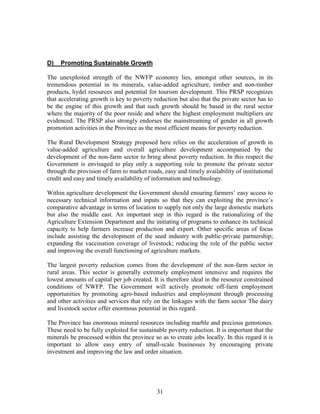
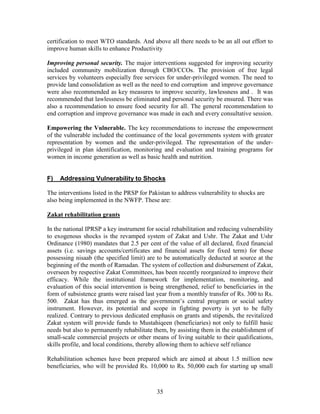
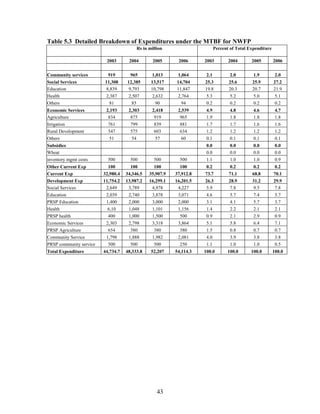
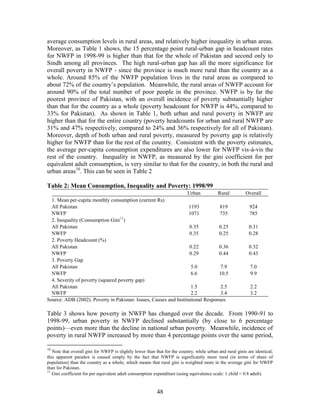
Poverty Trends in NWFP
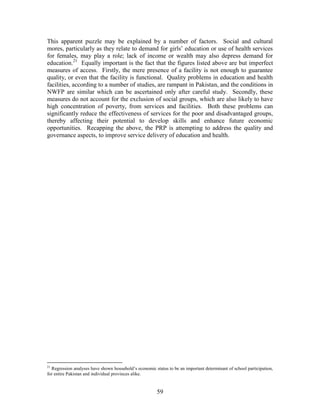
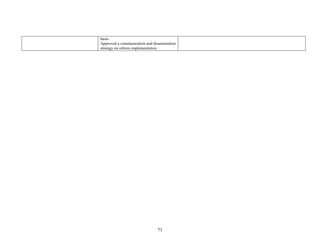
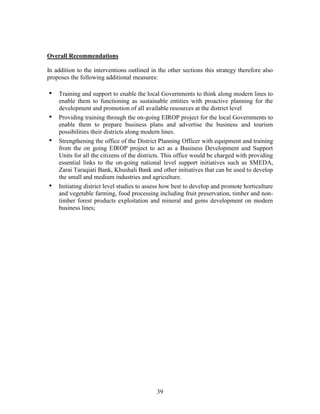
Poverty in NWFP has changed over the decade. The trends are very mixed. In comparing
1990-91 to 1998-99, urban poverty in NWFP appears to have declined substantially (by
close to 6 percentage points)—even more than the decline in national urban poverty.
Meanwhile, the incidence of poverty in rural NWFP seems to have increased by more
than 4 percentage points over the same period; although the rural poverty headcount for
the country actually fell slightly over the same period. Poverty reduction in NWFP when
comparing the estimates for 1990-1 with those for 1998-99 appears to have occurred only
in urban areas while rural areas have become poorer on the average. However, it is also
important to note that notwithstanding the decline in urban poverty in NWFP during this
period the urban areas in this province still remain the poorest in the country by a large
margin. And even more alarming is the fact that if there is a comparison between 1993
and 1999 then the available evidence indicates a dramatic and consistent worsening of
poverty in NWFP in both the rural and urban sectors. [Figure 2.1].
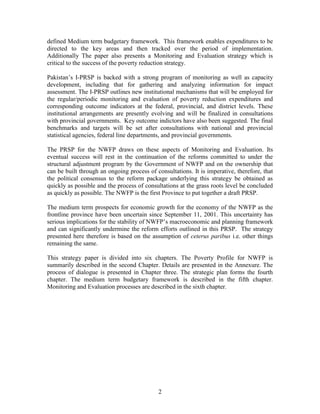
Figure 2.1: The Continuously Deteriorating NWFP Poverty Situation 1993 to 1999
Characteristics of Poverty
Several Characteristics of poverty in NWFP based on the available research are listed
below:
• NWFP faces difficult challenges due to its geography, history and location
• NWFP is the poorest Province of Pakistan
• NWFP has poor social indicators and highest gender disparity
• Gender gaps are significant for all socio-economic indicators in NWFP
• Gender gaps tend to be wider in rural areas than in urban areas of NWFP.
• Gender gaps in NWFP are found to be larger than for the country as a whole
26.6
29.3
26.3
32.2
35.5
38.1
41.2
42.6
0.0
5.0
10.0
15.0
20.0
25.0
30.0
35.0
40.0
45.0
FY93 FY94 FY97 FY99
Pakistan NWFP](https://image.slidesharecdn.com/2-prspnwfp-141022012400-conversion-gate01/85/POVERTY-REDUCTION-STRATEGY-PAPER-ON-NORTH-WESTERN-FRONTIER-PROVINCE-OF-PAKISTAN-13-320.jpg)
![11
CHAPTER 3. PRSP DIALOGUE
In preparing the Poverty Reduction Plan during 2000-2001 the government of NWFP held extensive consultations with NGOs, donors and other stakeholders. However, the NWFP Government did not discuss and/or disseminate the PRP program to the new District Nazims, Councilors, and district officials. It was waiting for them to settle into their new roles.
This process of consultation at the local level was finally initiated in December 2002 when SWOT (Strengths Weaknesses, Opportunities and Threats] analysis was initiated at two levels. Templates and instructions were issued to all DCOs to involve the devolved elected local Government and elected officials and other stake-holders in the consultative process. Discussions were also initiated with all the heads of sections within the Planning and Development Department of the Government of the NWFP and the Chief Planning Officers of the key departments in order for them to initiate discussions at the sectoral levels with all key stake-holders. The intention was to initiate dialogue with the new district governments and all levels of civil society to ensure that the detailed sectoral strategies and investment programs contained in the PRSP fully reflect the district government priorities. This was extremely essential to engender ownership of the reform objectives.
As part of this initiation program presentations on the determinants and dynamics of poverty in NWFP and the key elements of the Poverty Reduction Plan were presented to the Section Chiefs of the P&D Department and the Chief Planning officers of the line ministries and to all the DCOs and elected Nazims and other officials of the local Governments who were invited to Peshawar for discussion in mid January 2003.
The response was significant. All the participants welcomed the process and stressed the need to define their own strategies of poverty reduction based on their own perceptions of poverty. Based on this response there is even more reason for the consultative process to be made an ongoing process for monitoring and evaluation and be given the highest priority to ensure effective ownership and sustainability of the poverty reduction strategy.
Detailed guidance notes as well as an instrument based on the SWOT (strengths, weaknesses, opportunities, threats) framework was also circulated to every DCO in the province requesting that consultative workshops for stakeholders be organized in each district. The objective was to bring stakeholders from all segments of civil society into the PRSP formulation discussions in order to determine the strengths, weaknesses, opportunities and threats facing the districts as well as to suggest key interventions to increase opportunity, security and empowerment of the people. These latter three aspects are based on international experience, considered to be essential for any effective poverty reduction strategy.
The DCO led consultations with the elected officials and the representatives of civil society were held in every district. And following the meeting held in Peshawar to which](https://image.slidesharecdn.com/2-prspnwfp-141022012400-conversion-gate01/85/POVERTY-REDUCTION-STRATEGY-PAPER-ON-NORTH-WESTERN-FRONTIER-PROVINCE-OF-PAKISTAN-19-320.jpg)
![14
CHAPTER 4. THE POVERTY REDUCTION SRATEGY (PRS)
Background
The Government started to address the multiple social and economic problems during 2000, with varying degrees of success. Recognizing that many of the problems were interdependent and needed a more systematic approach, the Government of the NWFP decided to develop a comprehensive reform program for the province. For this purpose, it prepared a strategy document, the Provincial Reform Program (PRP) 2001-2004, which was discussed extensively with various agencies, including the World Bank. The proposed program was approved by the NWFP Cabinet in June 2001. Several of the PRP reform measures were incorporated in the FY02 Budget and reflected in the Budget White Paper and other documents. NWFP was the first province to embark on such a comprehensive reform program. That on going PRP forms the core of the Provincial PRSP. Moreover the Government of NWFP has committed to a structural adjustment program to bolster this medium term plan. Elements of the Structural Adjustment Program are presented in Annex II. This lists the actions taken so far as well as those planned over the medium term 2003-2005 for each one of the key poverty reducing interventions.
With the coming into power of an elected Government in 2002 it was imperative that that the commitments made for the medium term i.e. 2003-2005 be ratified as quickly as possible. No strategy can be effective without political commitment. On April 5, 2003 the PRSP for the NWFP was presented before the Senior Minister and the Health Minister as well as the Secretaries of the key line Ministries. What is presented below has the approval of the Senior Minister and is based on the assumption that the political consensus exists to carry forward the commitments made in the past two years. In all strategic planning of an economic nature the crucial assumption is cetirus paribus i.e. all other things being equal.
The overarching objective of the Poverty Reduction Strategy Paper for the NWFP is to restore good governance and the respect for the rule of law, enhance the effectiveness of public expenditures, re-establish the integrity of state institutions and their accountability to the public. These objectives are in line with the goals of the I-PRSP for Pakistan [see Annex III]. The PRSP for the NWFP has the following five main pillars with strengthening governance to improve public service delivery as the cross cutting theme:
1. Governance reforms to achieve an efficient, accountable, and service oriented civil service;
2. Reforms to improve service delivery in key sectors (especially basic health, education and social services);
3. Fiscal and financial management reforms to improve governance in budget and financial management, adopt a medium term budget framework (MTBF), enhance](https://image.slidesharecdn.com/2-prspnwfp-141022012400-conversion-gate01/85/POVERTY-REDUCTION-STRATEGY-PAPER-ON-NORTH-WESTERN-FRONTIER-PROVINCE-OF-PAKISTAN-22-320.jpg)
![24
Raise awareness on equal rights of girls and women for survival, development, protection and participation from policy to household level, with a focus on boys and men;
Develop capacity of women for improved participation, financial and land management as well as entrepreneurial skills;
Ensure equal access to services for girls and women including in the areas of health, education, skills training and credit;
Ensuring that routine monitoring systems used for data generation, surveys and evaluations will provide gender disaggregated quantitative and qualitative information;
Ensure that the planning process does utilize gender disaggregated data to ameliorate the situation of the female population;
Develop capacity of service providers for ending gender-biases in planning and access to services and gender-based violence and exploitation;
Remove barriers of age, domicile, female discrimination as an affirmative action to help reduce the gender gap in employment;
Document, monitor and address gender-based biases and violence against women.
Specifically, in each of the sectoral reform areas, especially in the crucial education sector, concerted efforts are being made to reduce gender disparity. Also access to maternal and family planning services is being increased. The Department of Women Development has under implementation several schemes, partly with support from the private sector and local communities, to promote skill development among women and provide temporary shelter, a crisis center, and free legal assistance for women in distress. The Government plans to expand these activities through public-private partnership, community help, and NGOs’ assistance.
A Provincial Steering Committee, including civil society members, would oversee these activities, and provide a vehicle to raise people’s awareness of the needs and rights of women.
Children constitute majority of Pakistan’s population. The proportion of the population aged less than 15 years is higher in NWFP than the national average. Government of Pakistan is committed to welfare and development of this large cohort. Child rights are recognized through the Convention on the Rights of the Child (CRC) to which Pakistan is a signatory. Recently, in the UN Special Session on Children, 2002, Pakistan alongwith the rest of the world, agreed to make policies and take actions for meeting goals and objectives set at the Special Session. These commitments are contained in the outcome document entitled “A World fit for Children”. As a follow up, Pakistan is preparing a National Plan of Action [NPA] for Children. Similar planning initiatives are going on in provinces and Provincial Plans of Action [PPA] for Children are under preparation. This document is set to lead action for child rights and child welfare in the next 10 to 15 years. It is recommended that the strategies under the Provincial Plan of Action (PPA) under preparation be given priority in the overall poverty reduction strategy of the NWFP.](https://image.slidesharecdn.com/2-prspnwfp-141022012400-conversion-gate01/85/POVERTY-REDUCTION-STRATEGY-PAPER-ON-NORTH-WESTERN-FRONTIER-PROVINCE-OF-PAKISTAN-32-320.jpg)
![26
and information on low cost technological options need to be provided at district and sub- district levels.
Strategies for rural water and sanitation: The following strategies will be followed for rural areas:
Policy shift focussing on low cost technology and sustainable models;
Capacity building of district and sub-district functionaries vis-à-vis their new roles and responsibilities;
Replication of successful low cost interventions with community involvement.
The devolution has provided an opportunity to address key institutional constraints, which have historically hindered the delivery of urban services, especially to the poor [see Annex IV]. Using this opportunity, Government of NWFP has: consolidated various service delivery agencies (Communications & Works and Public Health Engineering Department) with fragmented and overlapping service provision mandates; transferred functions and organizations to the local governments (including the Urban Development Authorities); and instituted special arrangements for the main urban center, the Peshawar City District. A regulatory body will be established for the urban water sector at the provincial level. The Government of NWFP has nurtured an enabling environment for participatory development and has spearheaded Community Driven Development initiatives throughout the province. The World Bank’s Community Infrastructure Project in NWFP has been a success story to the extent that a follow-on operation is being planned. The Province is also the first in the country to start the development of an integrated and participatory strategic plan at a city district level, which is likely to provide a model for a comprehensive development framework for the newly formed district governments. The Government intends to examine the need for any further streamlining of agencies in this sector, adopting a uniform policy for community participation and responsibility, and upgrading the management and technical capability of the local government urban services institutions.
C) Improving Fiscal Sustainability and Restoring Financial Accountability.
Fiscal and Expenditure Reforms
Objectives and Strategy. To expand fiscal resources for meeting its growing development and service needs, the GOVERNMENT OF NWFP has adopted a comprehensive medium-term fiscal strategy. This includes:
• Increasing provincial revenues through further tax reform and accelerating user charge increases and saving interest payments through better debt management;
• Divesting inessential activities;
• Implementing fiscal devolution;
• Improving budgetary process, financial management, procurement process and transparency;
• Strengthening the audit oversight arrangements; and](https://image.slidesharecdn.com/2-prspnwfp-141022012400-conversion-gate01/85/POVERTY-REDUCTION-STRATEGY-PAPER-ON-NORTH-WESTERN-FRONTIER-PROVINCE-OF-PAKISTAN-34-320.jpg)
![44
CHAPTER 6.
MONITORING AND EVALUATION MECHANISMS IN THE NWFP PRSP
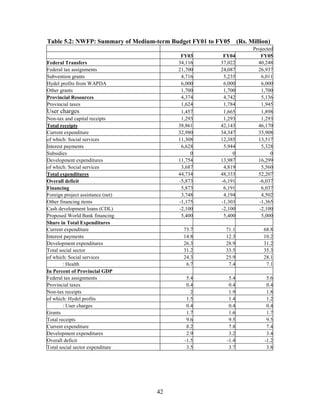
In addition to the Monitoring and Evaluation mechanism built into the National PRSP process [see Annex III] the specific aspects of the key monitoring indicators and the institutional mechanisms for their implementation in the NWFP are presented in table 6.1 below:
Table 6.1: Monitoring the NWFP PRSP
Areas and Indicators
End-Period Targets (FY05)
Institutional Arrangements for Monitoring
1. Overall
Provincial GDP growth rate
.
Poverty (Caloric)
4-5%
38% (down from 44% in FY99)
Planning and Development Department Source for Poverty Data; PIHS Survey every two years.
2. Public Finance
Provincial Tax Revenue Growth
User Charges
Pro-poor I-PRSP expenditures
Development expenditure
Maintain timely comprehensive and reconciled fiscal data using the New Accounting Model.
15% annual growth in FY03; 10% p.a. in FY04 & 05.
75% increase over FY03-05.
From 29% of expenditures in FY02 to 35% in FY05.
From 26% of total expenditures in FY02 to 31% in FY05
100% computerization and reconciliation of civil accounts.
Quarterly Fiscal Monitoring Reports, Annual Budget Statements of Department of Finance, and Annual Budgets.
Department of Finance/Accountant General Office.
3. Social Sectors
Gross primary enrollment rate
Gross primary enrollment rate female.
Reduction in primary school dropout rates
Girls school provided essential physical facilities
Full immunization % of children less than 2 years.
% of population with access to TB Control using DOTS.
Antenatal coverage of pregnant women by health professionals.
Contraceptive Prevalence Rate.
85% (up from 70%)
84% (up from 54%)
35% (down from 45%)
100% by FY05.
80% (up from 54%)
100% (up from 20%)
45% (up from 34%)
35% (up from 21%)
PIHS, Annual EMIS, MICS, Annual Monitoring Reports prepared by the Education Sector Reforms Unit, and Third Party Survey.
-do
-do-
PIHS, Annual HMIS, MICS, Annual Reports of the Health Sector Reforms Unit and Third Party Survey.
-do-
-do--
4. Infrastructure
population with access to safe drinking water.
Population of roads classified in poor condition.
65% (up from 58%)
50% (up from 80%)
PIHS, MICS
Annual reports of CWD, and Independent surveys.](https://image.slidesharecdn.com/2-prspnwfp-141022012400-conversion-gate01/85/POVERTY-REDUCTION-STRATEGY-PAPER-ON-NORTH-WESTERN-FRONTIER-PROVINCE-OF-PAKISTAN-52-320.jpg)
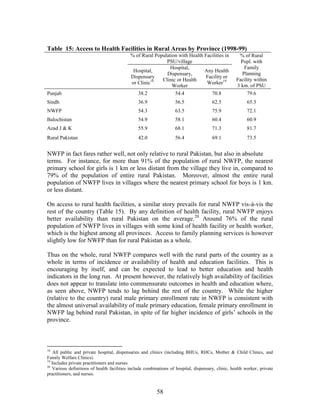
![50
Table 5: Inequality In Literacy - [Highest to Lowest Ratio – Per Capita Income Quintiles]
Male
Female
Total
INEQUALITY IN LITERACY
NWFP
1.92
3.37
2.30
Urban
1.69
2.76
2.06
Rural
2.15
3.99
2.53
INEQUALITY IN PRIMARY ENROLMENT RATIO
NWFP
1.58
2.74
1.94
Urban
1.33
2.35
1.64
Rural
1.83
3.12
2.24
INEQUALITY INSECONDARY ENROLMENT RATIO
NWFP
1.98
4.23
2.42
Urban
1.95
2.49
2.14
Rural
2.02
5.98
2.70
Source: SPDC (2001). Annual Review
Table 6: Inequality In Per Pupil Expenditure On Primary And Secondary Education [Highest to Lowest Ratio – Per Capita Income Quintiles]
Ratio
Primary Education
NWFP
7.07
Urban
7.79
Rural
6.35
Secondary Education
NWFP
6.11
Urban
7.01
Rural
5.22
Source: SPDC (2001). Annual Review
Table 7: Inequality In Housing Services [Highest to Lowest Ratio Per Capita Income Quintiles]
Electricity
Gas
Telephone
Piped Water
House connected to underground sewerage
NWFP
1.59
3.02
10.14
1.55
5.52
Urban
1.38
4.13
7.10
1.52
5.52
Rural
1.80
1.91
13.19
1.59
--
Source: SPDC (2001). Annual Review
Characteristics of the Poor
Understanding the nature of poverty requires looking beyond the limits of poverty as defined by lack of consumption, and examining the characteristics of poor households to identify the non-income dimensions of poverty. In this context, it is useful to draw correlations between consumption/income poverty and various household characteristics. Although such correlations will not be enough to establish a causal relationship, they do](https://image.slidesharecdn.com/2-prspnwfp-141022012400-conversion-gate01/85/POVERTY-REDUCTION-STRATEGY-PAPER-ON-NORTH-WESTERN-FRONTIER-PROVINCE-OF-PAKISTAN-58-320.jpg)