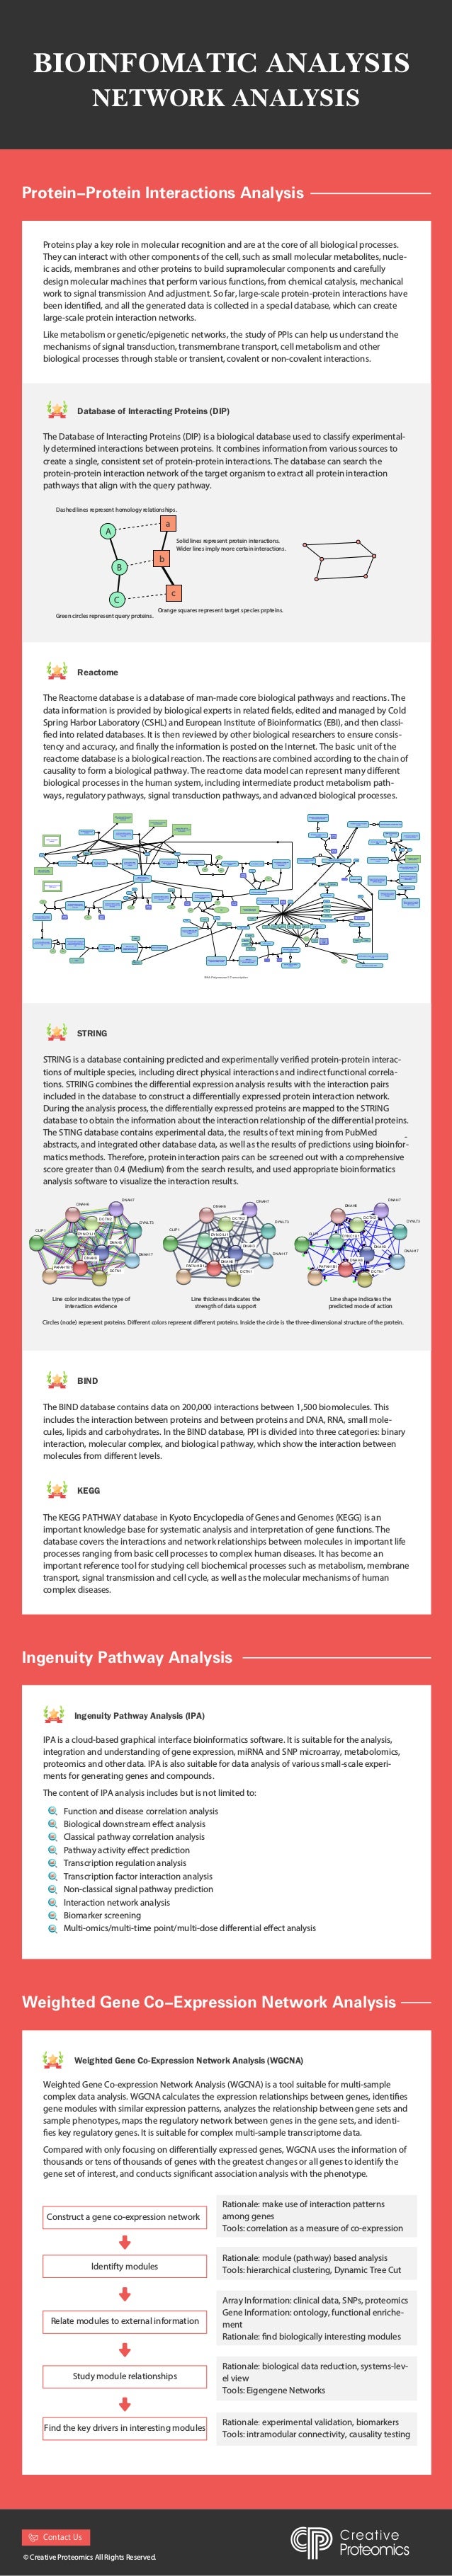
BIOINFOMATIC ANALYSIS
NETWORK ANALYSIS
Protein-Protein Interactions Analysis
Database of Interacting Proteins (DIP)
Reactome
STRING
Ingenuity Pathway Analysis
-
-
-
Comparison
© Creative Proteomics All Rights Reserved.
Proteins play a key role in molecular recognition and are at the core of all biological processes.
They can interact with other components of the cell, such as small molecular metabolites, nucle-
ic acids, membranes and other proteins to build supramolecular components and carefully
design molecular machines that perform various functions, from chemical catalysis, mechanical
work to signal transmission And adjustment. So far, large-scale protein-protein interactions have
been identified, and all the generated data is collected in a special database, which can create
large-scale protein interaction networks.
Like metabolism or genetic/epigenetic networks, the study of PPIs can help us understand the
mechanisms of signal transduction, transmembrane transport, cell metabolism and other
biological processes through stable or transient, covalent or non-covalent interactions.
The Database of Interacting Proteins (DIP) is a biological database used to classify experimental-
ly determined interactions between proteins. It combines information from various sources to
create a single, consistent set of protein-protein interactions. The database can search the
protein-protein interaction network of the target organism to extract all protein interaction
pathways that align with the query pathway.
A
B
C
Dashed lines represent homology relationships.
Solid lines represent protein interactions.
Wider lines imply more certain interactions.
Green circles represent query proteins.
Orange squares represent target species prpteins.
c
b
a
The Reactome database is a database of man-made core biological pathways and reactions. The
data information is provided by biological experts in related fields, edited and managed by Cold
Spring Harbor Laboratory (CSHL) and European Institute of Bioinformatics (EBI), and then classi-
fied into related databases. It is then reviewed by other biological researchers to ensure consis-
tency and accuracy, and finally the information is posted on the Internet. The basic unit of the
reactome database is a biological reaction. The reactions are combined according to the chain of
causality to form a biological pathway. The reactome data model can represent many different
biological processes in the human system, including intermediate product metabolism path-
ways, regulatory pathways, signal transduction pathways, and advanced biological processes.
STRING is a database containing predicted and experimentally verified protein-protein interac-
tions of multiple species, including direct physical interactions and indirect functional correla-
tions. STRING combines the differential expression analysis results with the interaction pairs
included in the database to construct a differentially expressed protein interaction network.
During the analysis process, the differentially expressed proteins are mapped to the STRING
database to obtain the information about the interaction relationship of the differential proteins.
The STING database contains experimental data, the results of text mining from PubMed
abstracts, and integrated other database data, as well as the results of predictions using bioinfor-
matics methods. Therefore, protein interaction pairs can be screened out with a comprehensive
score greater than 0.4 (Medium) from the search results, and used appropriate bioinformatics
analysis software to visualize the interaction results.
The BIND database contains data on 200,000 interactions between 1,500 biomolecules. This
includes the interaction between proteins and between proteins and DNA, RNA, small mole-
cules, lipids and carbohydrates. In the BIND database, PPI is divided into three categories: binary
interaction, molecular complex, and biological pathway, which show the interaction between
molecules from different levels.
DNAH7
DNAH6
DYNLT3
CLIP1
DNAH17
DCTN1
DNAH8
DNAH3
DCTN2
DYNC1LI1
PAFAH1B1
PAFAH1B1
DCTN2
DYNC1LI1
DNAH3
DNAH8
DCTN1
DNAH7
DNAH6
DYNLT3
CLIP1
DNAH17
DNAH7
DNAH6
DCTN2
DYNLT3
DYNC1LI1
CLIP1
DNAH3
DNAH17
DNAH8
PAFAH1B1
DCTN1
Line color indicates the type of
interaction evidence
Line thickness indicates the
strength of data support
Line shape indicates the
predicted mode of action
Circles (node) represent proteins. Different colors represent different proteins. Inside the circle is the three-dimensional structure of the protein.
BIND
The KEGG PATHWAY database in Kyoto Encyclopedia of Genes and Genomes (KEGG) is an
important knowledge base for systematic analysis and interpretation of gene functions. The
database covers the interactions and network relationships between molecules in important life
processes ranging from basic cell processes to complex human diseases. It has become an
important reference tool for studying cell biochemical processes such as metabolism, membrane
transport, signal transmission and cell cycle, as well as the molecular mechanisms of human
complex diseases.
KEGG
IPA is a cloud-based graphical interface bioinformatics software. It is suitable for the analysis,
integration and understanding of gene expression, miRNA and SNP microarray, metabolomics,
proteomics and other data. IPA is also suitable for data analysis of various small-scale experi-
ments for generating genes and compounds.
The content of IPA analysis includes but is not limited to:
Ingenuity Pathway Analysis (IPA)
Weighted Gene Co-Expression Network Analysis
Weighted Gene Co-expression Network Analysis (WGCNA) is a tool suitable for multi-sample
complex data analysis. WGCNA calculates the expression relationships between genes, identifies
gene modules with similar expression patterns, analyzes the relationship between gene sets and
sample phenotypes, maps the regulatory network between genes in the gene sets, and identi-
fies key regulatory genes. It is suitable for complex multi-sample transcriptome data.
Compared with only focusing on differentially expressed genes, WGCNA uses the information of
thousands or tens of thousands of genes with the greatest changes or all genes to identify the
gene set of interest, and conducts significant association analysis with the phenotype.
Weighted Gene Co-Expression Network Analysis (WGCNA)
Function and disease correlation analysis
Biological downstream effect analysis
Classical pathway correlation analysis
Pathway activity effect prediction
Transcription regulation analysis
Transcription factor interaction analysis
Non-classical signal pathway prediction
Interaction network analysis
Biomarker screening
Multi-omics/multi-time point/multi-dose differential effect analysis
Construct a gene co-expression network
ldentifty modules
Relate modules to external information
Study module relationships
Find the key drivers in interesting modules
Rationale: module (pathway) based analysis
Tools: hierarchical clustering, Dynamic Tree Cut
Rationale: make use of interaction patterns
among genes
Tools: correlation as a measure of co-expression
Array Information: clinical data, SNPs, proteomics
Gene Information: ontology, functional enriche-
ment
Rationale: find biologically interesting modules
Rationale: biological data reduction, systems-lev-
el view
Tools: Eigengene Networks
Rationale: experimental validation, biomarkers
Tools: intramodular connectivity, causality testing
Contact Us

Protein Network Analysis

  • 1.
    BIOINFOMATIC ANALYSIS NETWORK ANALYSIS Protein-ProteinInteractions Analysis Database of Interacting Proteins (DIP) Reactome STRING Ingenuity Pathway Analysis - - - Comparison © Creative Proteomics All Rights Reserved. Proteins play a key role in molecular recognition and are at the core of all biological processes. They can interact with other components of the cell, such as small molecular metabolites, nucle- ic acids, membranes and other proteins to build supramolecular components and carefully design molecular machines that perform various functions, from chemical catalysis, mechanical work to signal transmission And adjustment. So far, large-scale protein-protein interactions have been identified, and all the generated data is collected in a special database, which can create large-scale protein interaction networks. Like metabolism or genetic/epigenetic networks, the study of PPIs can help us understand the mechanisms of signal transduction, transmembrane transport, cell metabolism and other biological processes through stable or transient, covalent or non-covalent interactions. The Database of Interacting Proteins (DIP) is a biological database used to classify experimental- ly determined interactions between proteins. It combines information from various sources to create a single, consistent set of protein-protein interactions. The database can search the protein-protein interaction network of the target organism to extract all protein interaction pathways that align with the query pathway. A B C Dashed lines represent homology relationships. Solid lines represent protein interactions. Wider lines imply more certain interactions. Green circles represent query proteins. Orange squares represent target species prpteins. c b a The Reactome database is a database of man-made core biological pathways and reactions. The data information is provided by biological experts in related fields, edited and managed by Cold Spring Harbor Laboratory (CSHL) and European Institute of Bioinformatics (EBI), and then classi- fied into related databases. It is then reviewed by other biological researchers to ensure consis- tency and accuracy, and finally the information is posted on the Internet. The basic unit of the reactome database is a biological reaction. The reactions are combined according to the chain of causality to form a biological pathway. The reactome data model can represent many different biological processes in the human system, including intermediate product metabolism path- ways, regulatory pathways, signal transduction pathways, and advanced biological processes. STRING is a database containing predicted and experimentally verified protein-protein interac- tions of multiple species, including direct physical interactions and indirect functional correla- tions. STRING combines the differential expression analysis results with the interaction pairs included in the database to construct a differentially expressed protein interaction network. During the analysis process, the differentially expressed proteins are mapped to the STRING database to obtain the information about the interaction relationship of the differential proteins. The STING database contains experimental data, the results of text mining from PubMed abstracts, and integrated other database data, as well as the results of predictions using bioinfor- matics methods. Therefore, protein interaction pairs can be screened out with a comprehensive score greater than 0.4 (Medium) from the search results, and used appropriate bioinformatics analysis software to visualize the interaction results. The BIND database contains data on 200,000 interactions between 1,500 biomolecules. This includes the interaction between proteins and between proteins and DNA, RNA, small mole- cules, lipids and carbohydrates. In the BIND database, PPI is divided into three categories: binary interaction, molecular complex, and biological pathway, which show the interaction between molecules from different levels. DNAH7 DNAH6 DYNLT3 CLIP1 DNAH17 DCTN1 DNAH8 DNAH3 DCTN2 DYNC1LI1 PAFAH1B1 PAFAH1B1 DCTN2 DYNC1LI1 DNAH3 DNAH8 DCTN1 DNAH7 DNAH6 DYNLT3 CLIP1 DNAH17 DNAH7 DNAH6 DCTN2 DYNLT3 DYNC1LI1 CLIP1 DNAH3 DNAH17 DNAH8 PAFAH1B1 DCTN1 Line color indicates the type of interaction evidence Line thickness indicates the strength of data support Line shape indicates the predicted mode of action Circles (node) represent proteins. Different colors represent different proteins. Inside the circle is the three-dimensional structure of the protein. BIND The KEGG PATHWAY database in Kyoto Encyclopedia of Genes and Genomes (KEGG) is an important knowledge base for systematic analysis and interpretation of gene functions. The database covers the interactions and network relationships between molecules in important life processes ranging from basic cell processes to complex human diseases. It has become an important reference tool for studying cell biochemical processes such as metabolism, membrane transport, signal transmission and cell cycle, as well as the molecular mechanisms of human complex diseases. KEGG IPA is a cloud-based graphical interface bioinformatics software. It is suitable for the analysis, integration and understanding of gene expression, miRNA and SNP microarray, metabolomics, proteomics and other data. IPA is also suitable for data analysis of various small-scale experi- ments for generating genes and compounds. The content of IPA analysis includes but is not limited to: Ingenuity Pathway Analysis (IPA) Weighted Gene Co-Expression Network Analysis Weighted Gene Co-expression Network Analysis (WGCNA) is a tool suitable for multi-sample complex data analysis. WGCNA calculates the expression relationships between genes, identifies gene modules with similar expression patterns, analyzes the relationship between gene sets and sample phenotypes, maps the regulatory network between genes in the gene sets, and identi- fies key regulatory genes. It is suitable for complex multi-sample transcriptome data. Compared with only focusing on differentially expressed genes, WGCNA uses the information of thousands or tens of thousands of genes with the greatest changes or all genes to identify the gene set of interest, and conducts significant association analysis with the phenotype. Weighted Gene Co-Expression Network Analysis (WGCNA) Function and disease correlation analysis Biological downstream effect analysis Classical pathway correlation analysis Pathway activity effect prediction Transcription regulation analysis Transcription factor interaction analysis Non-classical signal pathway prediction Interaction network analysis Biomarker screening Multi-omics/multi-time point/multi-dose differential effect analysis Construct a gene co-expression network ldentifty modules Relate modules to external information Study module relationships Find the key drivers in interesting modules Rationale: module (pathway) based analysis Tools: hierarchical clustering, Dynamic Tree Cut Rationale: make use of interaction patterns among genes Tools: correlation as a measure of co-expression Array Information: clinical data, SNPs, proteomics Gene Information: ontology, functional enriche- ment Rationale: find biologically interesting modules Rationale: biological data reduction, systems-lev- el view Tools: Eigengene Networks Rationale: experimental validation, biomarkers Tools: intramodular connectivity, causality testing Contact Us