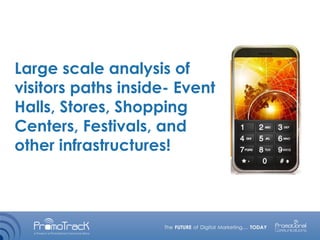
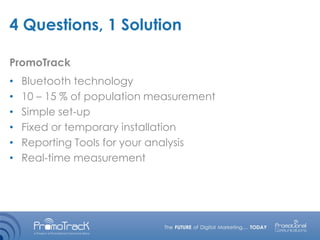
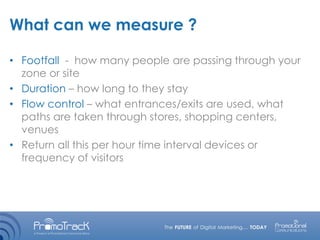
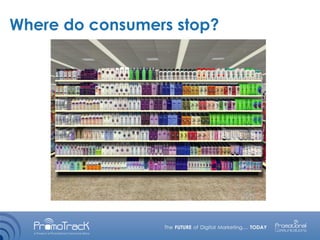
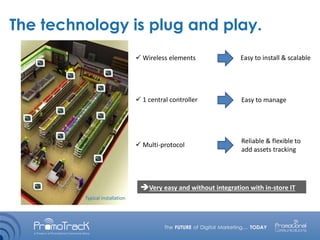
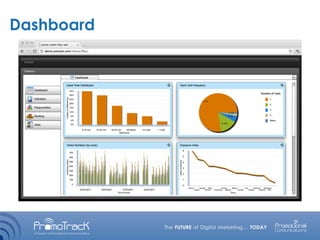
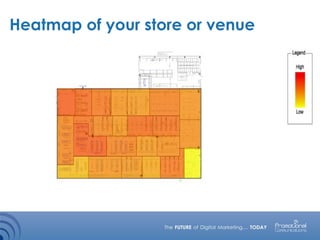
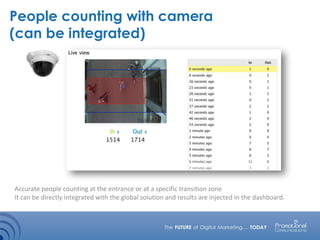
A Product of Promotional Communications, LLC
650 Halstead Ave.
Mamaroneck, NY 10543
(914) 381-1632
Large scale analysis of
visitors paths inside- Event
Halls, Stores, Shopping
Centers, Festivals, and
other infrastructures!
4 Questions, 1 Solution
• Bluetooth technology
• 10 – 15 % of population measurement
• Simple set-up
• Fixed or temporary installation
• Reporting Tools for your analysis
• Real-time measurement
PromoTrack
What can we measure ?
• Footfall - how many people are passing through your
zone or site
• Duration – how long to they stay
• Flow control – what entrances/exits are used, what
paths are taken through stores, shopping centers,
venues
• Return all this per hour time interval devices or
frequency of visitors
What is attractive about an aisle?
Where do people go?
Where they spend time?
Where do consumers stop?
The technology is plug and play.
 Wireless elements Easy to install & scalable
 1 central controller Easy to manage
 Multi-protocol
Reliable & flexible to
add assets tracking
Very easy and without integration with in-store IT
Typical installation
Dashboard
Heatmap of your store or venue
People counting with camera
(can be integrated)
Accurate people counting at the entrance or at a specific transition zone
It can be directly integrated with the global solution and results are injected in the dashboard.
Business Intelligence Fact Sheet
Unique innovative technology to understand shopper
behavior, producing actionable insights about what to
improve in your store
Provides large scale analysis of visitor’s path inside of
store. Drilled down detail of consumer visit during all
open hours.
Primary intelligence gained:
• Footfall. How many people are passing through your
zone or site?
• Frequency. How often unique visitors pass -- changed
• Dwell Time. How long do they stay?
• Flow Control. What entrances / exits are used? What
paths are taken through store? Average time all spent
at specific location?
Using Bluetooth detectors (not collecting any information) with
our plug and play technology, allows retailers to gather
information on how consumer is spending time in store.
Where should departments be located to
generate largest sales?
• Identify main destinations?
How much time spent in each aisle/section
• Opportunistic areas?
Detailed info on where consumer stops
How many times visit each aisle/section
• Link path and frequency
Walk pattern
Using our passive ‘plug and play’ technology, this
information is gathered in the background without the
consumer having to take any actions
Analysis of aisle efficiency
2523
visitors in
the store
1851
in aisle A
256
stops in
zone A
128
stops in
zone B
26 sec
on average
53
buyers
For each zone
Example of a given period of time
Advanced Analysis of aisle efficiency (not part of Dashboard) –
Analysis of customers based on their frequency and departments
visited
Advanced Analysis of aisle efficiency (not part of Dashboard) –
Footfall of departments divided between Saturday and Weekdays
Advanced Analysis of aisle efficiency (not part of Dashboard) – Cross
of visitor traffic with sales by department
To sum up...
• Prove the efficiency of the store in terms of traffic vs. sales
• Create new opportunities for store managers
• Provide insights on specific parts of a store at the individual
level
• Provide third party advertisers with metrics
• Advanced Analysis techniques drill down into sales
efficiencies, flow pattern analysis, etc
Unique innovative technology to
understand shoppers behavior,
producing actionable insights leading to
increased profits by optimizing your
location!
Thank you.
Promotional Communications LLC
650 Halstead Avenue, Mamaroneck, NY 10543, USA
TEL – (914) 381-1632
Dan Seidman (FR / ENG) - dan@promosend.net | +1 (914) 414 6760
Barbara Kent - bkent@promosend.net | +1 (914) 572 1463

Promo trackppt2013

  • 1.
    A Product ofPromotional Communications, LLC 650 Halstead Ave. Mamaroneck, NY 10543 (914) 381-1632
  • 2.
    Large scale analysisof visitors paths inside- Event Halls, Stores, Shopping Centers, Festivals, and other infrastructures!
  • 3.
    4 Questions, 1Solution • Bluetooth technology • 10 – 15 % of population measurement • Simple set-up • Fixed or temporary installation • Reporting Tools for your analysis • Real-time measurement PromoTrack
  • 4.
    What can wemeasure ? • Footfall - how many people are passing through your zone or site • Duration – how long to they stay • Flow control – what entrances/exits are used, what paths are taken through stores, shopping centers, venues • Return all this per hour time interval devices or frequency of visitors
  • 5.
    What is attractiveabout an aisle?
  • 6.
  • 7.
  • 8.
  • 9.
    The technology isplug and play.  Wireless elements Easy to install & scalable  1 central controller Easy to manage  Multi-protocol Reliable & flexible to add assets tracking Very easy and without integration with in-store IT Typical installation
  • 10.
  • 11.
    Heatmap of yourstore or venue
  • 12.
    People counting withcamera (can be integrated) Accurate people counting at the entrance or at a specific transition zone It can be directly integrated with the global solution and results are injected in the dashboard.
  • 13.
    Business Intelligence FactSheet Unique innovative technology to understand shopper behavior, producing actionable insights about what to improve in your store Provides large scale analysis of visitor’s path inside of store. Drilled down detail of consumer visit during all open hours.
  • 14.
    Primary intelligence gained: •Footfall. How many people are passing through your zone or site? • Frequency. How often unique visitors pass -- changed • Dwell Time. How long do they stay? • Flow Control. What entrances / exits are used? What paths are taken through store? Average time all spent at specific location? Using Bluetooth detectors (not collecting any information) with our plug and play technology, allows retailers to gather information on how consumer is spending time in store.
  • 15.
    Where should departmentsbe located to generate largest sales? • Identify main destinations? How much time spent in each aisle/section • Opportunistic areas? Detailed info on where consumer stops How many times visit each aisle/section • Link path and frequency Walk pattern Using our passive ‘plug and play’ technology, this information is gathered in the background without the consumer having to take any actions
  • 16.
    Analysis of aisleefficiency 2523 visitors in the store 1851 in aisle A 256 stops in zone A 128 stops in zone B 26 sec on average 53 buyers For each zone Example of a given period of time
  • 17.
    Advanced Analysis ofaisle efficiency (not part of Dashboard) – Analysis of customers based on their frequency and departments visited
  • 18.
    Advanced Analysis ofaisle efficiency (not part of Dashboard) – Footfall of departments divided between Saturday and Weekdays
  • 19.
    Advanced Analysis ofaisle efficiency (not part of Dashboard) – Cross of visitor traffic with sales by department
  • 20.
    To sum up... •Prove the efficiency of the store in terms of traffic vs. sales • Create new opportunities for store managers • Provide insights on specific parts of a store at the individual level • Provide third party advertisers with metrics • Advanced Analysis techniques drill down into sales efficiencies, flow pattern analysis, etc Unique innovative technology to understand shoppers behavior, producing actionable insights leading to increased profits by optimizing your location!
  • 21.
    Thank you. Promotional CommunicationsLLC 650 Halstead Avenue, Mamaroneck, NY 10543, USA TEL – (914) 381-1632 Dan Seidman (FR / ENG) - dan@promosend.net | +1 (914) 414 6760 Barbara Kent - bkent@promosend.net | +1 (914) 572 1463