Promise is debt - A Systems Thinking perspective on technical debt - Marc Evers & Willem van den Ende
•
1 like•473 views


Recommended
More Related Content
What's hot
What's hot (20)
Viewers also liked
Viewers also liked (7)
Similar to Promise is debt - A Systems Thinking perspective on technical debt - Marc Evers & Willem van den Ende
Similar to Promise is debt - A Systems Thinking perspective on technical debt - Marc Evers & Willem van den Ende (20)
More from AGILEMinds
More from AGILEMinds (20)
Promise is debt - A Systems Thinking perspective on technical debt - Marc Evers & Willem van den Ende
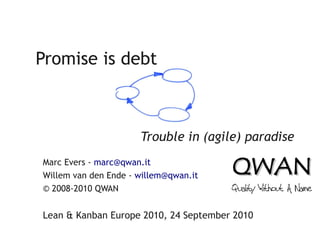
- 1. Promise is debt Trouble in (agile) paradise Marc Evers - marc@qwan.it Willem van den Ende - willem@qwan.it © 2008-2010 QWAN Lean & Kanban Europe 2010, 24 September 2010
- 2. Overview ● About us ● Benefits ● Our problem ● Systems Thinking in six simple steps ● Summary ● Q&A
- 3. willem@qwan.it rob@qwan.it marc@qwan.it www.qwan.it
- 4. Key points Most problems are systemic Look at whole & parts Tackle root causes, instead of fire fighting Prevent local optimization
- 5. Our problem We taught everybody agile but.... customers are unhappy developers are preparing their resumes What happened? What can we do now? How can we prevent this the next time?
- 6. We need to look at the whole system
- 7. Diagram of Effects – 6 Steps 1. tell the story − ask questions, determine scope and focus question 2. collect variables − observable or measurable − behaviour over time 3. determine cause effect relations 4. look for loops − reinforcing, stabilizing 5. simplify − 7 ± 2 variables - remove unrelated variables − split up the diagram 6. identify possible interventions
- 8. Step 1 – Tell the Story Perceived Situation Telling already gives inspiration Try not to jump to solutions now
- 9. Story - Adding a customer Who has 1 customer? Who serves multiple customers? Who has to share developers with other customers?
- 10. Manager in the middle 3 customers, 4 developers, 1 manager 'special features' for each customer
- 11. The road to hell is paved with good intentions Let's promise one 'special feature' to show what we can do
- 12. Step 2 – Collect Variables Simple names work best We use # to indicate numbers Brainstorm: don't worry about relevance or relations
- 13. Our variables Customer satisfaction Features promised Customer expectations Planned features
- 14. Step 3 – Determine Cause Effect Relations 'Positive' Effect 'Negative' Effect B A B A Delay A B
- 15. Features Customer Planned promised expectations features Customer satisfaction
- 16. Tell some more... Developers work harder, but cut corners More defects Customers :( Manager promises a bit more...
- 17. Features Customer Planned promised expectations features Customer Workload satisfaction Pressure Corners cut to Defects deliver Design debt
- 18. Step ... “Oh yes, that reminds me” Design debt makes each new feature more €xp€nsiv€ velocity goes down
- 19. Features Customer Planned promised expectations features Customer Workload satisfaction Probability that Defects Corners Pressure promises will be cut to deliver fulfilled Design Time needed for defects debt and new features
- 20. Step 4 – Identify Loops This gives focus for interventions Even number of 'negative' effects: Snowball Odd: Stabilizing
- 21. Where are the loops? Features Customer Planned promised expectations features Customer Workload satisfaction Probability that Defects Corners Pressure promises will be cut to deliver fulfilled Design Time needed for defects debt and new features
- 22. Features Customer Planned promised expectations features Customer Workload satisfaction Probability that Defects Corners Pressure promises will be cut to deliver fulfilled Design Time needed for defects debt and new features
- 23. Step 5 - Simplify Remove Variables and Relations
- 24. What causes this? Customers – don't have a choice – well, that's what they think – afraid to speak up and put up with it – the product is really not that important Developers try to make the best of it – pride in craftsmanship over early escalation Managers want to score – escalation / early transparency equals losing face
- 25. However Sooner or later, the system will collapse People burn out Developers leave Customers give up
- 26. Step 6 - Identify possible interventions Add Management Decision A B Remove Variable Add Variable Defects ?
- 27. What would you do to recover from this situation?
- 28. Use a 'gate' Features Customer Planned promised expectations features Customer Workload satisfaction Probability that Defects Corners Pressure promises will be cut to deliver fulfilled Design Time needed for defects debt and new features
- 29. Developers say 'no' Features Customer Planned promised expectations features Customer Workload satisfaction Probability that Defects Corners Pressure promises will be cut to deliver fulfilled Design Time needed for defects debt and new features
- 30. Don't overpromise Features Customer Planned promised expectations features Customer Workload satisfaction Probability that Defects Corners Pressure promises will be cut to deliver fulfilled Design Time needed for defects debt and new features
- 31. Recover Features Customer Planned promised expectations features Code Customer Review Workload satisfaction Probability that Defects Corners Pressure promises will be cut to deliver fulfilled Design Time needed for defects debt and new features
- 32. Higher level interventions (1) Work on a clear product vision – product boxes – release early Shield team from customer interruptions – no let's just do this – customer proxy / product owner / product manager
- 33. Higher level interventions (2) Use more 'places to intervene in a system' – but not too many Change mental models – what is development now? – change the cultural pattern
- 34. Creating a diagram of effects 1. tell the story − ask questions, determine scope and focus question 2. collect variables − observable or measurable − behaviour over time 3. determine cause effect relations 4. look for loops − reinforcing, stabilizing 5. simplify − 7 ± 2 variables - remove unrelated variables − split up the diagram 6. identify possible interventions
- 35. Systems thinking in practice Pitfall: it's only the perception of the group that makes the diagram Involvement leads to buy-in for interventions Diagram helps to explain it to others It's all about storytelling The diagram is a nice by-product Don't obsess over your models
- 36. It's not just a ... problem difficult issues are technical, organizational and managerial all at once linear cause-effect thinking is not enough root causes are usually systemic blaming someone else does not solve it
- 37. We need to look at the whole system
- 38. Seriously
- 39. Background Gerald M. Weinberg, Quality Software Management Vol. 1-4 Peter M. Senge, The Fifth Discipline (1993) Linda Booth Sweeney & Dennis Meadows, Systems Thinking Playbook (1995) Poppendieck, Implementing Lean Software Development (2006) Kent Beck, eXtreme Programming Explained (1999) Donella H. Meadows, Places to Intervene in a System (1997) www.developerdotstar.com/mag/articles/places_intervene_system.html Marc Evers & Willem van den Ende, Promise is Debt (2008) www.systemsthinking.net/publications/promise_is_debt_6-2-2008.pdf
- 40. Credits wicked weather by alexdecarvalho - flickr.com/photos/adc/423172478/ Point! by Lisamarie Babik - flickr.com/photos/78453620@N00/1448178195 Earth, courtesy Apollo 17, and probably the most reproduced image of all time by woodleywonderworks - flickr.com/photos/wwworks/2222548359/in/photostream/ Our Milky Way Galaxy.. by Sir Mervs - flickr.com/photos/14150482@N02/2544902240 WHAT ARE YOU LOOKING AT? by nolifebeforecoffee - flickr.com/photos/55279617@N00/124659356 Artistic Wormhole by Steve Jurvetson - flickr.com/photos/44124348109@N01/2490285058 Measuring time © aussiegall - flickr.com/photos/aussiegall/286709039/ New Year's Resolution: 36/365 by Sasha Wolff – flickr.com/photos/27786290@N05/3171917389 dog on treadmill by Anne Norman – flickr.com/photos/29278394@N00/23844169 Free Loopy Colorful Background Wallpaper Creative Commons by D. Sharon Pruitt – flickr.com/photos/40645538@N00/447277429 Baker Hotel (half of it!) by Justin Cozart - flickr.com/photos/40011478@N00/2296478479 Which way? by Kevin Dooley – flickr.com/photos/12836528@N00/2445707568 Flickr images were collected using QWAN Labs PhotoSuggest - labs.qwan.it/photosuggest