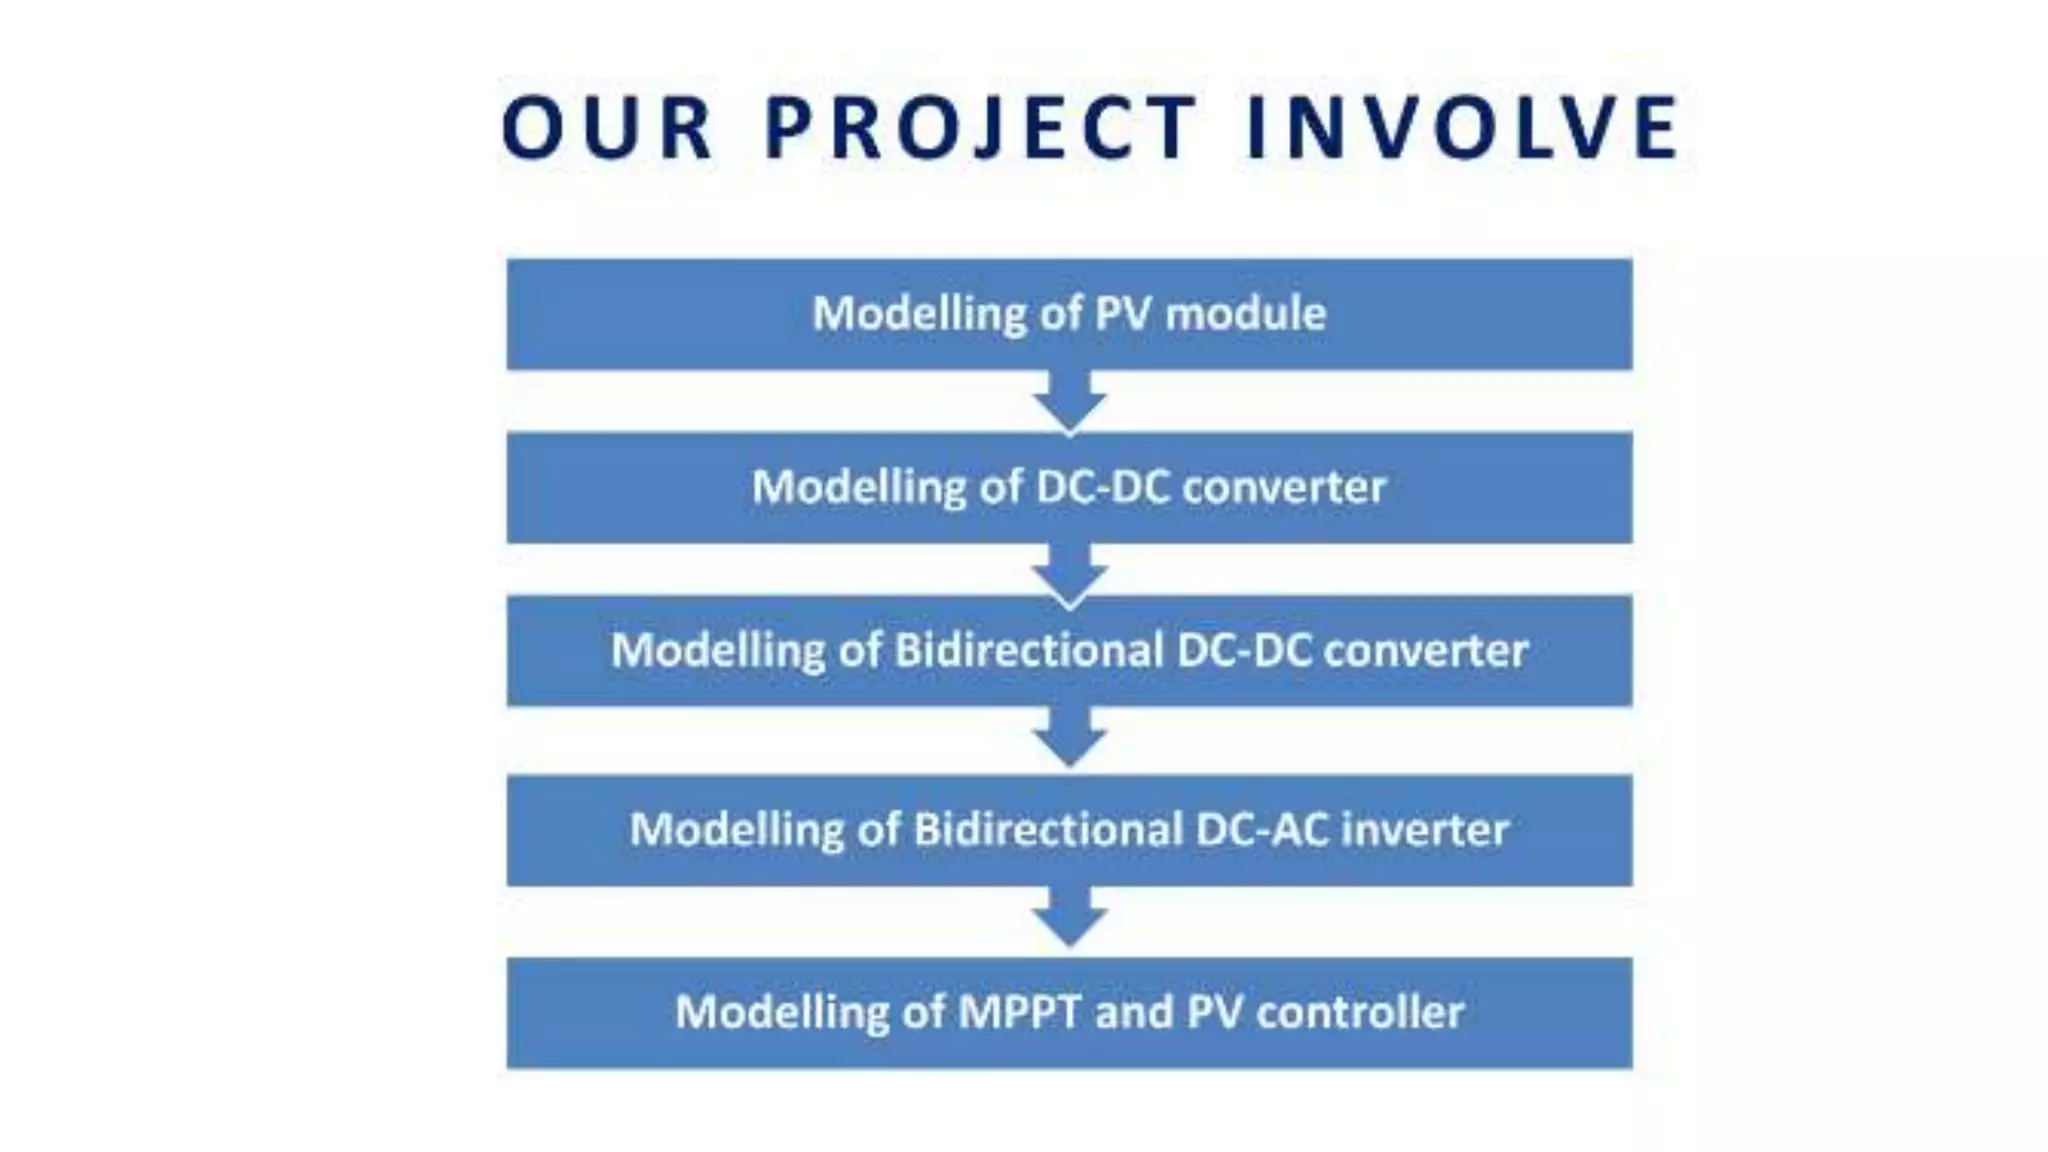
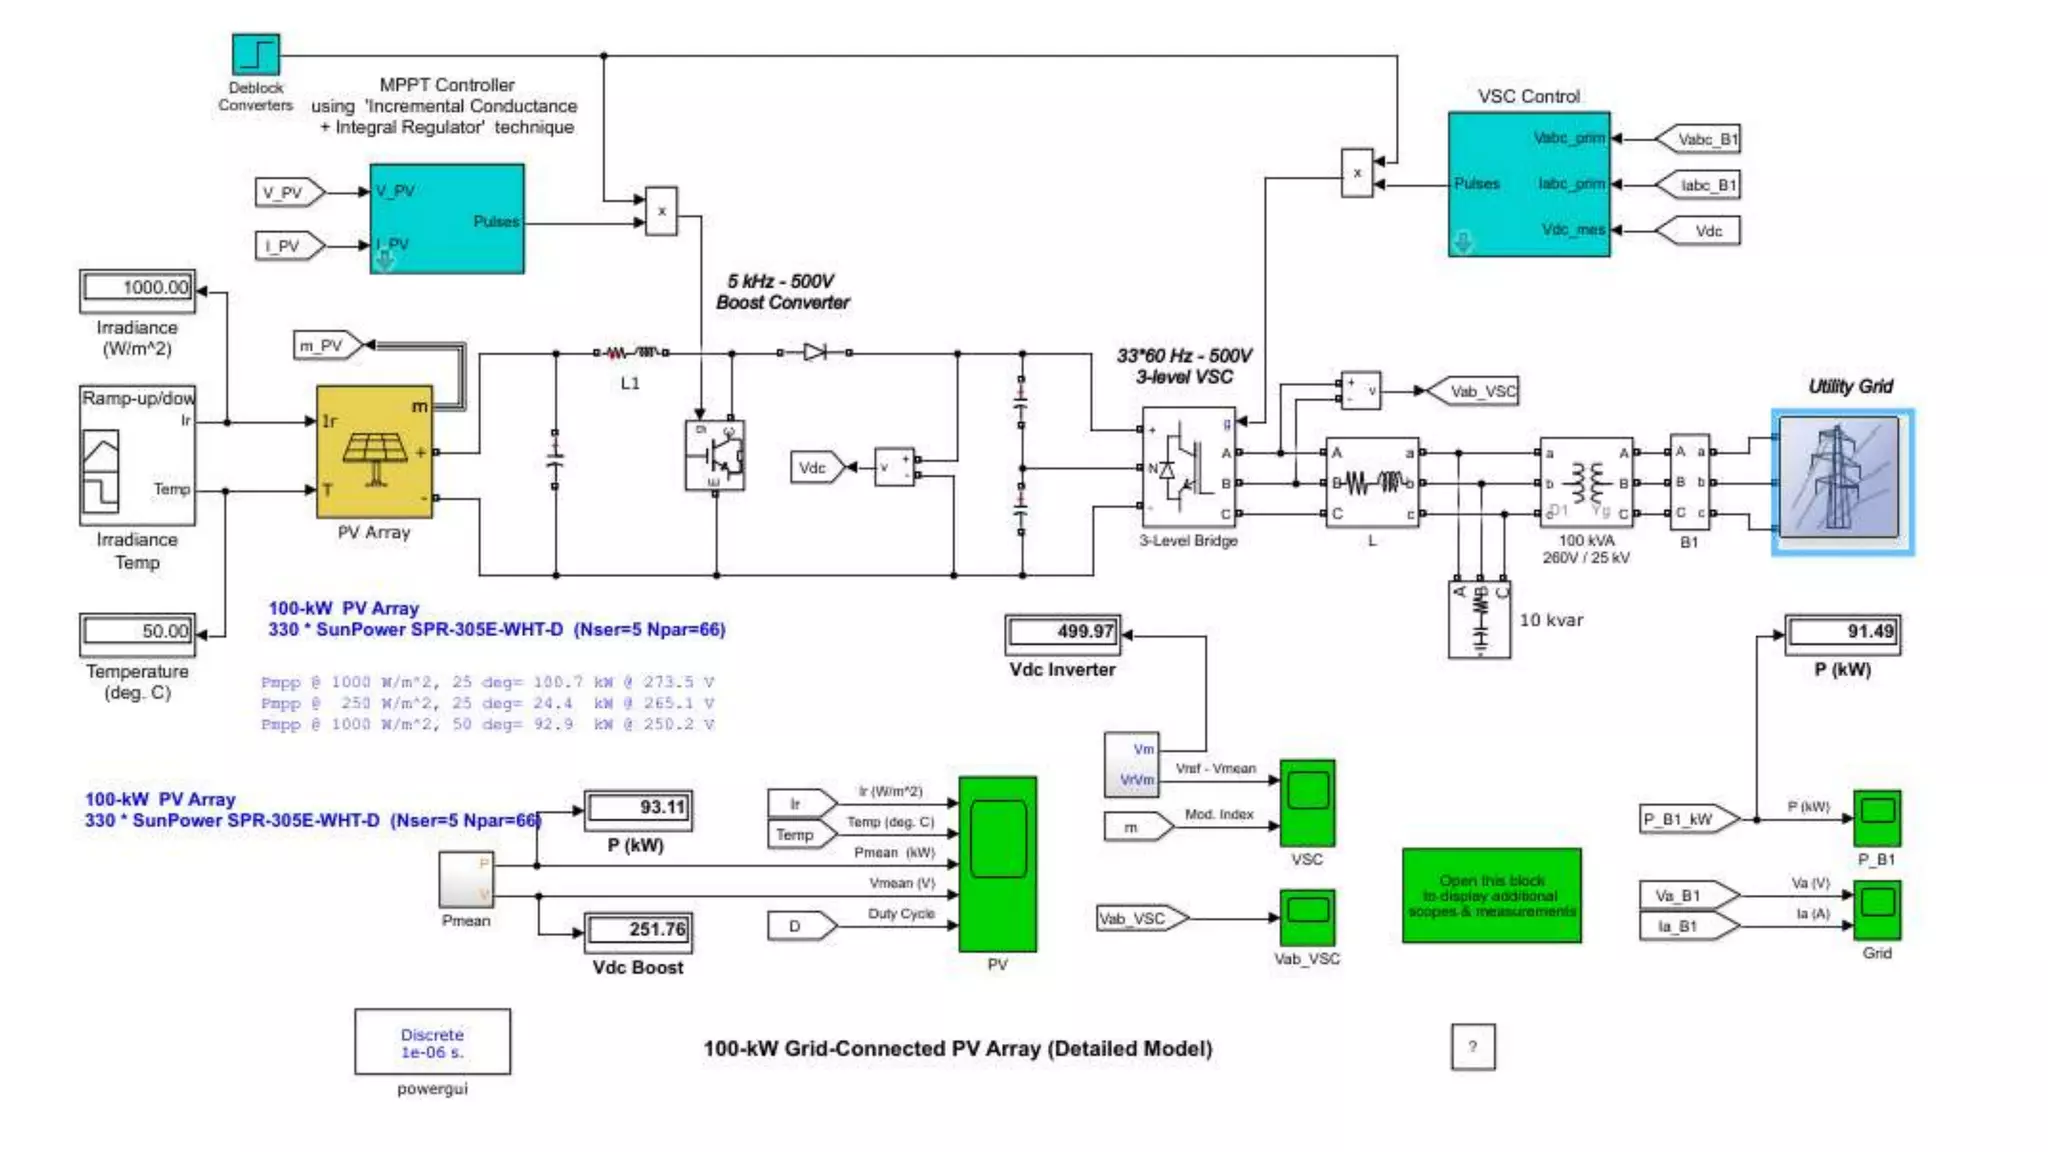
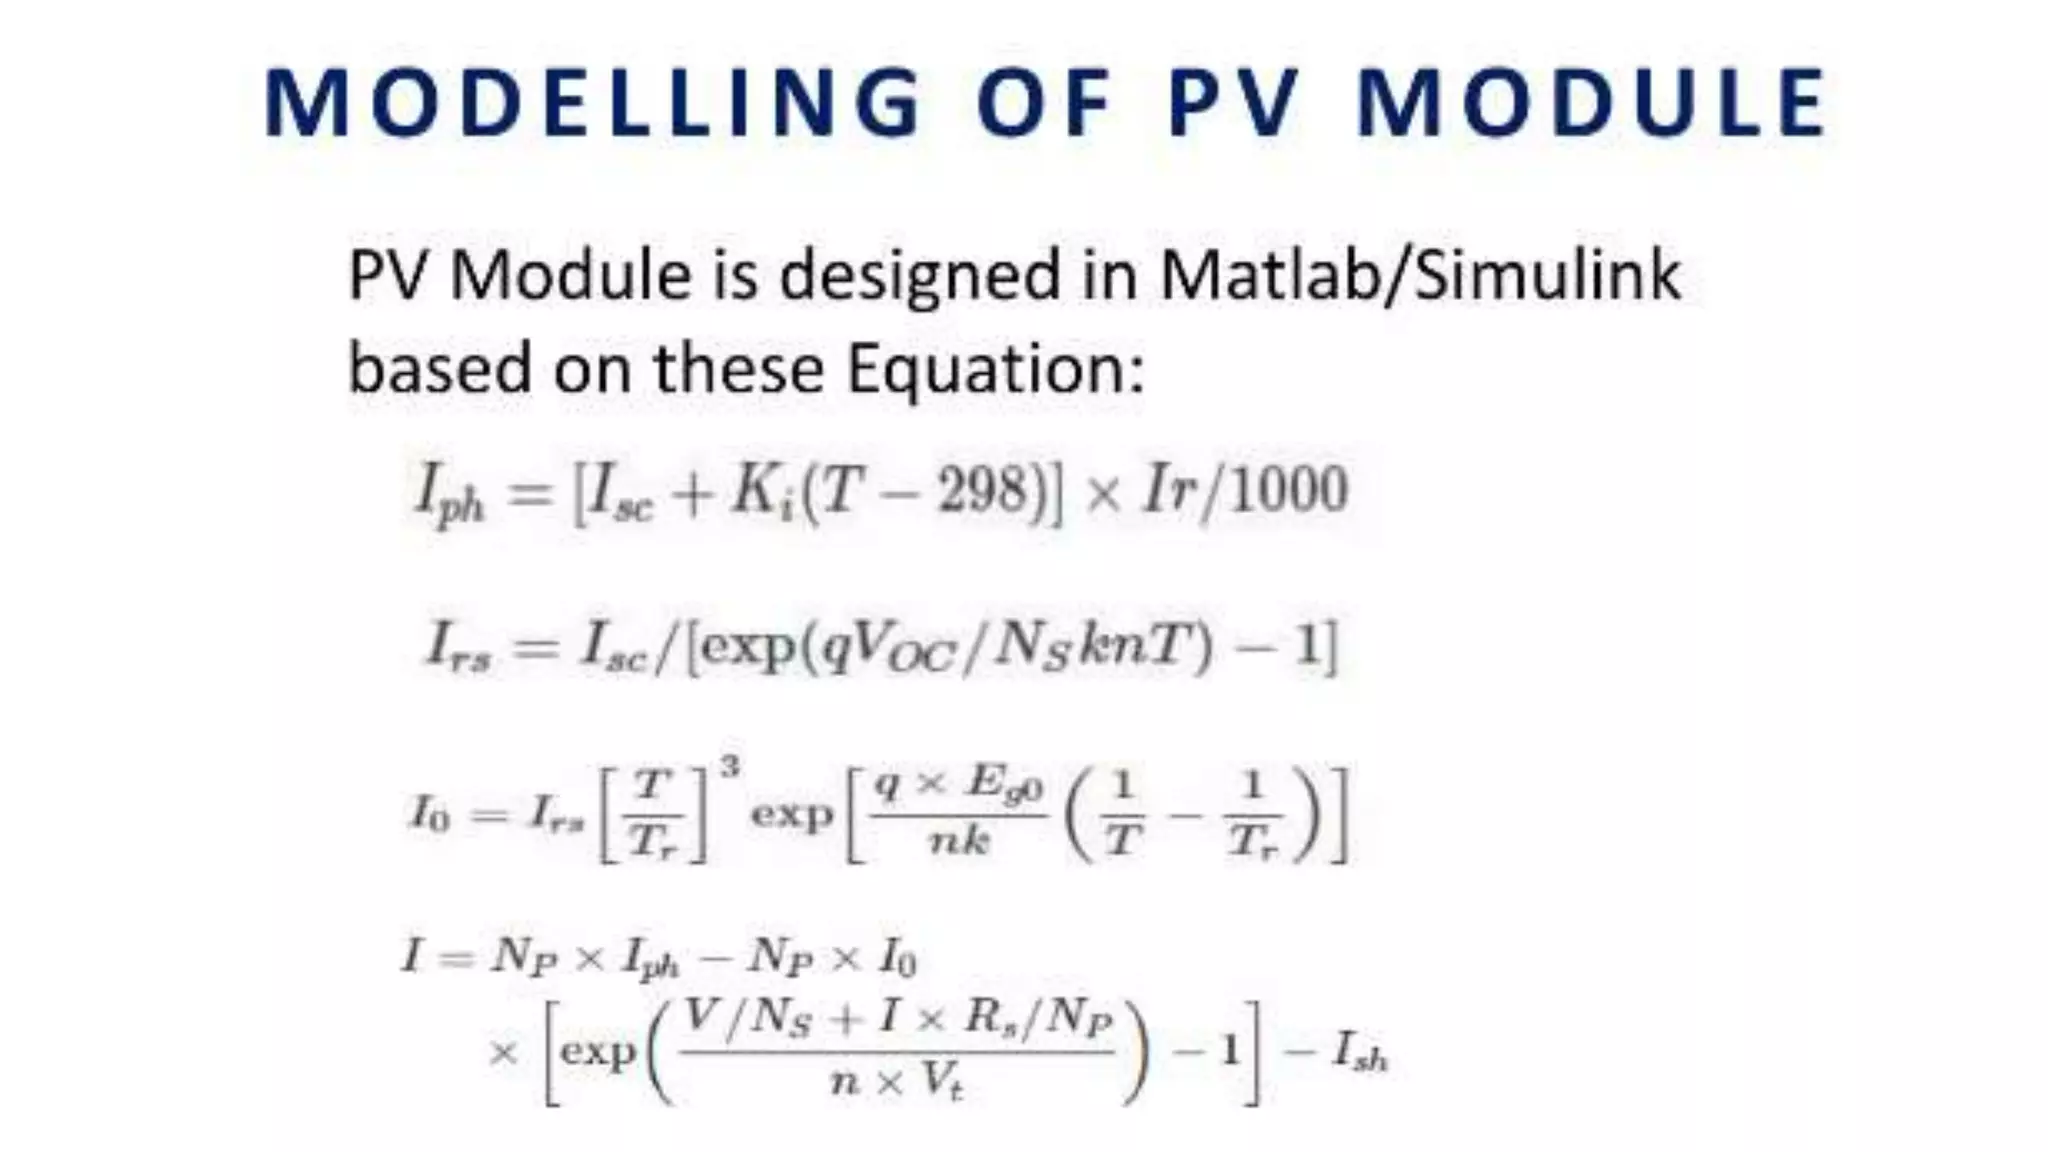
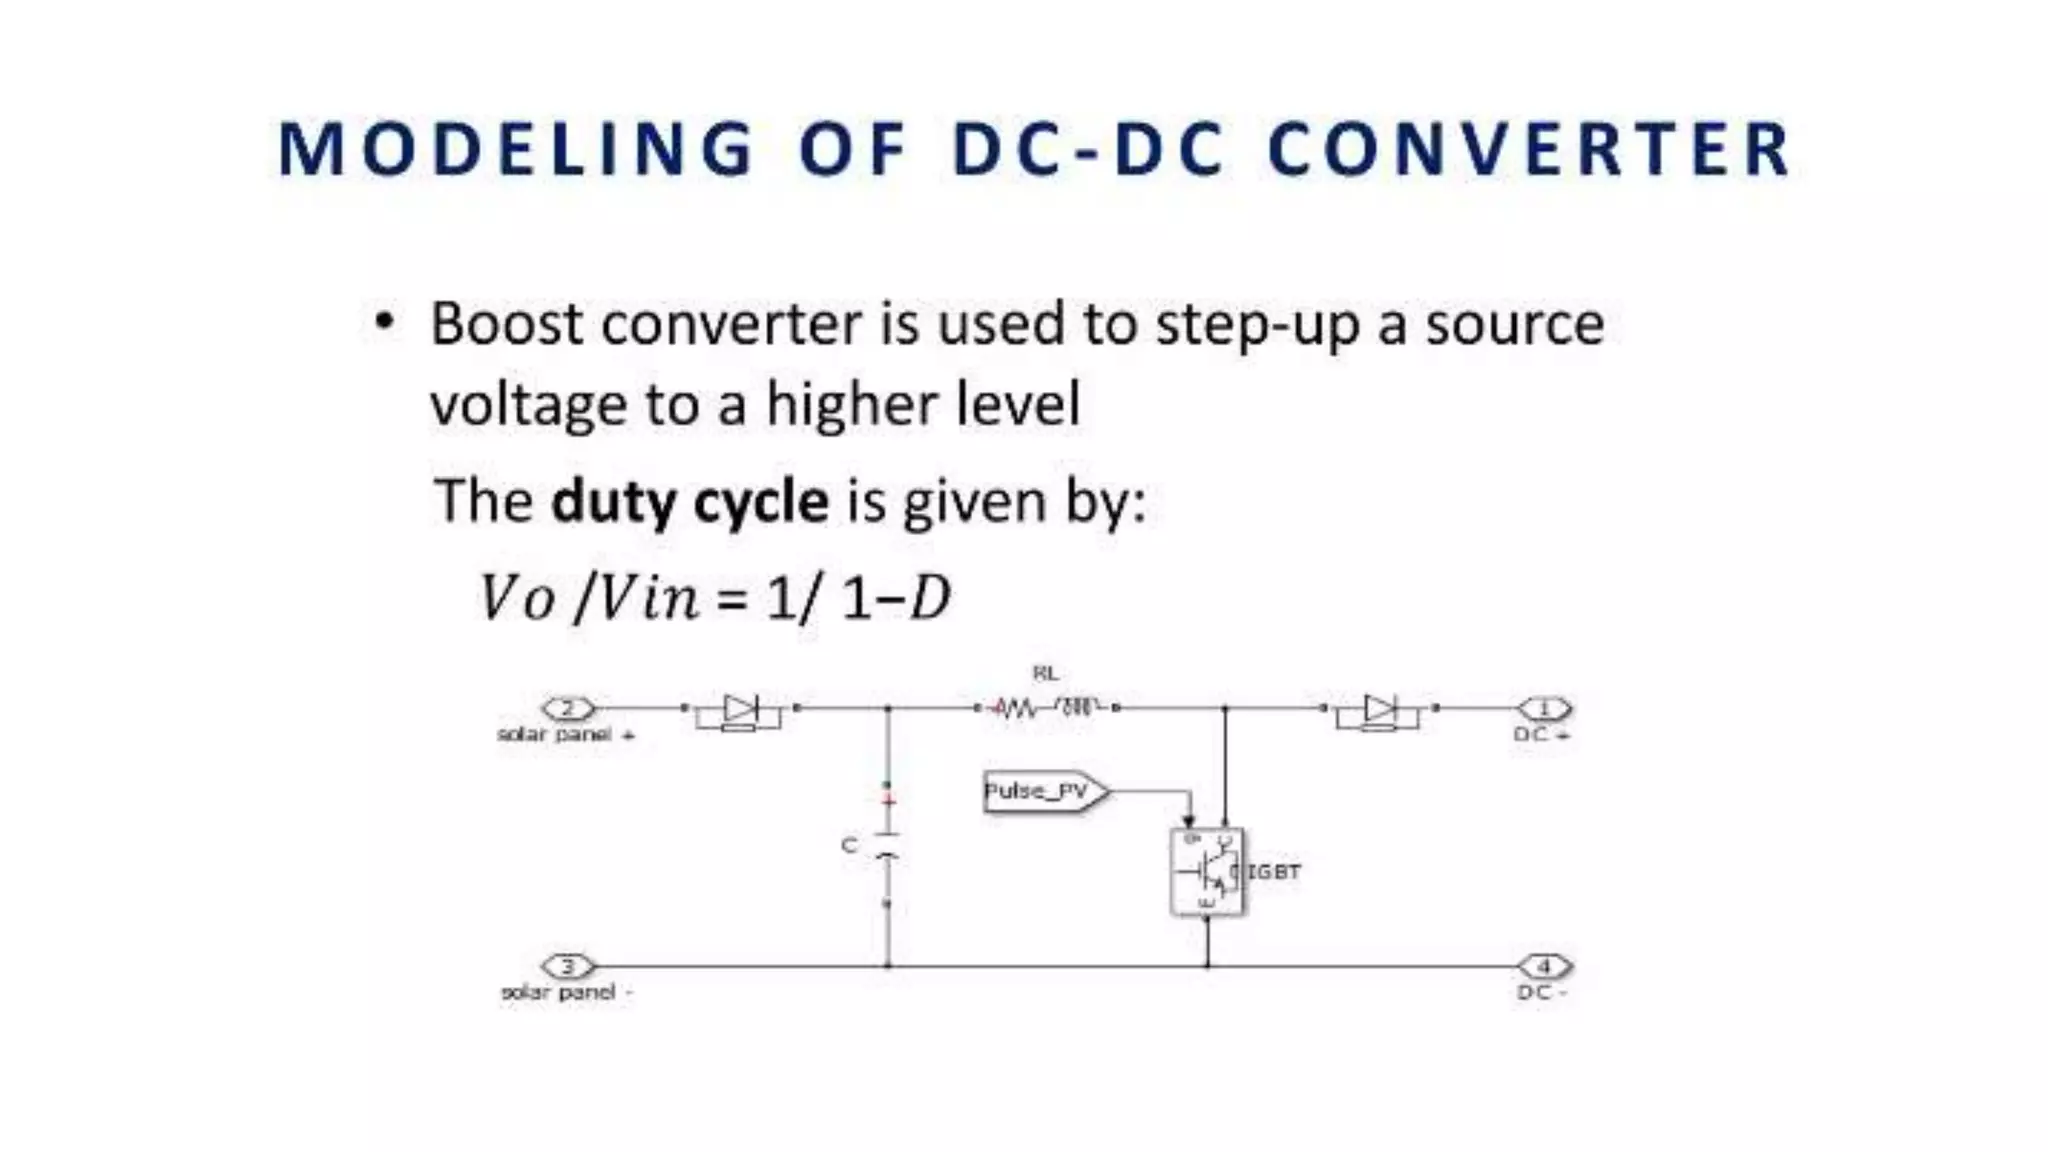
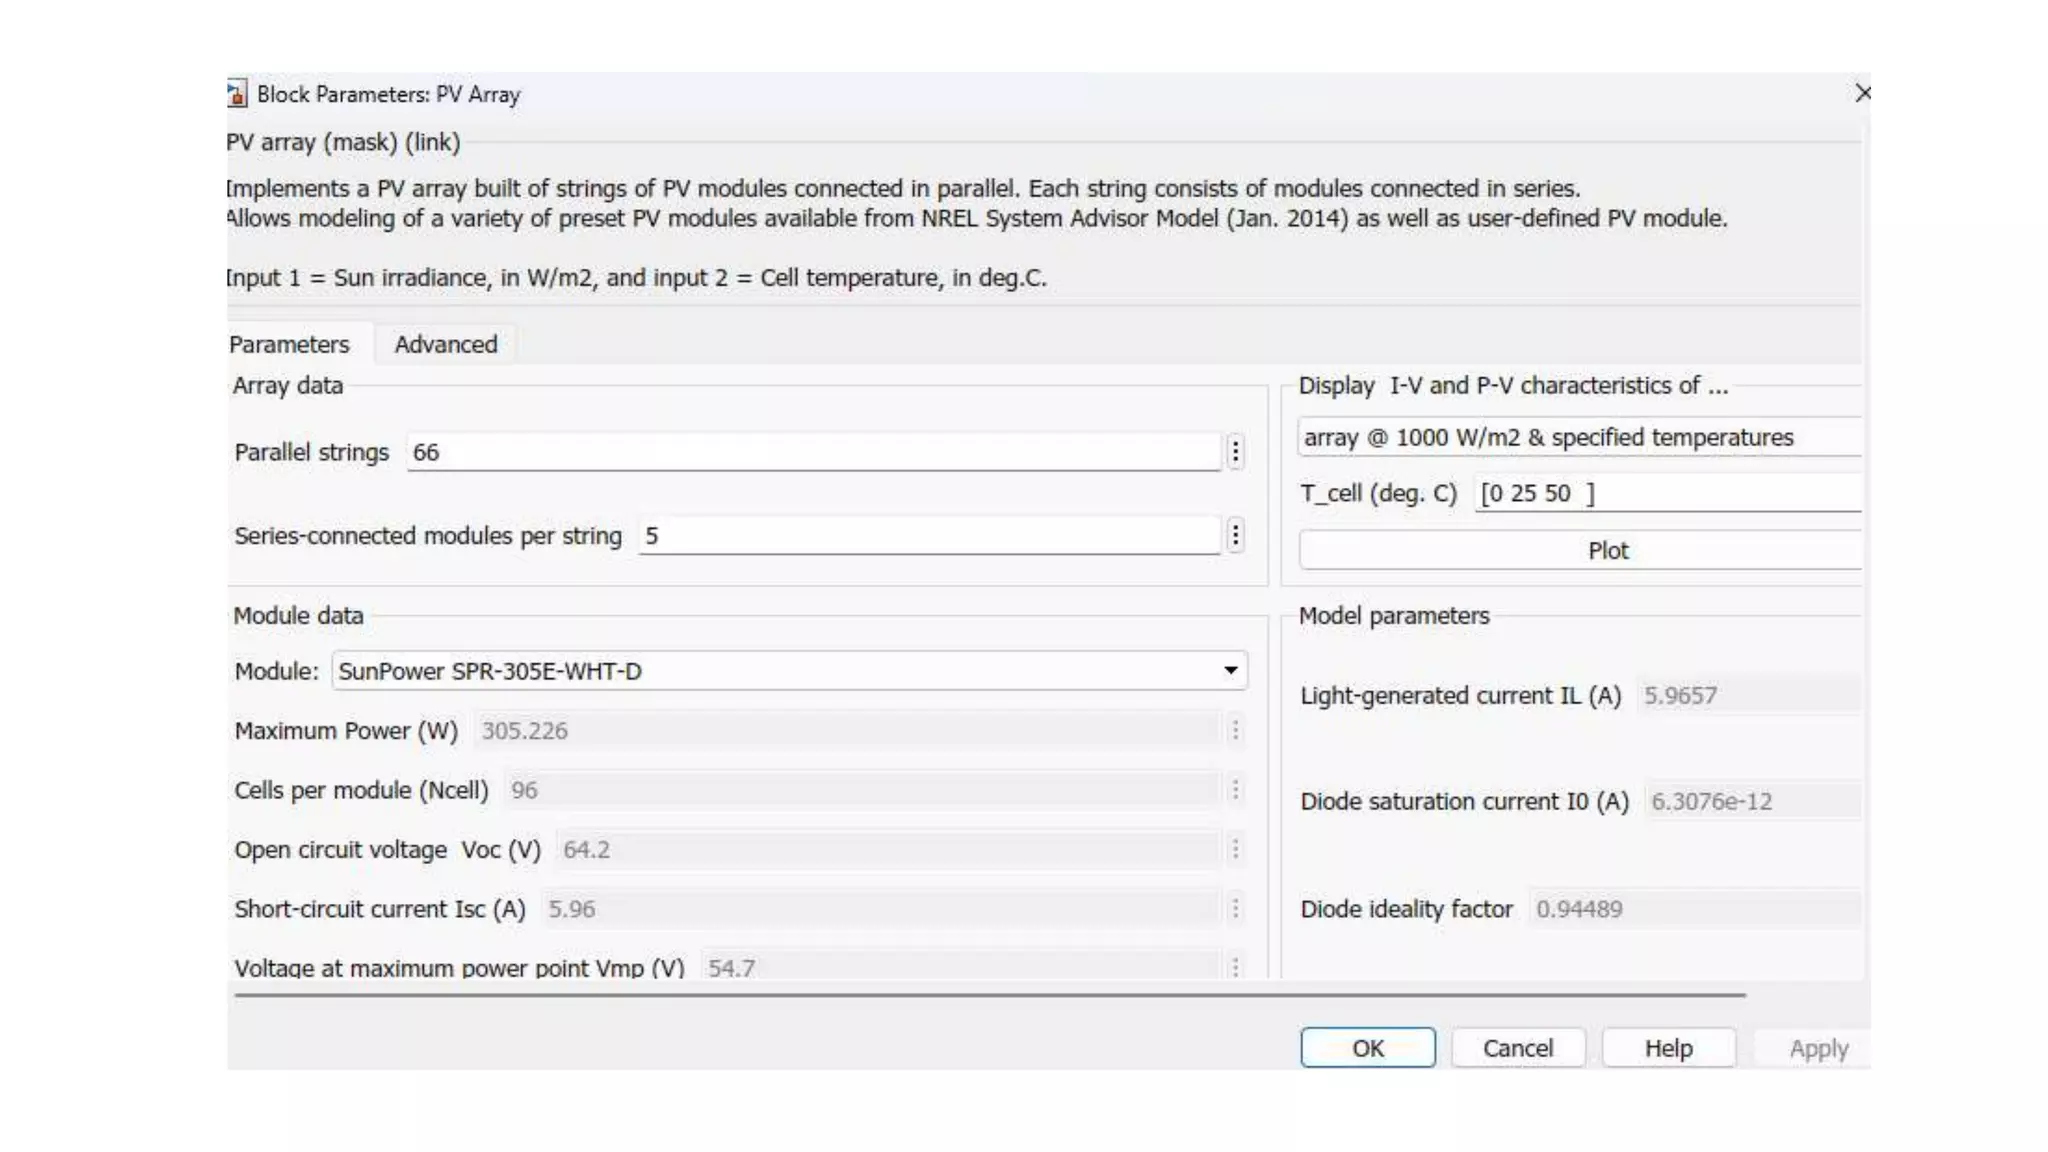
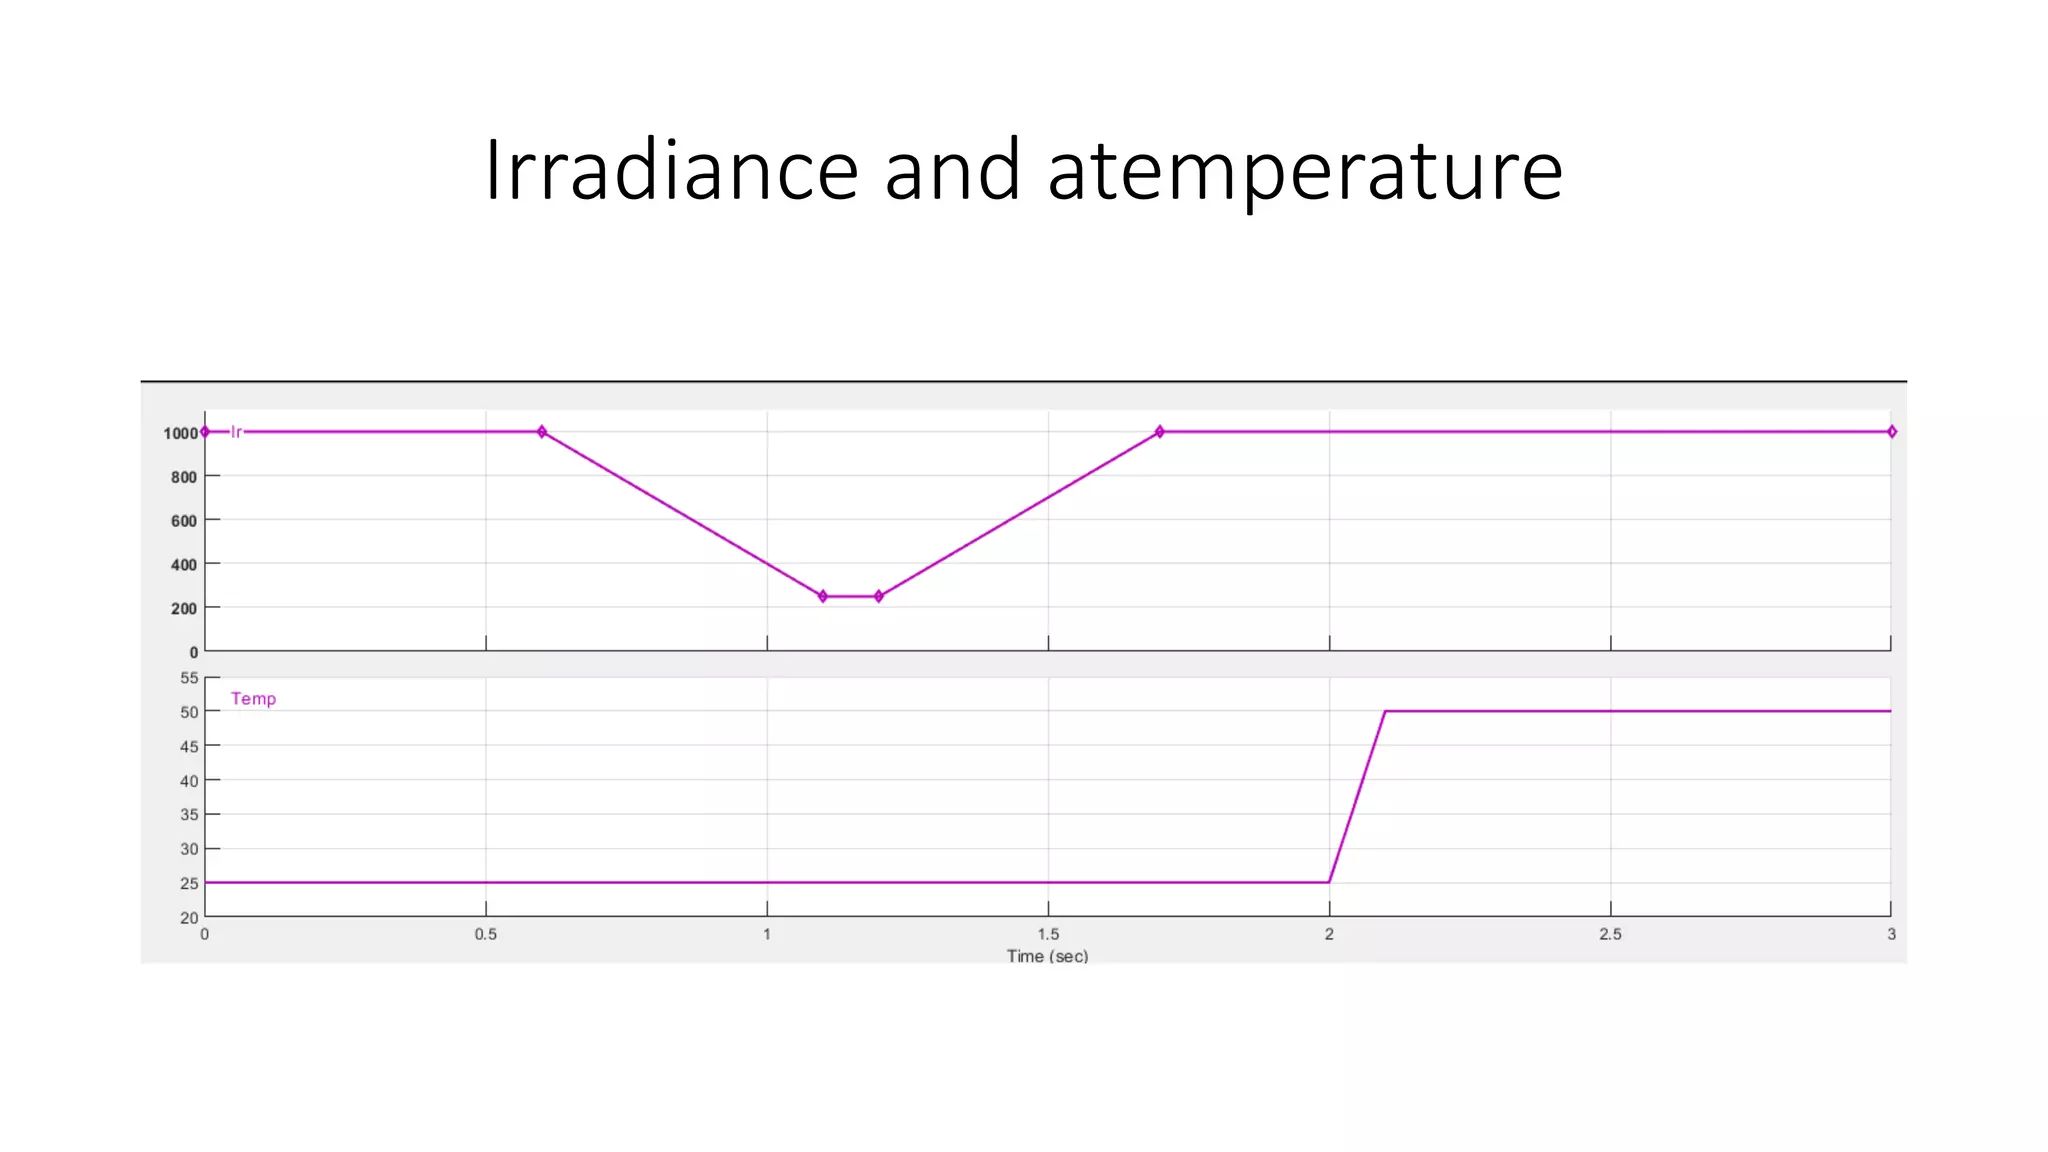
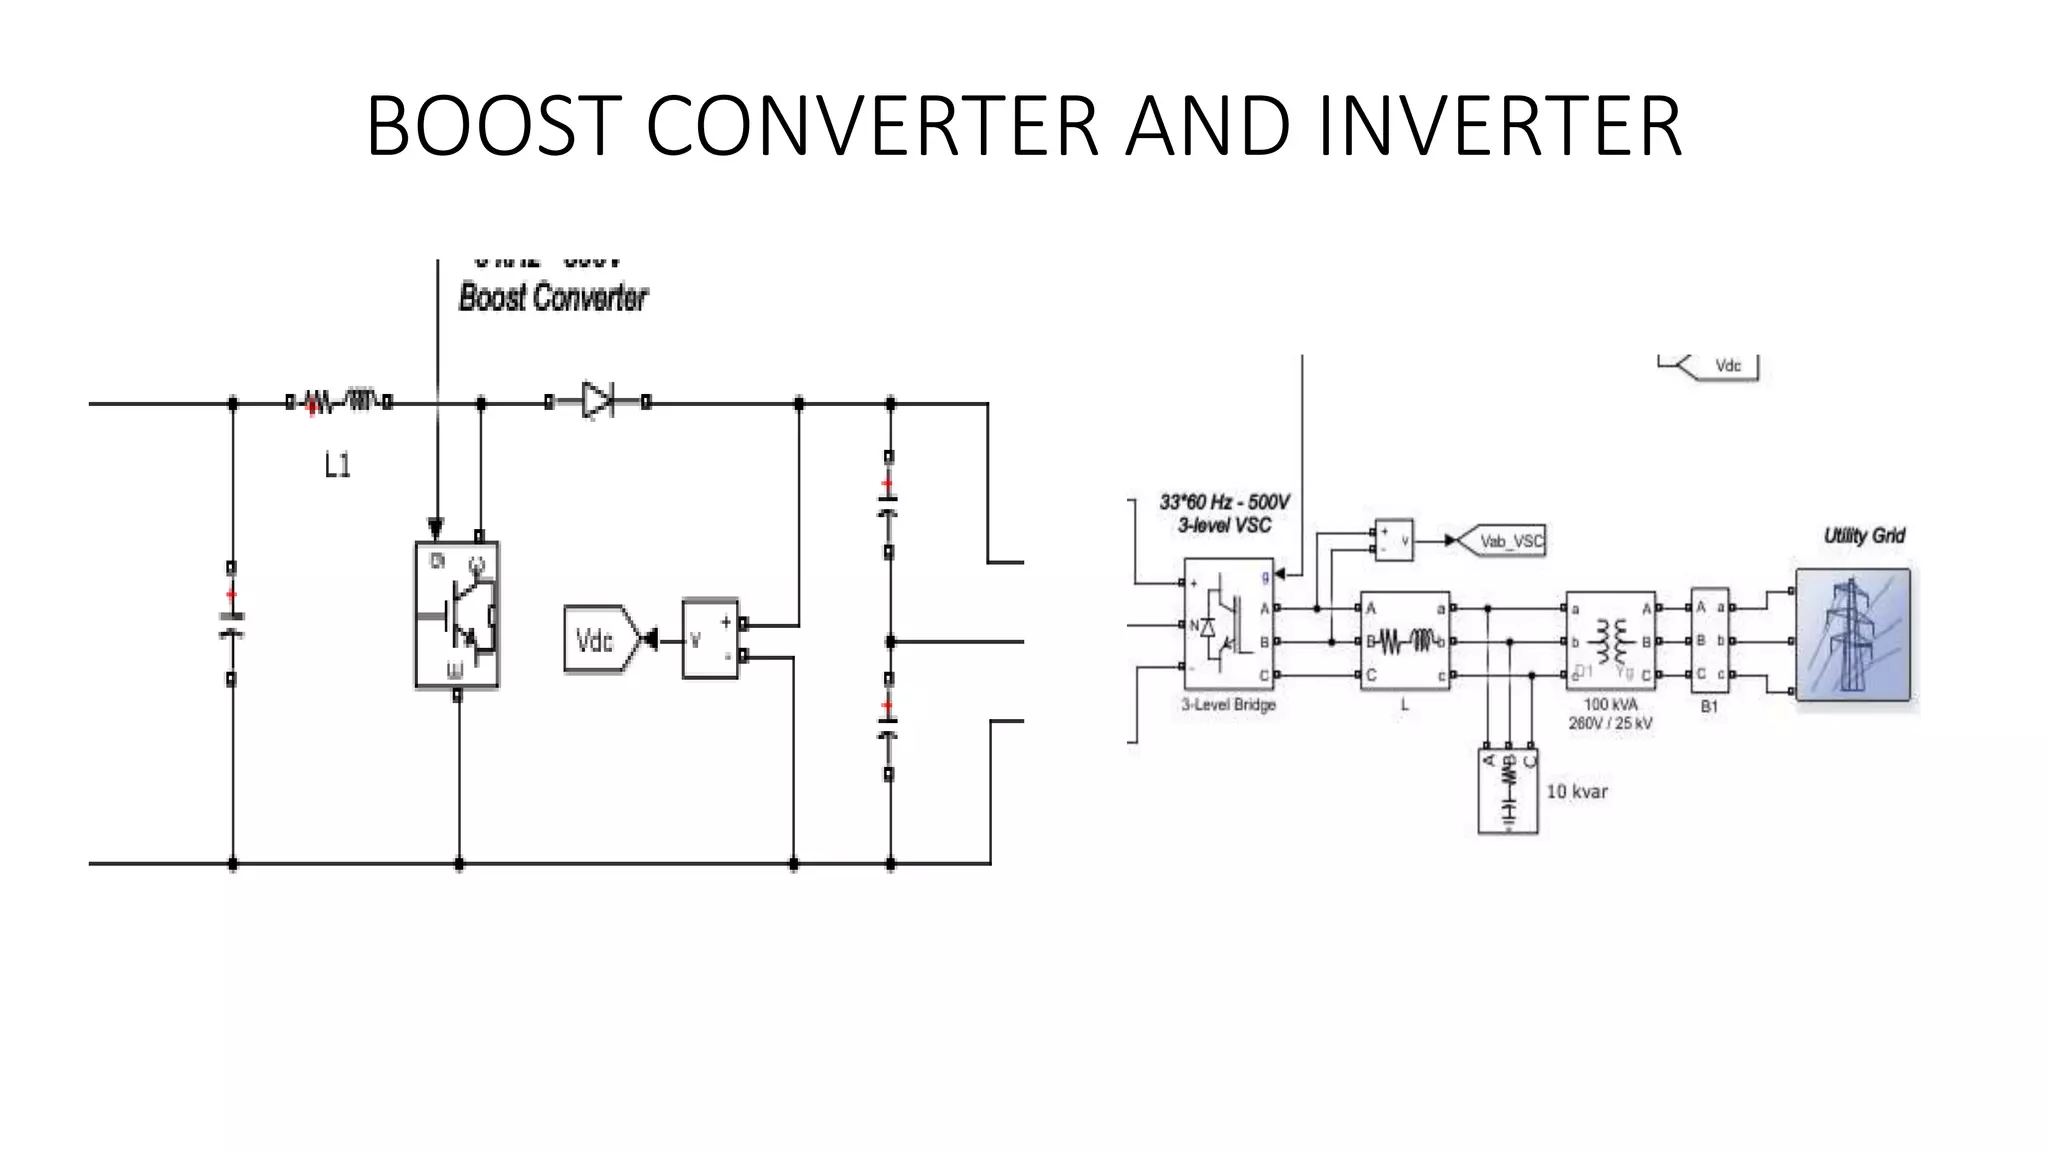
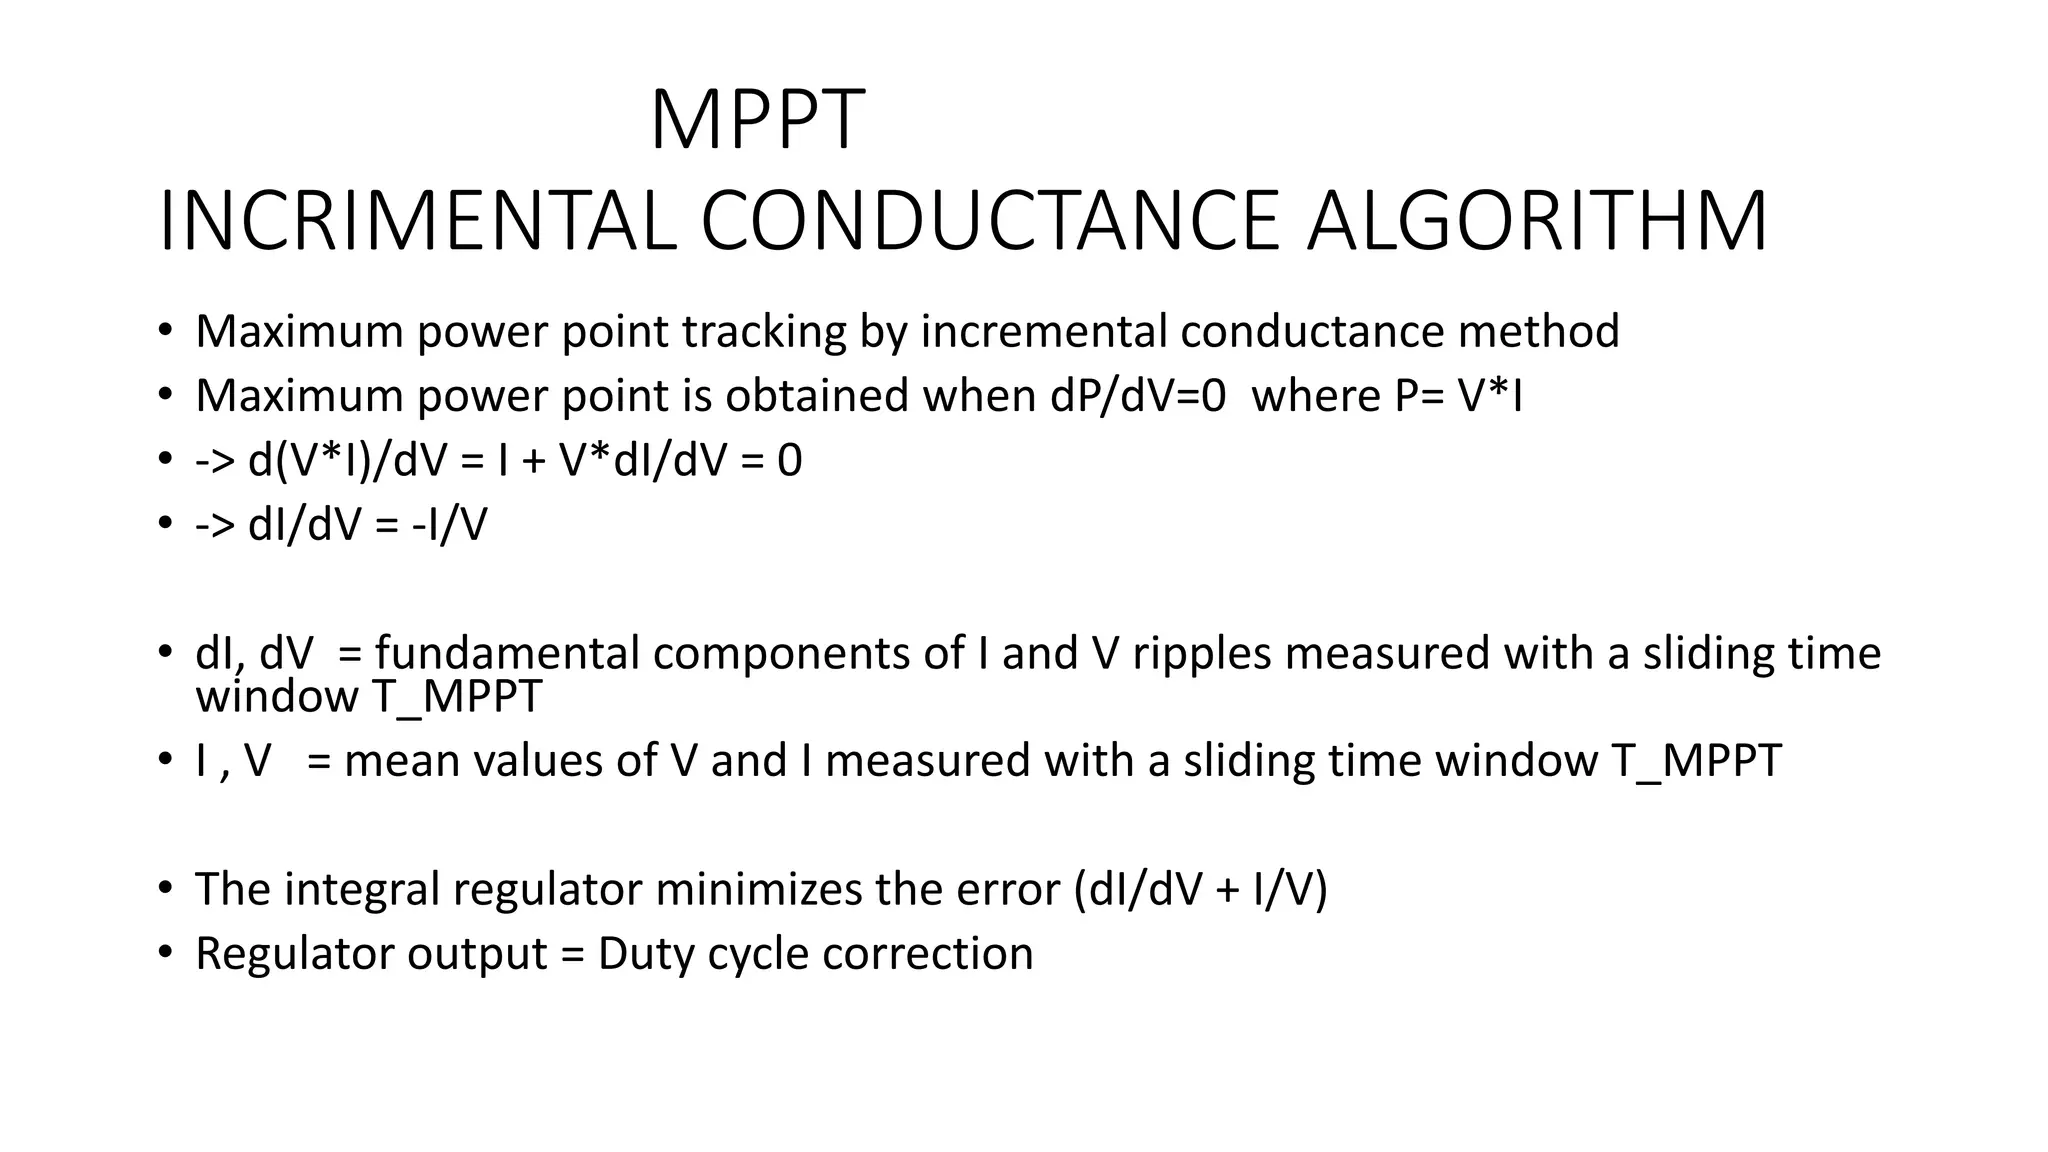
A 100-kW PV array is connected to a 25-kV grid via a DC-DC boost converter and a three-phase three-level Voltage Source Converter (VSC). Maximum Power Point Tracking (MPPT) is implemented in the boost converter by means of a Simulink® model using the 'Incremental Conductance + Integral Regulator' technique.
Another example (see PVArrayGridAverageModel model) uses average models for the DC_DC and VSC converters. In this average model the MPPT controller is based on the 'Perturb and Observe' technique.
13. MPPT
INCRIMENTAL CONDUCTANCE ALGORITHM
• Maximum power point tracking by incremental conductance method
• Maximum power point is obtained when dP/dV=0 where P= V*I
• -> d(V*I)/dV = I + V*dI/dV = 0
• -> dI/dV = -I/V
• dI, dV = fundamental components of I and V ripples measured with a sliding time
window T_MPPT
• I , V = mean values of V and I measured with a sliding time window T_MPPT
• The integral regulator minimizes the error (dI/dV + I/V)
• Regulator output = Duty cycle correction
14.
15. DESCRIPTION
• A 100-kW PV array is connected to a 25-kV grid via a DC-DC boost converter
and a three-phase three-level Voltage Source Converter (VSC). Maximum
Power Point Tracking (MPPT) is implemented in the boost converter by
means of a Simulink® model using the 'Incremental Conductance + Integral
Regulator' technique.
• Another example (see power_PVarray_grid_avg model) uses average models
for the DC_DC and VSC converters. In this average model the MPPT
controller is based on the 'Perturb and Observe' technique.
16. • PV array delivering a maximum of 100 kW at 1000 W/m^2 sun irradiance.
• 5-kHz DC-DC boost converter increasing voltage from PV natural voltage
(273 V DC at maximum power) to 500 V DC. Switching duty cycle is optimized
by a MPPT controller that uses the 'Incremental Conductance + Integral
Regulator' technique. This MPPT system automatically varies the duty cycle in
order to generate the required voltage to extract maximum power.
17. • 1980-Hz 3-level 3-phase VSC. The VSC converts the 500 V DC link voltage to 260 V AC
and keeps unity power factor. The VSC control system uses two control loops: an external
control loop which regulates DC link voltage to +/- 250 V and an internal control loop which
regulates Id and Iq grid currents (active and reactive current components). Id current
reference is the output of the DC voltage external controller. Iq current reference is set to
zero in order to maintain unity power factor. Vd and Vq voltage outputs of the current
controller are converted to three modulating signals Uabc_ref used by the PWM Generator.
The control system uses a sample time of 100 microseconds for voltage and current
controllers as well as for the PLL synchronization unit. Pulse generators of Boost and VSC
converters use a fast sample time of 1 microsecond in order to get an appropriate
resolution of PWM waveforms.
• 10-kvar capacitor bank filtering harmonics produced by VSC.
• 100-kVA 260V/25kV three-phase coupling transformer.
• Utility grid (25-kV distribution feeder + 120 kV equivalent transmission system).
18. PANEL DETAILS
• The manufacturer specifications for one module are:
• Number of series-connected cells : 96
• Open-circuit voltage: Voc= 64.2 V
• Short-circuit current: Isc = 5.96 A
• Voltage and current at maximum power : Vmp =54.7 V, Imp= 5.58 A
• The PV array block menu allows you to plot the I-V and P-V characteristics for one
module and for the whole array.
• The PV array block has two inputs that allow you varying sun irradiance (input 1 in
W/m^2) and temperature (input 2 in degrees C). The irradiance and temperature
profiles are defined by a Signal Builder block which is connected to the PV array
inputs.
19. Simulation
MODE-I
• From t=0 sec to t= 0.05 sec, pulses to Boost and VSC converters are blocked. PV voltage
corresponds to open-circuit voltage (Nser*Voc=5*64.2=321 V, see Vmean trace on PV
scope). The three-level bridge operates as a diode rectifier and DC link capacitors are
charged above 500 V (see Vmean trace on VSC scope ).
• MODE-II
At t=0.05 sec, Boost and VSC converters are de-blocked. DC link voltage is regulated
at Vdc=500V. Duty cycle of boost converter is fixed (D= 0.5 as shown on PV scope).
20. Simulation
• MODE-III
Steady state is reached at t=0.25 sec. Resulting PV voltage is therefore V_PV = (1-D)*Vdc=
(1-0.5)*500=250 V (see Vmean trace on PV scope). The PV array output power is 96 kW
(see Pmean trace on PV scope) whereas specified maximum power with a 1000 W/m^2
irradiance is 100.7 kW. Observe on Scope Grid that phase A voltage and current at 25 kV
bus are in phase (unity power factor).
MODE-IV
At t=0.4 sec MPPT is enabled. The MPPT regulator starts regulating PV voltage by
varying duty cycle in order to extract maximum power. Maximum power (100.4 kW)
is obtained when duty cycle is D=0.454.
21. Simulation
• At t=0.6 sec, PV array mean voltage =274 V as expected from PV module
specifications (Nser*Vmp=5*54.7= 273.5 V).
• From t=0.6 sec to t=1.1 sec, sun irradiance is ramped down from 1000 W/m^2
to 250 W/m^2. MPPT continues tracking maximum power.
22. Simulation
• At t=1.2 sec when irradiance has decreased to 250 W/m^2, duty cycle is D=0.461.
Corresponding PV voltage and power are Vmean= 268 V and Pmean=24.3 kW. Note that
the MMPT continues tracking maximum power during this fast irrdadiance change.
• From t=1.2 sec to t=2.5 sec sun irradiance is restored back to 1000 W/m^2 and then
temperature is increased to 50 degrees C. in order to observe impact of temperature
increase. Note that when temperature increases from 25 degrees C to 50 degrees C, the
array output power decreases from 100.7 kW to 93 kW.