1. In lean environments, information radiators are known as visual controls.
Visual controls illustrate processes to easily compare actual against expected
performance. Visual controls show a process using visual cues. Visual
controls can be present for all levels of information from business value
delivered to tasks that have started. They should be highly visible for anyone
to see.
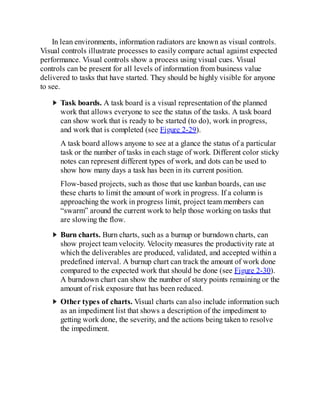
Task boards. A task board is a visual representation of the planned
work that allows everyone to see the status of the tasks. A task board
can show work that is ready to be started (to do), work in progress,
and work that is completed (see Figure 2-29).
A task board allows anyone to see at a glance the status of a particular
task or the number of tasks in each stage of work. Different color sticky
notes can represent different types of work, and dots can be used to
show how many days a task has been in its current position.
Flow-based projects, such as those that use kanban boards, can use
these charts to limit the amount of work in progress. If a column is
approaching the work in progress limit, project team members can
“swarm” around the current work to help those working on tasks that
are slowing the flow.
Burn charts. Burn charts, such as a burnup or burndown charts, can
show project team velocity. Velocity measures the productivity rate at
which the deliverables are produced, validated, and accepted within a
predefined interval. A burnup chart can track the amount of work done
compared to the expected work that should be done (see Figure 2-30).
A burndown chart can show the number of story points remaining or the
amount of risk exposure that has been reduced.
Other types of charts. Visual charts can also include information such
as an impediment list that shows a description of the impediment to
getting work done, the severity, and the actions being taken to resolve
the impediment.
2.
3. Figure 2-29. Task Board or Kanban Board
Figure 2-30. Burnup Chart
2.7.4 MEASUREMENT PITFALLS
Project measures help the project team meet the project objectives.
However, there are some pitfalls associated with measurement. Awareness of
these pitfalls can help minimize their negative effect.
Hawthorne effect. The Hawthorne effect states that the very act of
measuring something influences behavior. Therefore, take care in
establishing metrics. For example, measuring only a project team's
output of deliverables can encourage the project team to focus on
creating a large volume of deliverables rather than focusing on
deliverables that would provide higher customer satisfaction.
Vanity metric. A vanity metric is a measure that shows data but does
not provide useful information for making decisions. Measuring
pageviews of a website is not as useful as measuring the number of
new viewers.
4. Demoralization. If measures and goals are set that are not achievable,
project team morale may fall as they continuously fail to meet targets.
Setting stretch goals and aspirational measures is acceptable, but
people also want to see their hard work recognized. Unrealistic or
unachievable goals can be counterproductive.
Misusing the metrics. Regardless of the metrics used to measure
performance, there is the opportunity for people to distort the
measurements or focus on the wrong thing. Examples include:
Focusing on less important metrics rather than the metrics that matter
most,
Focusing on performing well for the short-term measures at the
expense of long-term metrics, and
Working on out-of-sequence activities that are easy to accomplish in
order to improve performance indicators.
Confirmation bias. As human beings, we tend to look for and see
information that supports our preexisting point of view. This can lead
us to false interpretations of data.
Correlation versus causation. A common mistake in interpreting
measurement data is confusing the correlation of two variables with the
idea that one causes the other. For example, seeing projects that are
behind schedule and over budget might infer that projects that are over
budget cause schedule issues. This is not true, nor is it true that
projects that are behind schedule cause budget overruns. Instead, there
are likely other correlating factors that are not being considered, such
as skill in estimating, the ability to manage change, and actively
managing risk.
Being aware of the pitfalls associated with metrics can help with
establishing effective metrics in addition to being vigilant regarding the
dangers associated with inappropriate measures.
2.7.5 TROUBLESHOOTING PERFORMANCE
5. Part of measurement is having agreed to plans for measures that are
outside the threshold ranges. Thresholds can be established for a variety of
metrics such as schedule, budget, velocity, and other project-specific
measures. The degree of variance will depend on stakeholder risk tolerances.
Figure 2-31 shows an example of a budget threshold set at +10% (orange)
and -20% (green) of the predicted spend rate. The blue line is tracking the
actual spend, and in January, it exceeded the +10% upper tolerance that
would trigger the exception plan.
Figure 2-31. Planned and Actual Spend Rates
Ideally, project teams should not wait until a threshold has been breached
before taking action. If a breach can be forecasted via a trend or new
information, the project team can be proactive in addressing the expected
variance.
An exception plan is an agreed-upon set of actions to be taken if a
threshold is crossed or forecast. Exception plans do not have to be formal;
they can be as simple as calling a stakeholder meeting to discuss the matter.
The importance of the exception plan is to discuss the issue and develop a
6. plan for what needs to be done. Then follow through to make sure the plan is
implemented and determine if the plan is working.
2.7.6 GROWING AND IMPROVING
The intent in measuring and displaying data is to learn and improve. To
optimize project performance and efficiency, only measure and report
information that will:
Allow the project team to learn,
Facilitate a decision,
Improve some aspect of the product or project performance,
Help avoid an issue, and
Prevent performance deterioration.
Applied appropriately, measurements facilitate the project team's ability
to generate business value and achieve the project objectives and
performance targets.
2.7.7 INTERACTIONS WITH OTHER PERFORMANCE
DOMAINS
The Measurement Performance Domain interacts with the Planning,
Project Work, and Delivery Performance Domains as plans form the basis for
comparing the deliveries to plan. The Measurement Performance Domain can
support the activities that are part of the Planning Performance Domain by
presenting up-to-date information so that lessons learned can reflect favorable
or unfavorable information for updating plans. The Team and Stakeholder
Performance Domains interact as project team members develop the plans
and create the deliverables and deliveries that are measured.
As unpredictable events occur, both positive and negative, they have an
impact on the project performance and therefore on the project measurements
and metrics. Responding to changes caused by uncertain events that have
occurred includes updating measurements that have been impacted due to the
7. change. Activities in the Uncertainty Performance Domain, such as identifying
risks and opportunities, can be initiated based on performance measurements.
Part of the project work is working with the project team and other
stakeholders to establish the metrics, gather the data, analyze the data, make
decisions, and report on project status.
2.7.8 CHECKING RESULTS
Table 2-9 identifies the outcomes from effective application of the
Measurement Performance Domain on the left and ways of checking them on
the right.
Table 2-9. Checking Outcomes—Measurement Performance Domain
2.8 UNCERTAINTY PERFORMANCE DOMAIN
8. Figure 2-32. Uncertainty Performance Domain
Projects exist in environments with varying degrees of uncertainty.
Uncertainty presents threats and opportunities that project teams explore,
assess, and decide how to handle.
The following definitions are relevant to the Uncertainty
Performance Domain:
Uncertainty. A lack of understanding and awareness of issues,
events, paths to follow, or solutions to pursue.
Ambiguity. A state of being unclear, having difficulty in identifying
the cause of events, or having multiple options from which to choose.
Complexity. A characteristic of a program or project or its
environment that is difficult to manage due to human behavior,
system behavior, and ambiguity.
9. Volatility. The possibility for rapid and unpredictable change.
Risk. An uncertain event or condition that, if it occurs, has a positive
or negative effect on one or more project objectives.
Uncertainty in the broadest sense is a state of not knowing or
unpredictability. There are many nuances to uncertainty, such as:
Risk associated with not knowing future events,
Ambiguity associated with not being aware of current or future
conditions, and
Complexity associated with dynamic systems having unpredictable
outcomes.
Successfully navigating uncertainty begins with understanding the larger
environment within which the project is operating. Aspects of the
environment that contribute to project uncertainty include, but are not limited
to:
Economic factors such as volatility in prices, availability of resources,
ability to borrow funds, and inflation/deflation;
Technical considerations such as new or emerging technology,
complexity associated with systems, and interfaces;
Legal or legislative constraints or requirements;
Physical environment as it pertains to safety, weather, and working
conditions;
Ambiguity associated with current or future conditions;
Social and market influences shaped by opinion and media; and,
Political influences, either external or internal to the organization.
This performance domain addresses the various aspects of uncertainty,
implications of uncertainty, such as project risk, as well as options for
navigating the various forms of uncertainty.
10. 2.8.1 GENERAL UNCERTAINTY
Uncertainty is inherent in all projects. For this reason, the effects of any
activity cannot be predicted precisely, and a range of outcomes can occur.
Potential outcomes that benefit the project objectives are known as
opportunities; potential outcomes that have a negative effect on objectives are
called threats. Together, the set of opportunities and threats comprise the set
of project risks. There are several options for responding to uncertainty:
Gather information. Sometimes uncertainty can be reduced by finding
out more information, such as conducting research, engaging experts, or
performing a market analysis. It is also important to recognize when
further information collection and analysis exceed the benefit of having
the additional information.
Prepare for multiple outcomes. In situations where there are only a
few possible outcomes from an area of uncertainty, the project team
can prepare for each of those outcomes. This entails having a primary
solution available, as well as having backup or contingency plans in
case the initial solution is not viable or effective. Where there is a
large set of potential outcomes, the project team can categorize and
assess the potential causes to estimate their likelihood of occurrence.
This allows the project team to identify the most likely potential
outcomes on which to focus.
Set-based design. Multiple designs or alternatives can be investigated
early in the project to reduce uncertainty. This allows the project team
to look at trade-offs, such as time versus cost, quality versus cost, risk
versus schedule, or schedule versus quality. The intention is to explore
options so the project team can learn from working with the various
alternatives. Ineffective or suboptimal alternatives are discarded
throughout the process.
Build in resilience. Resilience is the ability to adapt and respond
quickly to unexpected changes. Resilience applies to both project team
members and organizational processes. If the initial approach to
product design or a prototype is not effective, the project team and the
organization need to be able to learn, adapt, and respond quickly.
11. 2.8.2 AMBIGUITY
There are two categories of ambiguity: conceptual ambiguity and
situational ambiguity. Conceptual ambiguity—the lack of effective
understanding—occurs when people use similar terms or arguments in
different ways. For example, the statement, “The schedule was reported on
track last week,” is not clear. It isn't clear whether the schedule was on track
last week or whether it was reported on last week. In addition, there could be
some question as to what “on track” means. Ambiguity of this type can be
reduced by formally establishing common rules and definitions of terms, such
as what does “on track” mean.
Situational ambiguity surfaces when more than one outcome is possible.
Having multiple options to solve a problem is a form of situational ambiguity.
Solutions for exploration of ambiguity include progressive elaboration,
experimentation, and the use of prototypes.
Progressive elaboration. This is the iterative process of increasing the
level of detail in a project management plan as greater amounts of
information and more accurate estimates become available.
Experiments. A well-designed series of experiments can help identify
cause-and-effect relationships or, at least, can reduce the amount of
ambiguity.
Prototypes. Prototypes can help distinguish the relationships between
different variables.
2.8.3 COMPLEXITY
Complexity is a characteristic of a program, project, or its environment,
which is difficult to manage due to human behavior, system behavior, or
ambiguity. Complexity exists when there are many interconnected influences
that behave and interact in diverse ways. In complex environments, it is not
uncommon to see an aggregation of individual elements leading to unforeseen
or unintended outcomes. The effect of complexity is that there is no way of
making accurate predictions about the likelihood of any potential outcome or
even of knowing what outcomes might emerge. There are numerous ways to
12. work with complexity; some of them are systems-based, some entail
reframing, and others are based on process.
2.8.3.1 Systems-Based
Examples of working with complexity that is systems based include:
Decoupling. Decoupling entails disconnecting parts of the system to
both simplify the system and reduce the number of connected variables.
Determining how a piece of a system works on its own reduces the
overall size of the problem.
Simulation. There may be similar though unrelated scenarios that can
be used to simulate components of a system. A project to build a new
airport that includes an area with shopping and restaurants can learn
about consumer buying habits by seeking out analogous information on
shopping malls and entertainment establishments.
2.8.3.2 Reframing
Examples of working with complexity that entail reframing are:
Diversity. Complex systems require viewing the system from diverse
perspectives. This can include brainstorming with the project team to
open up divergent ways of seeing the system. It can also include
Delphi-like processes to move from divergent to convergent thinking.
Balance. Balancing the type of data used rather than only using
forecasting data or data that report on the past or lagging indicators
provides a broader perspective. This can include using elements
whose variations are likely to counteract each other's potential
negative effects.
2.8.3.3 Process-Based
Examples of working with complexity that is process based include:
Iterate. Build iteratively or incrementally. Add features one at a time.
After each iteration, identify what worked, what did not work,
customer reaction, and what the project team learned.
13. Engage. Build in opportunities to get stakeholder engagement. This
reduces the number of assumptions and builds learning and engagement
into the process.
Fail safe. For elements of a system that are critical, build in
redundancy or elements that can provide a graceful degradation of
functionality in the event of a critical component failure.
2.8.4 VOLATILITY
V
olatility exists in an environment that is subject to rapid and
unpredictable change. V
olatility can occur when there are ongoing fluctuations
in available skill sets or materials. V
olatility usually impacts cost and
schedule. Alternatives analysis and use of cost or schedule reserve address
volatility.
Alternatives analysis. Finding and evaluating alternatives, such as
looking at different ways to meet an objective, such as using a different
mix of skills, resequencing work, or outsourcing work. Alternatives
analysis may include identifying the variables to be considered in
evaluating options, and the relative importance or weight of each
variable.
Reserve. Cost reserve can be used to cover budget overruns due to
price volatility. In some circumstances, schedule reserve can be used
to address delays due to volatility associated with resource
availability.
Effectively navigating uncertainty, ambiguity, complexity, and volatility
improves the ability to anticipate situations, make good decisions, plan, and
solve problems.
2.8.5 RISK
Risks are an aspect of uncertainty. A risk is an uncertain event or
condition that, if it occurs, has a positive or negative effect on one or more
project objectives. Negative risks are called threats, and positive risks are
14. called opportunities. All projects have risks since they are unique
undertakings with varying degrees of uncertainty.
Project team members should proactively identify risks throughout the
project to avoid or minimize the impacts of threats and trigger or maximize
the impacts of opportunities. Both threats and opportunities have a set of
possible response strategies that can be planned for implementation should
the risk occur.
In order to navigate risk effectively, the project team needs to know what
level of risk exposure is acceptable in pursuit of the project objectives. This
is defined by measurable risk thresholds that reflect the risk appetite and
attitude of the organization and project stakeholders. Risk thresholds express
the acceptable variation around an objective that reflects the risk appetite of
the organization and stakeholders. Thresholds are typically stated and
communicated to the project team and reflected in the definitions of risk
impact levels for the project.
Overall Project Risk
Overall project risk is the effect of uncertainty on the project as a
whole, arising from all sources of uncertainty. This includes
individual risks and the exposure to the implications of variation in
project outcome, both positive and negative. Overall risk is often a
function of complexity, ambiguity, and volatility. Responses to
overall project risk are the same as for individual threats and
opportunities, though responses are applied to the overall project
rather than to a specific event. If the overall risk on the project is too
high, the organization may choose to cancel the project.
2.8.5.1 Threats
A threat is an event or condition that, if it occurs, has a negative impact on
one or more objectives. Five alternative strategies may be considered for
dealing with threats, as follows:
15. Avoid. Threat avoidance is when the project team acts to eliminate the
threat or protect the project from its impact.
Escalate. Escalation is appropriate when the project team or the
project sponsor agrees that a threat is outside the scope of the project
or that the proposed response would exceed the project manager's
authority.
Transfer. Transfer involves shifting ownership of a threat to a third
party to manage the risk and to bear the impact if the threat occurs.
Mitigate. In threat mitigation, action is taken to reduce the probability
of occurrence and/or impact of a threat. Early mitigation action is often
more effective than trying to repair the damage after the threat has
occurred.
Accept. Threat acceptance acknowledges the existence of a threat, but
no proactive action is planned. Actively accepting a risk can include
developing a contingency plan that would be triggered if the event
occurred; or it can include passive acceptance, which means doing
nothing.
A response to a specific threat might include multiple strategies. For
example, if the threat cannot be avoided, it may be mitigated to a level at
which it becomes viable to transfer or to accept it.
The goal of implementing threat responses is to reduce the amount of
negative risk. Risks that are accepted sometimes are reduced simply by the
passage of time or because the risk event does not occur. Figure 2-33 shows
how risks are tracked and reduced over time.
16. Figure 2-33. Risk Reduction over Time
2.8.5.2 Opportunities
An opportunity is an event or condition that, if it occurs, has a positive
impact on one or more project objectives. An example of an opportunity
could be a time and materials-based subcontractor who finishes work early,
resulting in lower costs and schedule savings.
Five alternative strategies may be considered for dealing with
opportunities, as follows:
Exploit. A response strategy whereby the project team acts to ensure
that an opportunity occurs.
Escalate. As with threats, this opportunity response strategy is used
when the project team or the project sponsor agrees that an opportunity
17. is outside the scope of the project or that the proposed response would
exceed the project manager's authority.
Share. Opportunity sharing involves allocating ownership of an
opportunity to a third party who is best able to capture the benefit of
that opportunity.
Enhance. In opportunity enhancement, the project team acts to increase
the probability of occurrence or impact of an opportunity. Early
enhancement action is often more effective than trying to improve the
opportunity after it has occurred.
Accept. As with threats, accepting an opportunity acknowledges its
existence but no proactive action is planned.
Once a set of risk responses has been developed, it should be reviewed to
see whether the planned responses have added any secondary risks. The
review should also assess the residual risk that will remain once the response
actions have been carried out. Response planning should be repeated until
residual risk is compatible with the organization's risk appetite.
Taking an economic view of work prioritization allows the team to
prioritize threat avoidance and reduction activities.
Comparing the expected monetary value (EMV) of a risk to the
anticipated return on investment (ROI) of a deliverable or feature
allows the project manager to have conversations with sponsors or
product owners about where and when to incorporate risks
responses into the planned work (see Figure 2-34).
18. Figure 2-34. Risk-Adjusted ROI Curve
2.8.5.3 Management and Contingency Reserve
Reserve is an amount of time or budget set aside to account for handling
risks. Contingency reserve is set aside to address identified risks should they
occur. Management reserve is a budget category used for unknown events
such as unplanned, in-scope work.
2.8.5.4 Risk Review
Establishing a frequent rhythm or cadence of review and feedback
sessions from a broad selection of stakeholders is helpful for navigating
project risk and being proactive with risk responses.
Daily standup meetings can be used in any project and are a source for
identifying potential threats and opportunities. Reports of blockers or
impediments could become threats if they continue to delay progress.
Likewise, reports of progress and breakthroughs might point toward
opportunities to be further leveraged and shared.
19. Frequent demonstrations of increments of the product or service, interim
designs, or proof of concepts can surface threats and opportunities. Negative
feedback from demonstrations or design reviews can be an early indicator of
threats related to dissatisfaction from stakeholders if not corrected. Positive
feedback helps inform the project team regarding the areas of development
highly valued by the business representatives.
Addressing risk at weekly status meetings ensures that risk management
remains relevant. These meetings can be used to identify new risks as well as
identify changes to existing risks.
Retrospectives and lessons learned meetings can be used to identify
threats to performance, project team cohesion, etc., and to seek
improvements. They can also help identify practices to try different ways to
exploit and enhance opportunities.
2.8.6 INTERACTIONS WITH OTHER PERFORMANCE
DOMAINS
The Uncertainty Performance Domain interacts with the Planning, Project
Work, Delivery, and Measurement Performance Domains from the product or
deliverable perspective. As planning is conducted, activities to reduce
uncertainty and risks can be built into the plans. These are carried out in the
Delivery Performance Domain. Measurements can indicate if the risk level is
changing over time.
Project team members and other stakeholders are the main sources of
information regarding uncertainty. They can provide information, suggestions,
and assistance in working with all the various forms of uncertainty.
The choice of life cycle and development approach impact how
uncertainty will be addressed. On a predictive project where the scope is
relatively stable, reserve in the schedule and budget can be used to respond to
risks. On a project using an adaptive approach where the requirements are
likely to evolve and where there may be ambiguity around how systems will
interact or how stakeholders will react, the project team can adjust plans to
reflect evolving understanding or use reserves to offset the impacts of
realized risks.
20. 2.8.7 CHECKING RESULTS
Table 2-10 identifies the outcomes on the left and ways of checking them
on the right.
Table 2-10. Checking Outcomes—Uncertainty Performance Domain
2 This topic is about planning for the project team. Topics associated with project team leadership are
addressed in the Team Performance Domain.
3 Quantitative forecasts associated with earned value management are often used for very large
projects. Some deliverables in those projects may use adaptive development methods. However, the
forecasting metrics in earned value management are predominantly used in predictive environments.
21. 3
Tailoring
3.1 OVERVIEW
Tailoring is the deliberate adaptation of the project management
approach, governance, and processes to make them more suitable for the
given environment and the work at hand.
In a project environment, tailoring considers the development approach,
processes, project life cycle, deliverables, and choice of people with whom
to engage. The tailoring process is driven by the guiding project management
principles in The Standard for Project Management [1], organizational
values, and organizational culture. For instance, if a core organizational value
is “customer centricity,” then the activities selected for requirements
elicitation and scope validation favor customer-centered approaches. This
aligns with the principle of “Effectively engage with stakeholders.” Likewise,
an organization with a low appetite for risk may have many processes and
procedures to guide projects throughout their life cycles. A similar company
operating in the same market—but with a high tolerance for risk—may have
fewer processes and procedures. In both of these examples, the organizations
are aligned with the principle of “Optimize risk responses” even though their
appetite, processes, and procedures are different.
Tailoring entails the mindful selection and adjustment of multiple project
factors, regardless of whether the label of “tailoring” is used.
The alternative to tailoring is using an unmodified framework or
methodology. There are many methodologies available that provide
descriptions of processes, phases, methods, artifacts, and templates
22. to be used in projects. These methodologies and their components
are not customized to the organizational context.
Most of these methodologies have clear instructions stating they
should not be applied rigorously but should be subject to a process
of tailoring to determine which elements are most useful given the
particular type, size, and complexity of the project. Some
inexperienced practitioners try to apply the methodology verbatim
without regard to project size, complexity, duration, or
organizational context.
Tailoring involves understanding the project context, goals, and operating
environment. Projects operate in complex environments that need to balance
potentially competing demands that include, but are not limited to:
Delivering as quickly as possible,
Minimizing project costs,
Optimizing the value delivered,
Creating high-quality deliverables and outcomes,
Providing compliance with regulatory standards,
Satisfying diverse stakeholder expectations, and
Adapting to change.
These factors need to be understood, evaluated, and balanced to create a
practical operating environment for the project.
There may be situations that limit the degree to which project teams can
tailor their approach, for example, when organizational policies mandate the
use of a specific approach or a contract specifies a mandated approach.
3.2 WHY TAILOR?
Tailoring is performed to better suit the organization, operating
environment, and project needs. Many variables factor into the tailoring
23. process, including the criticality of the project and the number of stakeholders
involved. Using these variables as an example, it is evident that the rigor,
checks and balances, and reporting required for a critical project (e.g.,
building a nuclear reactor) are much greater than those for building a new
office building.
Likewise, the communication and coordination of work necessary for a
project team of 10 people is insufficient for a project team of 200 people.
Too few processes can omit key activities that support effective project
management, while employing more processes than required is costly and
wasteful. Thus, tailoring facilitates appropriate management for the operating
environment and the project needs.
The structure used to deliver projects can be extensive or minimal,
rigorous or lightweight, robust or simple. There is no single approach that can
be applied to all projects all of the time. Instead, tailoring should reflect the
size, duration, and complexity of each individual project and should be
adapted to the industry, organizational culture, and level of project
management maturity of the organization.
Tailoring produces direct and indirect benefits to organizations. These
include, but are not limited to:
More commitment from project team members who helped to tailor the
approach,
Customer-oriented focus, as the needs of the customer are an important
influencing factor in its development, and
More efficient use of project resources.
3.3 WHAT TO TAILOR
Project aspects that can be tailored include:
Life cycle and development approach selection,
Processes,
Engagement,
24. Tools, and
Methods and artifacts.
Sections 3.3.1 through 3.3.4 explore each of these in more detail.
3.3.1 LIFE CYCLE AND DEVELOPMENT APPROACH
SELECTION
Deciding on a life cycle and the phases of the life cycle is an example of
tailoring. Additional tailoring can be done when selecting the development
and delivery approach for the project. Some large projects may use a
combination of development and delivery approaches simultaneously. For
instance, building a new data center could involve (a) the use of predictive
approaches for the physical building construction and finishing and (b) an
iterative approach for understanding and establishing the computing
capabilities required. Viewed from a project level, this combination of
approaches represents a hybrid approach, but the construction team and the
computing team may only experience a predictive or iterative development
approach.
3.3.2 PROCESSES
Process tailoring for the selected life cycle and development approach
includes determining which portions or elements should be:
Added, to bring required rigor, coverage, or address unique product or
operating environment conditions, etc. (e.g., adding independent
inspections for safety-critical projects);
Modified, to better suit the project or project team requirements (e.g.,
modifying the format of project documents to accommodate project
team members with vision limitations);
Removed, to reduce cost or effort since it is no longer required or is
not economical for the value it adds (e.g., removing the creation of
meeting minutes for a small, colocated project team with good
communications);
25. Blended, to bring additional benefits or value by mixing or combining
elements (e.g., adding appreciative inquiry methods from
organizational management to the lessons learned meetings of
predictive project management to help foster better collaboration); and
Aligned, to harmonize elements so there is consistent definition,
understanding, and application (e.g., many disciplines have standards
and practices associated with risk management that are sufficiently
different from each other that would need to be aligned). For example,
on multidisciplinary project teams, different disciplines may have
specific elements, such as their own language, tools, and practices
related to the same area of focus.
3.3.3 ENGAGEMENT
Tailoring engagement for the people involved in the project includes:
People. This entails evaluating the skills and capabilities of the project
leadership and the project team; then selecting who should be involved
and in what capacities based on the project type and operating
conditions. For example, on a challenging or time-constrained project,
assigning very experienced project team members is more logical than
using inexperienced project team members.
Empowerment. Empowerment involves choosing which
responsibilities and forms of local decision making should be deferred
to the project team. Some environments and team member capabilities
support high levels of empowerment. In other situations, less
empowerment with more supervision and direction might be
preferable.
Integration. Project teams can include contributors from contracted
entities, channel partners, and other external entities in addition to staff
from inside the sponsoring organization. Tailoring considers how to
create one project team from a diverse collection of contributors to
facilitate optimal project team performance and realization of project
outcomes.
26. 3.3.4 TOOLS
Selecting the tools (e.g., software or equipment) the project team will use
for the project is a form of tailoring. Often, the project team has the best
insight into the most suitable tools for the situation, but those choices might
need tempering based on the associated costs. Additionally, organizational
leaders can impose constraints that the project team cannot change.
3.3.5 METHODS AND ARTIFACTS
Tailoring the means that will be used to achieve the project outcomes is
performed so that the methods are suited for the environment and the culture.
Tailoring the documents, templates, and other artifacts that will be used on the
project helps to make sure the artifacts are appropriate for the project and the
organization. Section 4 contains numerous examples of methods and artifacts
that can be considered when tailoring methods and artifacts.
3.4 THE TAILORING PROCESS
As noted in Section 2.5 of The Standard for Project Management [1],
projects exist in environments that may have an influence on them. Prior to
tailoring, the project environment needs to be analyzed and understood.
Tailoring typically begins by selecting a development and delivery approach,
tailoring it for the organization, tailoring it for the project, and then
implementing its ongoing improvement. These steps in the process are shown
in Figure 3-1 and described in more detail in Sections 3.4.1 through 3.4.4 of
this guide.
27. Figure 3-1. Details of the Steps in the Tailoring Process
3.4.1 SELECT INITIAL DEVELOPMENT APPROACH
This step determines the development approach that will be used for the
project. Project teams apply their knowledge of the product, delivery
cadence, and awareness of the available options to select the most
appropriate development approach for the situation. Selecting the initial
approach is depicted in Figure 3-2.
Figure 3-2. Selecting the Initial Development Approach
28. A suitability filter tool helps project teams consider whether a project has
characteristics that lend themselves toward a predictive, hybrid, or adaptive
approach. The suitability filter is an informational tool that combines its
assessment with other data and decision-making activities so that the tailored
approach is appropriate for each project. By evaluating criteria based on
culture, project team, and project factors, a suitability filter generates a
diagnostic visual that can be helpful in discussing and deciding on the initial
approach.
3.4.2 TAILOR FOR THE ORGANIZATION
While project teams own and improve their processes, organizations often
require some level of approval and oversight. Many organizations have a
project methodology, general management approach, or general development
approach that is used as a starting point for their projects. These guides are
intended to support such things as repeatable processes, consistent measures
of the organization's project capabilities, and continuous improvement of
those capabilities. Organizations that have established process governance
need to ensure tailoring is aligned to policy. To demonstrate that the project
team's tailoring decisions do not threaten the organization's larger strategic or
stewardship goals, project teams may need to justify using a tailored
approach.
Additional constraints for tailoring for the organization include large,
safety-critical projects and projects performed under contract. Large, safety-
critical project tailoring suggestions may require additional oversight and
approval to help prevent errors, loss, or subsequent issues. Projects that are
performed under contract may have contract terms that specify the use of a
particular life cycle, delivery approach, or methodology.
The tailoring process shown in Figure 3-3 uses factors such as project
size, criticality, organizational maturity, and other considerations.
29. Figure 3-3. Tailoring the Approach for the Organization
Tailoring for the organization involves adding, removing, and
reconfiguring elements of the approach to make it more suitable for the
individual organization. This process is shown in Figure 3-4.
Figure 3-4. Assessing the Organizational and Project Factors When Tailoring
Organizations with a project management office (PMO) or value delivery
office (VDO) may play a role in reviewing and approving tailored delivery
approaches.
Tailoring that only impacts the project team (e.g., when they hold internal
meetings, who works where, etc.) requires less oversight than tailoring that
30. impacts external groups (e.g., how and when other departments are engaged,
etc.). Therefore, internal project tailoring might be approved by the project
manager while tailoring changes that impact external groups may require
approval by the PMO or VDO. The PMO or VDO can assist project teams as
they tailor their approaches by providing ideas and solutions from other
project teams.
A VDO may be found in organizations that use more adaptive
delivery approaches. The VDO serves an enabling role, rather than a
management or oversight function. It focuses on coaching project
teams; building adaptive skills and capabilities throughout the
organization; and mentoring sponsors and product owners to be more
effective in those roles.
3.4.3 TAILOR FOR THE PROJECT
Many attributes influence tailoring for the project. These include, but are
not limited to:
Product/deliverable,
Project team, and
Culture.
The project team should ask questions about each attribute to help guide
them in the tailoring process. Answers to these questions can help identify the
need to tailor processes, delivery approach, life cycle, tools, methods, and
artifacts.
3.4.3.1 Product/Deliverable
Attributes associated with the product or deliverable include, but are not
limited to:
Compliance/criticality. How much process rigor and quality assurance
is appropriate?
31. Type of product/deliverable. Is the product well known and physical,
for example, something easy to recognize and describe like a building?
Or something intangible like software or the design of a new drug?
Industry market. What market does the project, product, or
deliverable serve? Is that market highly regulated, fast moving, or slow
to evolve? What about competitors and incumbents?
Technology. Is the technology stable and well established or rapidly
evolving and at risk of obsolescence?
Time frame. Is the project time frame short as in weeks or months, or
long as in several years?
Stability of requirements. How likely are there to be changes to core
requirements?
Security. Are elements of the product business confidential or
classified?
Incremental delivery. Is this something the project team can develop
and get stakeholder feedback on incrementally, or something that is
hard to evaluate until near completion?
3.4.3.2 Project Team
Project team considerations include:
Project team size. How many full-time and part-time people will be
working on the project?
Project team geography. Where are the team members predominantly
located geographically? Will some or all of the team be remote or
colocated?
Organizational distribution. Where are the team's supporting groups
and other stakeholders located?
Project team experience. Do the project team members have any
experience in the industry, in the organization, or working with each
other? Do they have the skills, tools, and technology required for the
project under consideration?
32. Access to customer. Is it practical to get frequent and timely feedback
from customers or customer representatives?
3.4.3.3 Culture
Evaluating the culture includes considerations regarding:
Buy-in. Is there acceptance, support, and enthusiasm for the proposed
delivery approach?
Trust. Are there high levels of trust that the project team is capable of
and committed to delivering the project outcomes?
Empowerment. Is the project team trusted, supported, and encouraged
to own and develop its working environment, agreements, and
decisions?
Organizational culture. Do the organizational values and culture align
with the project approach? This includes empowering versus
specifying and checking, trusting local decision making versus
requesting external decision making, etc.
Through the evaluation of these attributes, tailoring decisions around
engagement, process, and tools can be made for the project. These removals
and additions are depicted in Figure 3-5 with an “X” for removals and dotted
boxes for the addition of trial processes
Figure 3-5. Tailoring the Approach for the Project
33. 3.4.3.4 Implement Ongoing Improvement
The process of tailoring is not a single, one-time exercise. During
progressive elaboration, issues with how the project team is working, how
the product or deliverable is evolving, and other learnings will indicate
where further tailoring could bring improvements. Review points, phase
gates, and retrospectives all provide opportunities to inspect and adapt the
process, development approach, and delivery frequency as necessary.
Keeping the project team engaged with improving its process can foster
pride of ownership and demonstrate a commitment to implement ongoing
improvements and quality. Engaging the project team to find and implement
improvements also demonstrates trust in their skills and suggestions along
with empowerment. Project team engagement with tailoring demonstrates a
mindset of innovation and improvement rather than settling for the status quo.
The concept of adding, removing, and changing processes is shown in
Figure 3-6.
Figure 3-6. Implement Ongoing Improvement
How organizations tailor can itself be tailored. However, most
organizations undertake some or all of the four steps described. They use
elements of selecting an initial approach, tailoring for the organization,
tailoring for the project, and implementing ongoing improvement as shown in
Figure 3-7.
34. Figure 3-7. The Tailoring Process
3.5 TAILORING THE PERFORMANCE
DOMAINS
The work associated with each performance domain can also be tailored,
based on the uniqueness of the project. As shown in Figure 3-8, the principles
for project management provide guidance for the behavior of project
practitioners as they tailor the performance domains to meet the unique needs
of the project context and the environment.
35.
36. Figure 3-8. Tailoring to Fit the Project Context
Some tailoring considerations related to each of the performance domains
include, but are not limited to:
3.5.1 STAKEHOLDERS
Is there a collaborative environment for stakeholders and suppliers?
Are the stakeholders internal or external to the organization, or both?
What technologies are most appropriate and cost effective for
communicating to stakeholders? What communication technology is
available?
Is one language used with stakeholders? Have allowances been made
to adjust to stakeholders from diverse language groups?
How many stakeholders are there? How diverse is the culture within
the stakeholder community?
What are the relationships within the stakeholder community? The
more networks in which a stakeholder or stakeholder group
participates, the more complex the networks of information and
misinformation the stakeholder may receive.
3.5.2 PROJECT TEAM
What is the physical location of project team members? Is the project
team colocated? Is the project team in the same geographical area? Is
the project team distributed across multiple time zones?
Does the project team reflect diverse viewpoints and cultural
perspectives?
How will project team members be identified for the project? Are
project team members full time or part time on the project? Are there
available contractors capable of performing the work?
37. Does the project team have an established culture? How will tailoring
be influenced by the existing culture, and how will the existing culture
be influenced by tailoring?
How is project team development managed for the project? Are there
organizational tools to manage project team development or will new
ones need to be established?
Are there project team members who have special needs? Will the
project team need special training to manage diversity?
3.5.3 DEVELOPMENT APPROACH AND LIFE CYCLE
Which development approach is appropriate for the product, service,
or result? If adaptive, should the project be developed incrementally or
iteratively? Is a hybrid approach best?
What is an appropriate life cycle for this specific project? What phases
should comprise the project life cycle?
Does the organization have formal or informal audit and governance
policies, procedures, and guidelines?
3.5.4 PLANNING
How might internal and external environmental factors influence the
project and its deliverable?
What are the factors influencing durations (such as the correlation
between available resources and their productivity)?
Does the organization have formal or informal policies, procedures,
and guidelines related to cost estimating and budgeting?
How does the organization estimate cost when using adaptive
approaches?
Is there one main procurement or are there multiple procurements at
different times with different sellers that add to the complexity of the
procurement processes?
38. Are local laws and regulations regarding procurement activities
integrated with the organization's procurement policies? How does this
affect contract auditing requirements?
3.5.5 PROJECT WORK
What management processes are most effective based on the
organizational culture, complexity, and other project factors?
How will knowledge be managed in the project to foster a
collaborative working environment?
What information should be collected throughout and at the end of the
project? How will the information be collected and managed? What
technology is available to develop, record, transmit, retrieve, track,
and store information and artifacts?
Will historical information and lessons learned be made available to
future projects?
Does the organization have a formal knowledge management repository
that a project team is required to use, and is it readily accessible?
3.5.6 DELIVERY
Does the organization have formal or informal requirements
management systems?
Does the organization have existing formal or informal validation and
control-related policies, procedures, and guidelines?
What quality policies and procedures exist in the organization? What
quality tools, techniques, and templates are used in the organization?
Are there any specific quality standards in the industry that need to be
applied? Are there any specific governmental, legal, or regulatory
constraints that need to be taken into consideration?
Are there areas of the project with unstable requirements? If so, what
is the best approach for addressing the unstable requirements?
39. How does sustainability factor into the elements of project management
or product development?
3.5.7 UNCERTAINTY
What is the risk appetite and risk tolerance for this endeavor?
How are threats and opportunities best identified and addressed within
the selected development approach?
How will the presence of project complexity, technological
uncertainty, product novelty, cadence, or progress tracking impact the
project?
Does the project's size in terms of budget, duration, scope, or project
team size require a more detailed approach to risk management? Or is
the project small enough to justify a simplified risk management
process?
Is a robust risk management approach demanded by high levels of
innovation, new technology, commercial arrangements, interfaces, or
other external dependencies? Or is the project simple enough that a
reduced risk management process will suffice?
How strategically important is the project? Is the level of risk
increased for this project because it aims to produce breakthrough
opportunities, addresses significant blocks to organizational
performance, or involves major product innovation?
3.5.8 MEASUREMENT
How is value measured?
Are there measures for financial value and nonfinancial value?
How will the project enable data capture and reporting related to
benefits realization, both during the project and after the project is
complete?
What are the project status reporting requirements?
40. 3.6 DIAGNOSTICS
Periodic reviews such as retrospectives or lessons learned are effective
ways to determine if approaches are working well and if improvements can
be made by tailoring. Project teams that do not use retrospectives can look to
issues, threats, quality assurance statistics, and stakeholder feedback for signs
that further tailoring or adaptation might be required or useful.
This section is intended as general guidance and does not address every
possible situation that could surface within a project. Table 3-1 lists some
common situations and suggested tailoring solutions for commonly
encountered situations.
Table 3-1. Common Situations and Tailoring Suggestions
3.7 SUMMARY
41. Tailoring involves the considered adaptation of approach, governance,
and processes to make them more suitable for the given environment and the
project at hand. It involves the analysis, design, and deliberate modification
of the people elements, the processes employed, and the tools used. The
tailoring process involves four steps:
Select initial approach.
Tailor for the organization.
Tailor for the project.
Implement ongoing improvement.
While the tailoring process is often undertaken by the project
stakeholders, the bounds and approach to tailoring are usually governed by
organizational guidelines. Organizational governance helps ensure the
external interfaces between project teams mesh correctly and provides
guidance in the form of tailoring considerations.
42. 4
Models, Methods, and Artifacts
4.1 OVERVIEW
This section provides a high-level description of some commonly used
models, methods, and artifacts that are useful in managing projects. The items
listed in this section are not intended to be exhaustive or prescriptive, but
rather to help project teams think about the options available to them.
In the context of this guide, terms are defined as follows:
Model. A model is a thinking strategy to explain a process, framework,
or phenomenon.
Method. A method is the means for achieving an outcome, output,
result, or project deliverable.
Artifact. An artifact can be a template, document, output, or project
deliverable.
As project teams consider the tailoring questions in Section 3.5 and
decide on specific responses to those questions, they will start to build a
framework for structuring their efforts to deliver the project outcomes. For
example, project teams select specific methods to enable capturing and
sharing the applicable information so they can track progress, improve
project team performance in real time, and engage stakeholders.
Figure 4-1 shows how tailoring includes the models and methods used to
perform work in the project performance domains. The deliverables and the
artifacts are also tailored to the project, internal environment, and external
environment.
43.
44. Figure 4-1. Tailoring to Fit the Project Context and Environment
As with any process, the use of models, methods, and artifacts has
associated costs related to time, level of expertise/proficiency in use, impact
on productivity, etc. Project teams should consider these implications when
deciding which elements to use. As much as possible, project teams should
avoid using anything that:
Duplicates or adds unnecessary effort,
Is not useful to the project team and its stakeholders,
Produces incorrect or misleading information, or
Caters to individual needs versus those of the project team.
4.2 COMMONLY USED MODELS
Models reflect small-scale, simplified views of reality and present
scenarios, strategies, or approaches for optimizing work processes and
efforts. A model helps to explain how something works in the real world.
Models can shape behavior and point to approaches for solving problems or
meeting needs. Some models were developed with projects and project teams
in mind, others are more general in nature. Where feasible, models in this
section are presented as they apply to projects. The content in this section
does not describe how to develop or create new models.
The model descriptions presented provide a high-level view. Project
team members and other stakeholders can refer to many sources (e.g., PMI's
library of standards products and PMIstandards+™) for more-complete
descriptions and explanations of the models.
4.2.1 SITUATIONAL LEADERSHIP MODELS
Situational leadership models are a subset of a vast array of leadership
models. Just as project teams tailor the processes, methods, life cycles, and
development approaches, leadership styles are also tailored. Situational
leadership models describe ways to tailor one's leadership style to meet the
45. needs of the individual and the project team. The following are examples of
two situational leadership models.
4.2.1.1 Situational Leadership® II
Ken Blanchard's Situational Leadership® II measures project team
member development using competence and commitment as the two main
variables. Competence is the combination of ability, knowledge, and skill.
Commitment speaks to the confidence and motivation an individual has. As an
individual's competence and commitment evolve, leadership styles evolve
from directing to coaching to supporting to delegating in order to meet the
individual's needs.
4.2.1.2 OSCAR Model
The OSCAR coaching and mentoring model was developed by Karen
Whittleworth and Andrew Gilbert. It helps individuals adapt their coaching
or leadership styles to support individuals who have an action plan for
personal development. The model refers to five contributing factors:
Outcome. An outcome identifies the long-term goals of an individual
and the desired result from each conversation session.
Situation. A situation enables conversation about the current skills,
abilities, and knowledge level of the project team member; why the
person is at that level; and how that level impacts the individual's
performance and peer relationships.
Choices/consequences. Choice and/or consequences identify all the
potential avenues for attaining the desired outcome and the
consequences of each choice so an individual can choose viable
avenues for reaching their long-term goals.
Actions. An action commits to specific improvements by focusing on
immediate and attainable targets that an individual can work toward
within a specified time frame.
Review. Holding regular meetings offers support and helps to ensure
that individuals remain motivated and on track.
46. 4.2.2 COMMUNICATION MODELS
Project success is dependent on effective communication. Communication
models demonstrate concepts associated with how sender and receiver
frames of reference impact the effectiveness of communication, how the
communication medium influences the effectiveness of communication, and
the types of disconnects between end-user expectations and reality. With the
prevalence of multicultural project teams and dispersed stakeholders, these
models provide a way of viewing communication styles and methods to
enhance communication efficiency and effectiveness. There are many
communication models that demonstrate different aspects of communication.
Sections 4.2.2.1 through 4.2.2.3 provide a sampling of communication
models.
4.2.2.1 Cross-Cultural Communication
A communication model developed by Browaeys and Price incorporates
the idea that the message itself and how it is transmitted is influenced by the
sender's current knowledge, experience, language, thinking, and
communication styles, as well as stereotypes and relationship to the receiver.
Similarly, the receiver's knowledge, experience, language, thinking, and
communication styles, as well as stereotypes and relationship to the sender
will influence how the message is interpreted.
4.2.2.2 Effectiveness of Communication Channels
Alistair Cockburn developed a model that describes the communication
channels along the axes of effectiveness and richness. As defined by Richard
Daft and Robert Lengel, richness relates to the amount of learning that can be
transmitted through a medium. Media richness is a function of characteristics,
including the ability to:
Handle multiple information cues simultaneously,
Facilitate rapid feedback,
Establish a personal focus, and
Utilize natural language.
47. Richness in communication allows a broad spectrum of information to be
conveyed rapidly. Situations that entail complex, complicated, and personal
information benefit from richer communication channels, such as face-to-face
communication. Situations that impart simple, factual information can use less
rich communication channels such as a note or a text message.
4.2.2.3 Gulf of Execution and Evaluation
Donald Norman described the gulf of execution as the degree to which an
item corresponds with what a person expects it to do. Said another way, it is
the difference between the intention of a user and what the item allows them
to do or supports them in doing. A car that has the ability to parallel park
itself would have a gulf of execution if the driver expected to push a button
labeled “park” and have the car park itself, and the car did not park itself.
The gulf of evaluation is the degree to which an item supports the user in
discovering how to interpret the item and interact with it effectively. The
same parking example would show a gulf of evaluation if the controls were
not designed in such a way that the driver could easily determine how to
initiate the self-parking function.
4.2.3 MOTIVATION MODELS
People perform better when they are motivated, and people are motivated
by different things. Understanding what motivates project team members and
other stakeholders helps to tailor rewards to the individual, thereby eliciting
more effective engagement. There are a significant number of models that
illustrate how people are motivated. Four models are described in Sections
4.2.3.1 through 4.2.3.4, though these are a small representation of available
models.
4.2.3.1 Hygiene and Motivational Factors
Frederick Herzberg conducted a study of motivational factors in working
life. He believed that job satisfaction and dissatisfaction stem from conditions
called motivational factors. Motivational factors include matters that relate to
the content of the work, such as achievement, growth, and advancement.
48. Insufficient motivational factors lead to dissatisfaction. Sufficient
motivational factors lead to satisfaction.
Herzberg also identified hygiene factors related to the work, such as
company policies, salary, and the physical environment. If hygiene factors are
insufficient, they cause dissatisfaction. However, even if they are sufficient,
they do not lead to satisfaction.
4.2.3.2 Intrinsic versus Extrinsic Motivation
Daniel Pink published several books about the intrinsic factors that
motivate people. He stated that while extrinsic rewards, such as salary, are
motivators to a certain extent, once a person is paid fairly for their work, the
motivational power of extrinsic rewards ceases to exist. For complicated and
challenging work, such as much of the work on projects, intrinsic motivators
are far longer lasting and more effective. Pink identifies three types of
intrinsic motivators: autonomy, mastery, and purpose:
Autonomy. Autonomy is the desire to direct one's own life. This is
aligned with being able to determine how, where, and when to
accomplish work. Autonomy includes flexible work hours, working
from home, and work on self-selecting and self-managing project
teams.
Mastery. Mastery is about being able to improve and excel. The desire
to do excellent work, learn, and achieve goals are aspects of mastery.
Purpose. Purpose speaks to the need to make a difference. Knowing
the project vision and how work contributes to achieving that vision
allows people to feel like they are making a difference.
4.2.3.3 Theory of Needs
David McClellan's model states that all people are driven by needs of
achievement, power, and affiliation. The relative strength of each need
depends on an individual's experiences and culture.
Achievement. People who are motivated by achievement, such as
reaching a goal, are motivated by activities and work that is
challenging, but reasonable.
49. Power. People who are motivated by power like to organize, motivate,
and lead others. They are motivated by increased responsibility.
Affiliation. People who are motivated by affiliation seek acceptance
and belonging. They are motivated by being part of a team.
4.2.3.4 Theory X, Theory Y, and Theory Z
Douglas McGregor devised the Theory X and Theory Y models, which
represent a spectrum of employee motivation and corresponding management
styles. This was later expanded to include Theory Z.
Theory X. The X side of the spectrum assumes individuals work for
the sole purpose of income. They are not ambitious or goal oriented.
The corresponding management style to motivate these individuals is a
hands-on and top-down approach. This management style is often seen
in a production or labor-intensive environment, or one with many
layers of management.
Theory Y. The Y side of the spectrum assumes that individuals are
intrinsically motivated to do good work. The corresponding
management style has a more personal coaching feel. The manager
encourages creativity and discussion. This management style is often
seen in creative and knowledge worker environments.
Theory Z. Abraham Maslow saw Theory Z as a transcendent
dimension to work where individuals are motivated by self-realization,
values, and a higher calling. The optimal management style in this
situation is one that cultivates insight and meaning.
William Ouchi's version of Theory Z focuses on motivating employees
by creating a job for life where the focus is on the well-being of
employees and their families. This style of management seeks to
promote high productivity, morale, and satisfaction.
4.2.4 CHANGE MODELS
Many projects contain an aspect of changing systems, behaviors,
activities, and sometimes, cultures. Managing this type of change requires
50. thinking about how to transition from the current to the future desired state.
There are many models that describe the activities necessary for successful
change management. Sections 4.2.4.1 through 4.2.4.5 provide a sampling of
the change models.
4.2.4.1 Managing Change in Organizations
Managing Change in Organizations: A Practice Guide [3] is an iterative
model that is based on common elements across a range of change
management models. The framework has five associated elements
interconnected through a series of feedback loops:
Formulate change. This element focuses on building the rationale to
help people understand why change is needed and how the future state
will be better.
Plan change. The identification of activities helps people prepare for
the transition from the current to the future state.
Implement change. This iterative element focuses on demonstrating
the future state capabilities, checking to ensure the capabilities are
having the intended impact, and making necessary improvements or
adaptations in response.
Manage transition. This element considers how to address needs
related to the change that may surface once the future state is achieved.
Sustain change. This element seeks to ensure that the new capabilities
continue and previous processes or behaviors cease.
4.2.4.2 ADKAR® Model
Jeff Hiatt developed the ADKAR® Model which focuses on five
sequential steps that individuals undergo when adapting to change:
Step 1: Awareness. This step identifies why the change is necessary.
Step 2: Desire. Once people know why the change is necessary, there
needs to be a desire to be part of and support the change.
Step 3: Knowledge. People need to understand how to change. This
includes understanding new processes and systems in addition to new
51. roles and responsibilities. Knowledge can be imparted through training
and education.
Step 4: Ability. In this step, knowledge is supported with hands-on
practice and access to expertise and help as needed.
Step 5: Reinforcement. Reinforcement supports the sustainment of the
change. This can include rewards, recognition, feedback, and
measurement.
4.2.4.3 The 8-Step Process for Leading Change
John Kotter introduced the 8-Step Process for Leading Change for
transforming organizations. It is a top-down approach where the need for and
approach to change originates at the top levels of the organization, and then is
promoted down through the organization's layers of management to the change
recipients. The eight steps are:
Step 1: Create urgency. Identify potential threats and opportunities
that drive the need for change.
Step 2: Form a powerful coalition. Identify the change leaders.
Change leaders are not necessarily based on hierarchy. The change
leaders should be influential people from a variety of roles, expertise,
social, and political importance.
Step 3: Create a vision for change. Identify the values that are central
to the change. Then create a brief vision statement that summarizes the
change. Next, identify a strategy to realize the vision.
Step 4: Communicate the vision. Communicate the vision throughout
the change process. Apply the vision throughout all aspects of the
organization. Senior management and the change coalition should
consistently communicate the vision and demonstrate the urgency and
benefits of the change.
Step 5: Remove obstacles. All change comes with obstacles.
Sometimes the obstacles are outdated processes, sometimes they are
based on the organizational structure, and sometimes they are people
resistant to change. Regardless, all obstacles need to be addressed.
52. Step 6: Create short-term wins. Identify quick and easy wins to build
momentum and support for the change.
Step 7: Build on the change. Once the short-term wins are complete,
the organization needs to set goals for continued improvement.
Step 8: Anchor the changes in corporate culture. Ensure the change
becomes ingrained into the culture: continue to communicate the vision,
tell success stories, recognize people in the organization who embody
and empower the change, and continue to support the change coalition.
4.2.4.4 Virginia Satir Change Model
Virginia Satir developed a model of how people experience and cope
with change. Its purpose is to help project team members understand what
they are feeling and enable them to move through change more efficiently.
Late status quo. This initial stage is when everything feels familiar
and can be characterized as “business as usual.” For some people,
business as usual may be good because they know what to expect. For
others, this status may feel a bit stale or boring.
The foreign element. Something happens that shifts the status quo in
this stage. This may include initiating a project that introduces change
to people's usual way of working. There is often a period of resistance
and reduction in performance after the change is introduced. People
may ignore the change or dismiss its relevance.
Chaos. People are in unfamiliar territory. They are no longer
comfortable, and performance drops to its lowest level. Feelings,
actions, and behaviors are unpredictable. Some people feel anxious,
others may shut down, and some individuals may feel excited. Chaos
can make people very creative as they try to find ways to make sense of
the situation. They try various ideas and behaviors to see which of
these has a positive outcome.
The transforming idea. People come to a point where they come up
with an idea that helps them make sense of the situation. They begin to
see how they can find a way out of the chaos and cope with the new
reality. Work performance begins to increase.
53. Practice and integration. People try to implement their new ideas or
behaviors. There may be setbacks and a period of trial and error, but
eventually they learn what works and what doesn't. This leads to
improved performance. Often performance is at a higher level than it
was before the foreign element was introduced.
New status quo. People get used to the new environment, and their
performance stabilizes. Eventually, the new status quo becomes the
normal way of working.
4.2.4.5 Transition Model
William Bridges’ Transition Model provides an understanding of what
occurs to individuals psychologically when an organizational change takes
place. This model differentiates between change and transition. Change is
situational and happens whether or not people transition through it. Transition
is a psychological process where people gradually accept the details of the
new situation and the changes that come with it.
The model identifies three stages of transition associated with change:
Ending, losing, and letting go. The change is introduced in this stage.
It is often associated with fear, anger, upset, uncertainty, denial, and
resistance to the change.
The neutral zone. The change is happening in this stage. In some
instances, people may feel frustration, resentment, confusion, and
anxiety about the change. Productivity may drop as people learn new
ways of doing work. In other instances, people may become very
creative, innovative, and passionate about trying new ways of working.
The new beginning. At this point, people accept and even embrace the
change. They are becoming more adept at the new skills and the new
ways of working. People are often open to learning and are energized
by the change.
4.2.5 COMPLEXITY MODELS
54. Projects exist in a state of ambiguity and require interactions among
multiple systems, often with uncertain outcomes. Complexity is a challenge to
work with. The two models described in Sections 4.2.5.1 and 4.2.5.2 provide
a framework to understand complexity and determine how to make decisions
in a complex environment.
4.2.5.1 Cynefin Framework
The Cynefin framework, created by Dave Snowden, is a conceptual
framework used to diagnose cause-and-effect relationships as a decision-
making aid. The framework offers five problem and decision-making
contexts:
Where there is an obvious cause-and-effect relationship, best practices
are used to make decisions.
Complicated relationships exist when there is a set of known unknowns
or a range of correct answers. In these situations, it is best to assess the
facts, analyze the situation, and apply good practices.
Complex relationships include unknown unknowns. There is no
apparent cause and effect, and there are no obvious right answers. In
complex environments, one should probe the environment, sense the
situation, and respond with action. This style uses emergent practices
that allow for repeated cycles of probe-sense-respond as complex
environments change in reaction to multiple stimuli, and what worked
once may not be effective the next time.
In chaotic environments, the cause and effects are unclear. There is too
much confusion to wait to understand the situation. In these situations,
the first step is to take action to try and stabilize the situation, then
sense where there is some stability, and respond by taking steps to get
the chaotic situation to a complex situation.
Disordered relationships lack clarity and may require breaking them
into smaller parts whose context links with one of the other four
contexts.
The Cynefin framework helps identify behaviors, such as probing,
sensing, responding, acting, and categorizing, which can help impact the
relationships between variables and guide actions.
55. 4.2.5.2 Stacey Matrix
Ralph Stacey developed the Stacey matrix which is similar to the Cynefin
framework, but it looks at two dimensions to determine the relative
complexity of a project: (a) the relative uncertainty of the requirements for the
deliverable, and (b) the relative uncertainty of the technology that will be
used to create the deliverable. Based on the relative uncertainty of these
dimensions, a project is considered simple, complicated, complex, or
chaotic. The degree of complexity is one factor that influences tailoring
methods and practices for the project.
4.2.6 PROJECT TEAM DEVELOPMENT MODELS
Project teams move through different stages of development.
Understanding the stage of the team in its development helps project managers
support the project team and its growth. The two models presented in
Sections 4.2.6.1 and 4.2.6.2 illustrate how project teams move through
different stages to become high-performing project teams.
4.2.6.1 Tuckman Ladder
Bruce Tuckman articulated the stages of team development as forming,
storming, norming, and performing. Many people add a fifth stage, adjourning.
Forming. The project team first comes together. Members get to know
each other's name, position on the project team, skill sets, and other
pertinent background information. This might occur in the kickoff
meeting.
Storming. Project team members jockey for position on the team. This
phase is where people's personalities, strengths, and weaknesses start
to come out. There might be some conflict or struggle as people figure
out how to work together. Storming might go on for some time or pass
relatively quickly.
Norming. The project team starts to function as a collective body. At
this point, project team members know their places on the team and
how they relate to and interface with all the other members. They are
starting to work together. There might be some challenges as work
56. progresses, but these issues are resolved quickly, and the project team
moves into action.
Performing. The project team becomes operationally efficient. This is
the mature project team stage. Project teams that have been together for
a while are able to develop a synergy. By working together, project
team members accomplish more and produce a high-quality product.
Adjourning. The project team completes the work and disperses to
work on other things. If the project team has formed good relationships,
some project team members might be sad about leaving the project
team.
The project team culture in this model starts in the forming stage and
evolves throughout the rest of the development stages. While this model
shows a linear progression, project teams can move back and forth between
theses stages. In addition, not all project teams achieve the performing or
even the norming stages.
4.2.6.2 Drexler/Sibbet Team Performance Model
Allan Drexler and David Sibbet developed a team performance model
with seven steps. Steps 1 through 4 describe the stages in creating a project
team, and steps 5 through 7 cover project team sustainability and
performance.
Step 1: Orientation. Orientation answers the question of why. In this
stage, the project team learns the purpose and mission for the project.
This usually occurs at a kickoff meeting, or is documented in a business
case, project charter, or lean start-up canvas.
Step 2: Trust building. Trust building answers the question of who.
This stage sheds light on who is on the project team and the skills and
abilities each person brings. It can also include information about key
stakeholders who may not be part of the project team but can influence
the project team.
Step 3: Goal clarification. Goal clarification answers what. In this
stage, the project team elaborates the high-level project information.
57. This may include finding out more about stakeholder expectations,
requirements, assumptions, and deliverable acceptance criteria.
Step 4: Commitment. Commitment addresses the question of how. In
this stage, the project team starts to define plans to achieve the goals.
This can include milestone schedules, release plans, high-level
budgets, resource needs, and so forth.
Step 5: Implementation. High-level plans are decomposed into
greater levels of detail, such as a detailed schedule or backlog. The
project team starts working together to produce deliverables.
Step 6: High performance. After the project team has worked together
for some time, project team members reach a high level of
performance. They work well together, don't need much oversight, and
experience synergies within the project team.
Step 7: Renewal. Renewal is the stage of working through changes on
the project team or the project. The deliverables, stakeholders,
environment, project team leadership, or team membership may
change. This causes the project team to consider if the past behavior
and actions are still sufficient, or if the project team needs to go back
to a previous stage to reset the expectations and ways of working
together.
4.2.7 OTHER MODELS
The models described in Sections 4.2.7.1 through 4.2.7.5 cover a wide
range of topics, including conflict management, negotiation, planning, Process
Groups, and salience.
4.2.7.1 Conflict Model
Conflict is common on projects. Conflict can be healthy and productive
when handled well. It can result in greater trust among project team members
and a deeper commitment to the outcomes. Fear of conflict can restrict
communication and creativity. However, conflict can be unhealthy as well.
Addressing conflict inappropriately can lead to dissatisfaction, lack of trust,
and reduced morale and motivation. The model based on work by Ken
58. Thomas and Ralph Kilmann describes six ways of addressing conflict by
focusing on the relative power between the individuals and the desire to
maintain a good relationship as follows:
Confronting/problem solving. Confronting a conflict treats the conflict
as a problem to be solved. This style of conflict resolution is used
when the relationship between parties is important, and when each
person has confidence in the other party's ability to problem-solve.
Collaborating. Collaborating involves incorporating multiple views
about the conflict. The objective is to learn about the various views
and see things from multiple perspectives. This is an effective method
when there is trust among the participants and when there is time to
come to consensus. A project manager may facilitate this type of
conflict resolution between project team members.
Compromising. There are some conflicts in which all parties will not
be fully satisfied. In those instances, finding a way to compromise is
the best approach. Compromise entails a willingness to give and take.
This allows all parties to get something they want, and it avoids
escalating the conflict. This style is often used when the parties
involved have equal “power.” A project manager may compromise
with a technical manager regarding the availability of a project team
member to work on the project.
Smoothing/accommodating. Smoothing and accommodating are useful
when reaching the overarching goal is more important than the
disagreement. This approach maintains harmony in the relationship and
can create good will between the parties. This approach is also used
when there is a difference in the relative authority or power of the
individuals. For example, this approach may be appropriate when there
is a disagreement with the sponsor. Since the sponsor outranks the
project manager or project team member, and there is a desire to
maintain a good relationship with the sponsor, adopting an
accommodating posture may be appropriate.
Forcing. Forcing is used when there is not enough time to collaborate
or problem-solve. In this scenario, one party forces their will on the
other. The party forcing has more power than the other party. A forcing
59. style may be used if there is a health and safety conflict that needs to be
resolved immediately.
Withdrawal/avoiding. Sometimes a problem will go away on its own,
or sometimes discussions get heated and people need a cooling-off
period. In both scenarios, withdrawing from the situation is
appropriate. Withdrawal is also used in a no-win scenario, such as
complying with a requirement imposed by a regulatory agency instead
of challenging the requirement.
4.2.7.2 Negotiation
There are many models for negotiation. One model is Steven Covey's
principle of “Think Win-Win.” This principle applies to all interactions, not
just negotiations, but it is described here in the context of negotiation. In
negotiations, there are different possible outcomes:
Win-win. This is the optimal outcome, where each person is satisfied
with the outcome.
Win-lose/lose-win. This describes a competition perspective where in
order to win, someone else loses. It may also come from a martyr
perspective where someone chooses to lose so that others can win.
Lose-lose. This outcome can occur when win-win outcomes may have
been possible, but competition overwhelms collaboration. In this
scenario, everyone ends up worse off.
A win-win perspective is generally found when the following aspects are
present:
Character. The parties involved are mature, demonstrate integrity, and
share the perspective that there is enough value for everybody.
Trust. The parties trust each other, establish agreements on how to
operate, and are accountable.
Approach. Each party is willing to look at the situation from the other's
point of view. The parties work together to identify key issues and
concerns. They identify what an acceptable solution looks like and
identify options to achieve an acceptable solution.
60. 4.2.7.3 Planning
Barry Boehm developed a model that compares the time and effort
invested in developing plans to reduce risk, including the delay and other
costs associated with overplanning. By taking more time to plan up front,
many projects can reduce uncertainty, oversights, and rework. However, the
longer the time spent planning, the longer it takes to get a return on investment,
the more market share could be lost, and the more circumstances can change
by the time the output is delivered. The intent of this model is to help identify
the optimum amount of planning, sometimes called the sweet spot. The sweet
spot is different for every project; therefore, there is no correct answer for the
right amount of planning overall. This model demonstrates that there is a point
where additional planning becomes counterproductive.
4.2.7.4 Process Groups
Project management processes can be organized into logical groupings of
project management inputs, tools and techniques, and outputs that are tailored
to meet the needs of the organization, stakeholders, and the project.
Groups of processes are not project phases. The Process Groups interact
within each phase of a project life cycle. It is possible that all of these
processes could occur within a single phase. Processes may be iterated
within a phase or life cycle. The number of iterations and interactions
between processes varies based on the needs of the project.
Projects that follow a process-based approach may use the following five
process groupings as an organizing structure:
Initiating. Those processes performed to define a new project or a
new phase of an existing project by obtaining authorization to start the
project or phase.
Planning. Those processes required to establish the scope of the
project, refine the objectives, and define the course of action required
to attain the objectives that the project was undertaken to achieve.
Executing. Those processes performed to complete the work defined
in the project management plan to satisfy the project requirements.
61. Monitoring and Controlling. Those processes required to track,
review, and regulate the progress and performance of the project;
identify any areas in which changes to the plan are required; and
initiate the corresponding changes.
Closing. Those processes performed to formally complete or close a
project, phase, or contract.
These Process Groups are independent of the delivery approach,
application areas (such as marketing, information services, and accounting),
or industry (such as construction, aerospace, and telecommunications). In a
process-based approach, the output of one process generally becomes an
input to another process or is a deliverable of the project or project phase.
For example, a project management plan and project documents, such as the
risk register, assumption log, etc., which are produced in the planning process
grouping, are inputs to the executing process grouping where updates are
made to associated artifacts.
4.2.7.5 Salience Model
The Salience Model is about stakeholders. Salience means prominent,
noticeable, or perceived as important. This model was proposed by Ronald
K. Mitchell, Bradley R. Agle, and Donna J. Wood. The authors denoted a
stakeholder identification based on three variables: power to influence,
legitimacy of the stakeholders’ relationships with the project, and the urgency
of the stakeholders' claim on the project for stakeholder engagement.
4.3 MODELS APPLIED ACROSS
PERFORMANCE DOMAINS
Different models are more likely to be useful in different project
performance domains. While the needs of the project, stakeholders, and
organizational environment will determine which models are most applicable
for a specific project, there are some performance domains that are more
likely to make use of each model. Table 4-1 suggests the performance
domain(s) where each model is most likely to be of use; however, the project
62. manager and project team have the ultimate responsibility for selecting the
right models for their project.
Table 4-1. Mapping of Models Likely to Be Used in Each Performance Domain
63.
64. 4.4 COMMONLY USED METHODS
A method is a means for achieving an outcome, output, result, or project
deliverable. The methods described here are a sampling of those commonly
used to support project work. There are many methods that are not described
here, either because they are used in project management the same way they
are in other disciplines, such as interviewing, focus groups, checklists, and so
forth, or because they are not frequently used across a broad spectrum of
projects (i.e., the methods are industry specific).
Many of the methods are related by the purpose they serve, such as
estimating or data gathering, and therefore, are presented in a group. Others
are related by the type of activity involved, such as those in the meetings and
analysis groups.
The content in this section is not meant to describe how a method is
performed. The descriptions are presented at a high level with more detailed
information available from many sources, including PMIstandards+.
4.4.1 DATA GATHERING AND ANALYSIS
Data gathering and analysis methods are used to collect, assess, and
evaluate data and information to gain a deeper understanding of a situation.
The outputs of data analysis may be organized and presented as one of the
artifacts shown in Section 4.6.6. The data gathering and analysis methods
described here, coupled with the artifacts described in Section 4.6.6, are
often used to inform decisions.
Alternatives analysis. Alternatives analysis is used to evaluate
identified options in order to select the options or approaches to
perform the work of the project.
Assumption and constraint analysis. An assumption is a factor that is
considered to be true, real, or certain, without proof or demonstration.
A constraint is a limiting factor that affects the execution of a project,
program, portfolio, or process. This form of analysis ensures that
assumptions and constraints are integrated into the project plans and
documents, and that there is consistency among them.
65. Benchmarking. Benchmarking is the comparison of actual or planned
products, processes, and practices to those of comparable
organizations, which identifies best practices, generates ideas for
improvement, and provides a basis for measuring performance.
Business justification analysis methods. This group of analysis
methods is associated with authorizing or justifying a project or a
decision. The outcomes of the following analyses are often used in a
business case that justifies undertaking a project:
Payback period. The payback period is the time needed to recover
an investment, usually in months or years.
Internal rate of return (IRR). The internal rate of return is the
projected annual yield of a project investment, incorporating both
initial and ongoing costs into an estimated percentage growth rate a
given project is expected to have.
Return on investment (ROI). Return on investment is the percent
return on an initial investment, calculated by taking the projected
average of all net benefits and dividing them by the initial cost.
Net present value (NPV). Net present value is the future value of
expected benefits, expressed in the value those benefits have at the
time of investment. NPV considers current and future costs and
benefits and inflation.
Cost-benefit analysis. A cost-benefit analysis is a financial analysis
tool used to determine the benefits provided by a project against its
costs.
Check sheet. A check sheet is a tally sheet that can be used as a
checklist when gathering data. Check sheets can be used to collect and
segregate data into categories. Check sheets can also be used to create
histograms and matrices as described in Section 4.6.6.
Cost of quality. The cost of quality includes all costs incurred over the
life of the product by investment in preventing nonconformance to
requirements, appraisal of the product or service for conformance to
requirements, and failure to meet requirements.
66. Decision tree analysis. A decision tree analysis is a diagramming and
calculation method for evaluating the implications of a chain of
multiple options in the presence of uncertainty. Decision trees can use
the information generated from an expected monetary value analysis to
populate the branches of the decision tree.
Earned value analysis. Earned value analysis is a method that utilizes
a set of measures associated with scope, schedule, and cost to
determine the cost and schedule performance of a project.
Expected monetary value (EMV). The expected monetary value is
the estimated value of an outcome expressed in monetary terms. It is
used to quantify the value of uncertainty, such as a risk, or compare the
value of alternatives that are not necessarily equivalent. The EMV is
calculated by multiplying the probability that an event will occur and
the economic impact the event would have should it occur.
Forecast. A forecast is an estimate or prediction of conditions and
events in the project's future, based on information and knowledge
available at the time of the forecast. Qualitative forecasting methods
use the opinions and judgments of subject matter experts. Quantitative
forecasting uses models where past information is used to predict
future performance. Causal or econometric forecasting, such as
regression analysis, identifies variables that can have significant
impact on future outcomes.
Influence diagram. This diagram is a graphical representation of
situations showing causal influences, time ordering of events, and other
relationships among variables and outcomes.
Life cycle assessment. This assessment is a tool used to evaluate the
total environmental impact of a product, process, or system. It includes
all aspects of producing a project deliverable, from the origin of
materials used in the deliverable to its distribution and ultimate
disposal.
Make-or-buy analysis. A make-or-buy analysis is the process of
gathering and organizing data about product requirements and analyzing
them against available alternatives such as the purchase versus internal
manufacture of the product.
67. Probability and impact matrix. A probability and impact matrix is a
grid for mapping the probability of occurrence of each risk and its
impact on project objectives if that risk occurs.
Process analysis. This analysis is a systematic review of the steps and
procedures to perform an activity.
Regression analysis. A regression analysis is an analytical technique
where a series of input variables are examined in relation to their
corresponding output results in order to develop a mathematical or
statistical relationship.
Reserve analysis. This analytical technique is used to evaluate the
amount of risk on the project and the amount of schedule and budget
reserve to determine whether the reserve is sufficient for the remaining
risk. The reserve contributes to reducing risk to an acceptable level.
Root cause analysis. This analytical technique is used to determine the
basic underlying cause of a variance, defect, or a risk. A root cause
may underlie more than one variance, defect, or risk.
Sensitivity analysis. This analytical technique is used to determine
which individual project risks or other sources of uncertainty have the
most potential impact on project outcomes by correlating variations in
project outcomes with variations in elements of a quantitative risk
analysis model.
Simulations. This analytical technique uses models to show the
combined effect of uncertainties in order to evaluate their potential
impact on objectives. A Monte Carlo simulation is a method of
identifying the potential impacts of risk and uncertainty using multiple
iterations of a computer model to develop a probability distribution of
a range of outcomes that could result from a decision or course of
action.
Stakeholder analysis. This technique involves systematically
gathering and analyzing quantitative and qualitative information about
stakeholders to determine whose interests should be taken into account
throughout the project.
68. SWOT analysis. A SWOT analysis assesses the strengths,
weaknesses, opportunities, and threats of an organization, project, or
option.
Trend analysis. A trend analysis uses mathematical models to forecast
future outcomes based on historical results.
Value stream mapping. Value stream mapping is a lean enterprise
method used to document, analyze, and improve the flow of information
or materials required to produce a product or service for a customer.
Variance analysis. Variance analysis is used to determine the cause
and degree of difference between the baseline and actual performance.
What-if scenario analysis. This analytical technique evaluates
scenarios in order to predict their effect on project objectives.
4.4.2 ESTIMATING
Estimating methods are used to develop an approximation of work, time,
or cost on a project.
Affinity grouping. Affinity grouping involves classifying items into
similar categories or collections on the basis of their likeness.
Common affinity groupings include T-shirt sizing and Fibonacci
numbers.
Analogous estimating. Analogous estimating assesses the duration or
cost of an activity or a project using historical data from a similar
activity or project.
Function point. A function point is an estimate of the amount of
business functionality in an information system. Function points are
used to calculate a functional size measurement (FSM) of a software
system.
Multipoint estimating. Multipoint estimating assesses cost or duration
by applying an average or weighted average of optimistic, pessimistic,
and most likely estimates when there is uncertainty with the individual
activity estimates.
69. Parametric estimating. Parametric estimating uses an algorithm to
calculate cost or duration based on historical data and project
parameters.
Relative estimating. Relative estimating is used to create estimates
that are derived from performing a comparison against a similar body
of work, taking effort, complexity, and uncertainty into consideration.
Relative estimating is not necessarily based on absolute units of cost or
time. Story points are a common unitless measure used in relative
estimating.
Single-point estimating. Single-point estimating involves using data to
calculate a single value that reflects a best-guess estimate. A single-
point estimate is opposed to a range estimate, which includes the best-
and worst-case scenario.
Story point estimating. Story point estimating involves project team
members assigning abstract, but relative, points of effort required to
implement a user story. It tells the project team about the difficulty of
the story considering the complexity, risks, and effort involved.
Wideband Delphi. Wideband Delphi is a variation of the Delphi
estimating method where subject matter experts complete multiple
rounds of producing estimates individually, with a project team
discussion after each round, until a consensus is achieved. For
Wideband Delphi, those who created the highest and lowest estimates
explain their rationale, following which everyone reestimates. The
process repeats until convergence is achieved. Planning poker is a
variation of Wideband Delphi.
4.4.3 MEETINGS AND EVENTS
Meetings are an important means for engaging the project team and other
stakeholders. They are a primary means of communication throughout the
project.
Backlog refinement. At a backlog refinement meeting, the backlog is
progressively elaborated and (re)prioritized to identify the work that
can be accomplished in an upcoming iteration.