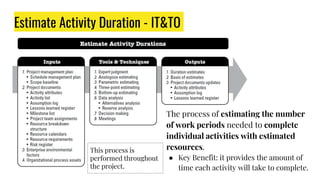
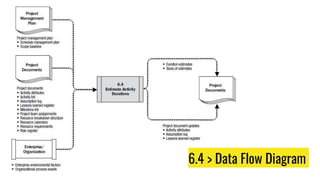
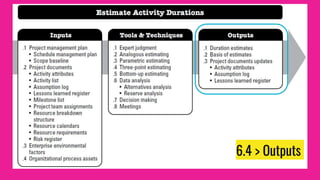
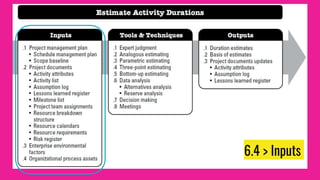
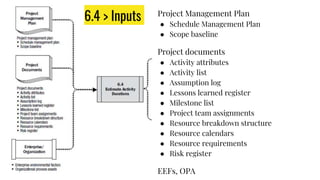
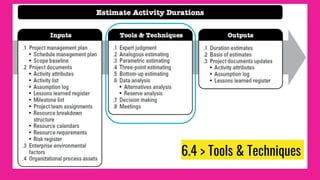
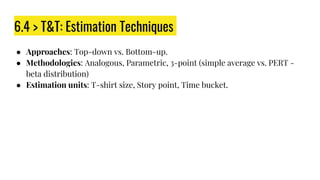
Project Schedule
Management
PMP Workgroup
Outline
● Project Schedule Knowledge Area
● Plan Schedule Management
● Define Activities
● Sequence Activities
● Estimate Activity Durations
● Develop Schedule
● Control Schedule
6.4 Estimate
Activity Duration
Estimate Activity Duration - IT&TO
The process of estimating the number
of work periods needed to complete
individual activities with estimated
resources.
● Key Benefit: it provides the amount of
time each activity will take to complete.
This process is
performed throughout
the project.
6.4 > Data Flow Diagram
6.4 > Data Flow Diagram (cont.)
Estimating activity durations uses information from
● the scope of work;
● required resource types or skill levels;
● estimated resource quantities;
● resource calendars;
● others
○ constraints imposed on the duration, effort involved;
○ type of resources (e.g., fixed duration, fixed effort or work, fixed number of resources);
○ the schedule network analysis technique used.
The duration estimate is progressively elaborated, and the process considers the
quality and availability of the input data. For example, as more detailed and
precise data are available about the project engineering and design work, the
accuracy and quality of the duration estimates improve.
6.4 > Considerations
A change to a driving resource allocated to the activity will usually have an effect
on the duration, but this is not a simple “straight-line” or linear relationship.
Other factors for consideration
● Law of diminishing returns
● Number of resources
● Advances in technology
● Motivation of staff
The diminishing returns curve has as a premise: you set the variables around your system,
and you are only changing the amount of people. Therefore, if you change other variables,
you may be able to stay longer in the increasing returns area.
6.4 > Law of diminishing returns
6.4 > Outputs
6.4 > Outputs: Duration Estimates
Duration estimates are quantitative assessments of the likely number of time
periods that are required to complete an activity, a phase, or a project.
Duration estimates may include some indication of the range of possible results.
For example
● A range of 2 weeks ± 2 days, which indicates that the activity will take at least 8 days
and not more than 12 (assuming a 5-day work week); or
● A 15% probability of exceeding 3 weeks, which indicates a high probability—85%—that
the activity will take 3 weeks or less.
Note: Duration estimates must not include any leads/lags.
6.4 > Outputs: Basis of Estimates
The amount and type of additional details supporting the duration estimate
vary by application area. Regardless of the level of detail, the supporting
documentation should provide a clear and complete understanding of how the
duration estimate was derived.
Documentation of the basis of
the estimate
Indication of the range of possible estimates (e.g., ±10%)
to indicate that the duration is estimated between a
range of values)
Documentation of all
assumptions made
Indication of the confidence level of the final estimate
Documentation of any known
constraints
Documentation of individual project risks influencing
this estimate
6.4 > Ouputs: Project Documents Updates
● Activity attributes. Activity duration estimates produced during this process
are documented as part of the activity attributes.
● Assumption log. This includes assumptions made in developing the duration
estimate, such as resource skill levels and availability, as well as a basis of
estimates for durations. Additionally, constraints arising out of the
scheduling methodology and scheduling tool are also documented.
● Lessons learned register. The lessons learned register can be updated with
techniques that were efficient and effective in developing effort and duration
estimates.
6.4 > Inputs
Project Management Plan
● Schedule Management Plan
● Scope baseline
Project documents
● Activity attributes
● Activity list
● Assumption log
● Lessons learned register
● Milestone list
● Project team assignments
● Resource breakdown structure
● Resource calendars
● Resource requirements
● Risk register
EEFs, OPA
6.4 > Inputs
6.4 > Tools & Techniques
6.4 > T&T: Estimation Techniques
● Approaches: Top-down vs. Bottom-up.
● Methodologies: Analogous, Parametric, 3-point (simple average vs. PERT -
beta distribution)
● Estimation units: T-shirt size, Story point, Time bucket.
6.4 > T&T: Estimation Approaches
Bottom-up Top-down
A method of estimating project
duration by aggregating the estimates
of the lower-level components of the
WBS.
Estimate the duration of high-level
components using the historical data.
When an activity’s duration cannot be
estimated with a reasonable degree of
confidence, the work within the activity
is decomposed into more detail.
The detail durations are estimated.
Generally less costly, less time-
consuming than the bottom-up
approach, but also less accurate.
Is frequently used when there is a
limited amount of detailed information
about the project.
6.4 > T&T: Estimation Methodologies
Analogous Estimating Parametric Estimating
Estimate the duration or cost of an activity or a project using historical data from
a similar activity or project.
Most reliable when the previous activities are similar in fact and not just in
appearance, and the project team members preparing the estimates have the
needed expertise.
Provide an increased level of accuracy due to the
statistical nature of the estimating technique (using
statistical relationship between historical data and other
variables to calculate an estimate for activity parameters,
such as cost, budget, and duration).
6.4 > T&T: Estimation Methodologies (2)
Three-point estimating: The accuracy of single-point duration estimates may be
improved by considering estimation uncertainty and risk. Using three-point
estimates helps define an approximate range for an activity’s duration
● Most likely (tM). This estimate is based on the duration of the activity, given
the resources likely to be assigned, their productivity, realistic expectations
of availability for the activity, dependencies on other participants, and
interruptions.
● Optimistic (tO). The activity duration based on analysis of the best-case
scenario for the activity.
● Pessimistic (tP). The duration based on analysis of the worst-case scenario
for the activity.
6.4 > T&T: Estimation Methodologies (3)
Three-point estimating (cont.): Depending on the assumed distribution of values
within the range of the three estimates, the expected duration, tE, can be
calculated.
● Simple average (triangular distribution): tE = (tO + tM + tP) / 3
● PERT (beta distribution): tE = (tO + tM*4 + tP) / 6
6.4 > T&T: Estimation Units
● T-shirt Size: use S, M, L, XL as a way to bucket the unit of work.
● Story Point: Story points rate the relative effort of work in a Fibonacci-like
format: 0, 0.5, 1, 2, 3, 5, 8, 13, 20, 40, 100.
● Time Bucket: simply using days and hours to estimate the effort of work.
Common principle: if an effort is big enough to fall in any of bucket, try to break
it down and rescope.
Common pitfall: the T-shirt size or the story point is commonly mistaken to
associate to an equivalent amount in hours or days (e.g., S = 0-2 weeks; M = 2-4
weeks; 1 point = 2 hours; 2 points = 5 hours…). There is no standard equivalence.
It is up to each team to decide and agree on the relative effort for each T-shirt
size/story point value.
6.4 > T&T: Estimation accuracy level
The expected accuracy level of the estimations depends on the purpose of the
estimation (or the stage of the project). For example
Leve
l
Purpose Method Accuracy Estimation
effort
L1 Strategic planning to calculate ROI
among different initiatives
White boarding with stakeholders and
technical leads
50-50% 1h
L2 Rough estimates to date for
internal forecasting
Design docs, test cases, user stories,
story points accumulation
70-30% 1w
L3 Accurate estimates to date for
client facing
L2 + API definitions, method signatures
and contracts, and no unknowns
90-10% 1m
6.4 > T&T: combining multiple estimation techniques
No single project estimation technique will suit all projects.
To achieve the most accurate results we suggest using and combining a few of
these estimating techniques to provide increased accuracy to your project
estimates.
For instance, at the early stage of the project, you can use the analogous
methodology (top-down approach) using the T-shirt sizes or Story points to
estimate the effort of the work. As the work is progressively elaborated,
estimations in days/hours can be provided to lower-level components.
6.4 > T&T: Estimating Technique Sample
Statistically learnt from
the historical data
6.4 > T&T: Other techniques
● Expert Judgment
● Data Analysis
○ Alternative analysis
○ Reserve analysis
● Decision Making
○ Fist of five (or fist to five)
● Meetings
6.4 > T&T: Reserve Analysis
Determine the amount of contingency and management reserve needed for the
project.
● Contingency Reserve: is account for schedule uncertainty, allocated for
identified risks that are accepted - associated with the known-unknowns.
○ Contingency reserves may be separated from the individual activities and
aggregated.
○ The contingency reserve may be a percentage of the estimated activity duration
or a fixed number of work periods.
○ The contingency reserve is included in the schedule baseline but should be
clearly identified in the schedule documentation.
○ As more precise information about the project becomes available, the
contingency reserve may be used, reduced, or eliminated.
6.4 > T&T: Reserve Analysis (2)
● Management Reserve: a specified amount of the project budget withheld for
management control purposes and is reserved for unforeseen work
(unknown unknowns) that is within scope of the project.
○ Management Reserve is not included in the schedule baseline, but is part of the
overall project duration requirements.
○ Depending on contract terms, use of management reserves may require a change
to the schedule baseline.

Project Schedule Management - Estimate Activity Durations - PMP Workgroup

  • 1.
  • 2.
    Outline ● Project ScheduleKnowledge Area ● Plan Schedule Management ● Define Activities ● Sequence Activities ● Estimate Activity Durations ● Develop Schedule ● Control Schedule
  • 3.
  • 4.
    Estimate Activity Duration- IT&TO The process of estimating the number of work periods needed to complete individual activities with estimated resources. ● Key Benefit: it provides the amount of time each activity will take to complete. This process is performed throughout the project.
  • 5.
    6.4 > DataFlow Diagram
  • 6.
    6.4 > DataFlow Diagram (cont.) Estimating activity durations uses information from ● the scope of work; ● required resource types or skill levels; ● estimated resource quantities; ● resource calendars; ● others ○ constraints imposed on the duration, effort involved; ○ type of resources (e.g., fixed duration, fixed effort or work, fixed number of resources); ○ the schedule network analysis technique used. The duration estimate is progressively elaborated, and the process considers the quality and availability of the input data. For example, as more detailed and precise data are available about the project engineering and design work, the accuracy and quality of the duration estimates improve.
  • 7.
    6.4 > Considerations Achange to a driving resource allocated to the activity will usually have an effect on the duration, but this is not a simple “straight-line” or linear relationship. Other factors for consideration ● Law of diminishing returns ● Number of resources ● Advances in technology ● Motivation of staff
  • 8.
    The diminishing returnscurve has as a premise: you set the variables around your system, and you are only changing the amount of people. Therefore, if you change other variables, you may be able to stay longer in the increasing returns area. 6.4 > Law of diminishing returns
  • 9.
  • 10.
    6.4 > Outputs:Duration Estimates Duration estimates are quantitative assessments of the likely number of time periods that are required to complete an activity, a phase, or a project. Duration estimates may include some indication of the range of possible results. For example ● A range of 2 weeks ± 2 days, which indicates that the activity will take at least 8 days and not more than 12 (assuming a 5-day work week); or ● A 15% probability of exceeding 3 weeks, which indicates a high probability—85%—that the activity will take 3 weeks or less. Note: Duration estimates must not include any leads/lags.
  • 11.
    6.4 > Outputs:Basis of Estimates The amount and type of additional details supporting the duration estimate vary by application area. Regardless of the level of detail, the supporting documentation should provide a clear and complete understanding of how the duration estimate was derived. Documentation of the basis of the estimate Indication of the range of possible estimates (e.g., ±10%) to indicate that the duration is estimated between a range of values) Documentation of all assumptions made Indication of the confidence level of the final estimate Documentation of any known constraints Documentation of individual project risks influencing this estimate
  • 12.
    6.4 > Ouputs:Project Documents Updates ● Activity attributes. Activity duration estimates produced during this process are documented as part of the activity attributes. ● Assumption log. This includes assumptions made in developing the duration estimate, such as resource skill levels and availability, as well as a basis of estimates for durations. Additionally, constraints arising out of the scheduling methodology and scheduling tool are also documented. ● Lessons learned register. The lessons learned register can be updated with techniques that were efficient and effective in developing effort and duration estimates.
  • 13.
  • 14.
    Project Management Plan ●Schedule Management Plan ● Scope baseline Project documents ● Activity attributes ● Activity list ● Assumption log ● Lessons learned register ● Milestone list ● Project team assignments ● Resource breakdown structure ● Resource calendars ● Resource requirements ● Risk register EEFs, OPA 6.4 > Inputs
  • 15.
    6.4 > Tools& Techniques
  • 16.
    6.4 > T&T:Estimation Techniques ● Approaches: Top-down vs. Bottom-up. ● Methodologies: Analogous, Parametric, 3-point (simple average vs. PERT - beta distribution) ● Estimation units: T-shirt size, Story point, Time bucket.
  • 17.
    6.4 > T&T:Estimation Approaches Bottom-up Top-down A method of estimating project duration by aggregating the estimates of the lower-level components of the WBS. Estimate the duration of high-level components using the historical data. When an activity’s duration cannot be estimated with a reasonable degree of confidence, the work within the activity is decomposed into more detail. The detail durations are estimated. Generally less costly, less time- consuming than the bottom-up approach, but also less accurate. Is frequently used when there is a limited amount of detailed information about the project.
  • 18.
    6.4 > T&T:Estimation Methodologies Analogous Estimating Parametric Estimating Estimate the duration or cost of an activity or a project using historical data from a similar activity or project. Most reliable when the previous activities are similar in fact and not just in appearance, and the project team members preparing the estimates have the needed expertise. Provide an increased level of accuracy due to the statistical nature of the estimating technique (using statistical relationship between historical data and other variables to calculate an estimate for activity parameters, such as cost, budget, and duration).
  • 19.
    6.4 > T&T:Estimation Methodologies (2) Three-point estimating: The accuracy of single-point duration estimates may be improved by considering estimation uncertainty and risk. Using three-point estimates helps define an approximate range for an activity’s duration ● Most likely (tM). This estimate is based on the duration of the activity, given the resources likely to be assigned, their productivity, realistic expectations of availability for the activity, dependencies on other participants, and interruptions. ● Optimistic (tO). The activity duration based on analysis of the best-case scenario for the activity. ● Pessimistic (tP). The duration based on analysis of the worst-case scenario for the activity.
  • 20.
    6.4 > T&T:Estimation Methodologies (3) Three-point estimating (cont.): Depending on the assumed distribution of values within the range of the three estimates, the expected duration, tE, can be calculated. ● Simple average (triangular distribution): tE = (tO + tM + tP) / 3 ● PERT (beta distribution): tE = (tO + tM*4 + tP) / 6
  • 21.
    6.4 > T&T:Estimation Units ● T-shirt Size: use S, M, L, XL as a way to bucket the unit of work. ● Story Point: Story points rate the relative effort of work in a Fibonacci-like format: 0, 0.5, 1, 2, 3, 5, 8, 13, 20, 40, 100. ● Time Bucket: simply using days and hours to estimate the effort of work. Common principle: if an effort is big enough to fall in any of bucket, try to break it down and rescope. Common pitfall: the T-shirt size or the story point is commonly mistaken to associate to an equivalent amount in hours or days (e.g., S = 0-2 weeks; M = 2-4 weeks; 1 point = 2 hours; 2 points = 5 hours…). There is no standard equivalence. It is up to each team to decide and agree on the relative effort for each T-shirt size/story point value.
  • 22.
    6.4 > T&T:Estimation accuracy level The expected accuracy level of the estimations depends on the purpose of the estimation (or the stage of the project). For example Leve l Purpose Method Accuracy Estimation effort L1 Strategic planning to calculate ROI among different initiatives White boarding with stakeholders and technical leads 50-50% 1h L2 Rough estimates to date for internal forecasting Design docs, test cases, user stories, story points accumulation 70-30% 1w L3 Accurate estimates to date for client facing L2 + API definitions, method signatures and contracts, and no unknowns 90-10% 1m
  • 23.
    6.4 > T&T:combining multiple estimation techniques No single project estimation technique will suit all projects. To achieve the most accurate results we suggest using and combining a few of these estimating techniques to provide increased accuracy to your project estimates. For instance, at the early stage of the project, you can use the analogous methodology (top-down approach) using the T-shirt sizes or Story points to estimate the effort of the work. As the work is progressively elaborated, estimations in days/hours can be provided to lower-level components.
  • 24.
    6.4 > T&T:Estimating Technique Sample Statistically learnt from the historical data
  • 25.
    6.4 > T&T:Other techniques ● Expert Judgment ● Data Analysis ○ Alternative analysis ○ Reserve analysis ● Decision Making ○ Fist of five (or fist to five) ● Meetings
  • 26.
    6.4 > T&T:Reserve Analysis Determine the amount of contingency and management reserve needed for the project. ● Contingency Reserve: is account for schedule uncertainty, allocated for identified risks that are accepted - associated with the known-unknowns. ○ Contingency reserves may be separated from the individual activities and aggregated. ○ The contingency reserve may be a percentage of the estimated activity duration or a fixed number of work periods. ○ The contingency reserve is included in the schedule baseline but should be clearly identified in the schedule documentation. ○ As more precise information about the project becomes available, the contingency reserve may be used, reduced, or eliminated.
  • 27.
    6.4 > T&T:Reserve Analysis (2) ● Management Reserve: a specified amount of the project budget withheld for management control purposes and is reserved for unforeseen work (unknown unknowns) that is within scope of the project. ○ Management Reserve is not included in the schedule baseline, but is part of the overall project duration requirements. ○ Depending on contract terms, use of management reserves may require a change to the schedule baseline.

Editor's Notes

  • #2 The definitions are quoted from PMBOKⓇ Guide P129 (165)
  • #4 P195 (231)
  • #5 P195 (231)
  • #6 P196 (232)
  • #7 P196 (232)
  • #8 P197 (233) Sometimes, the intrinsic nature of the work (i.e., constraints imposed on the duration, effort involved, or number of resources) will take a predetermined amount of time to complete regardless of the resource allocation (e.g., a 24-hour stress test). Law of diminishing returns The law of diminishing returns is an economic principle stating that as investment in a particular area increases, the rate of profit from that investment, after a certain point, cannot continue to increase if other variables remain at a constant. As investment continues past that point, the return diminishes progressively. See a well-studied example of throwing more headcount at software development: https://en.wikipedia.org/wiki/The_Mythical_Man-Month See also https://searchcustomerexperience.techtarget.com/definition/law-of-diminishing-returns The graph is quoted from http://blog.plataformatec.com.br/2017/01/the-law-of-diminishing-returns-and-its-impact-on-projects/ Number of resources: Increasing the number of resources to twice the original number of the resources does not always reduce the time by half, as it may increase extra duration due to risk, and at some point adding too many resources to the activity may increase duration due to knowledge transfer, learning curve, additional coordination, and other factors involved. Advances in technology: This may also play an important role in determining duration estimates. For example, an increase in the output of a manufacturing plant may be achieved by procuring the latest advances in technology, which may impact duration and resource needs. Motivation of staff: The project manager also needs to be aware of Student Syndrome—or procrastination— when people start to apply themselves only at the last possible moment before the deadline, and Parkinson’s Law where work expands to fill the time available for its completion.
  • #9 Quoted from: http://blog.plataformatec.com.br/2017/01/the-law-of-diminishing-returns-and-its-impact-on-projects/
  • #10 P185 (221)
  • #11 P203 (239)
  • #12 P204 (240)
  • #13 P204 (240)
  • #14 P198 (234)
  • #16 P200 (236)
  • #17 https://blog.forecast.it/project-estimation-techniques-101-learn-the-basics
  • #18 P202 (238)
  • #19 P200, 201 (236, 237)
  • #20 P201 (237)
  • #21 PERT = Project/Program Evaluation and Review Technique The image is taken from https://www.isixsigma.com/methodology/project-management/better-project-management-through-beta-distribution/
  • #22 See more resources See the step 1 - Identify a Base Story in here https://rubygarage.org/blog/how-to-estimate-with-story-points https://medium.com/radius-engineering/project-estimation-through-t-shirt-size-ea496c631428 https://www.atlassian.com/agile/project-management/estimation
  • #23 The example is quoted from https://medium.com/radius-engineering/project-estimation-through-t-shirt-size-ea496c631428
  • #24 Reference: https://blog.forecast.it/project-estimation-techniques-101-learn-the-basics
  • #25 See the spreadsheet here: https://docs.google.com/spreadsheets/d/1SXHwMZVfiUpAlyOqwGzPah4ISU1F914GeHUmhqeMdac/edit#gid=0