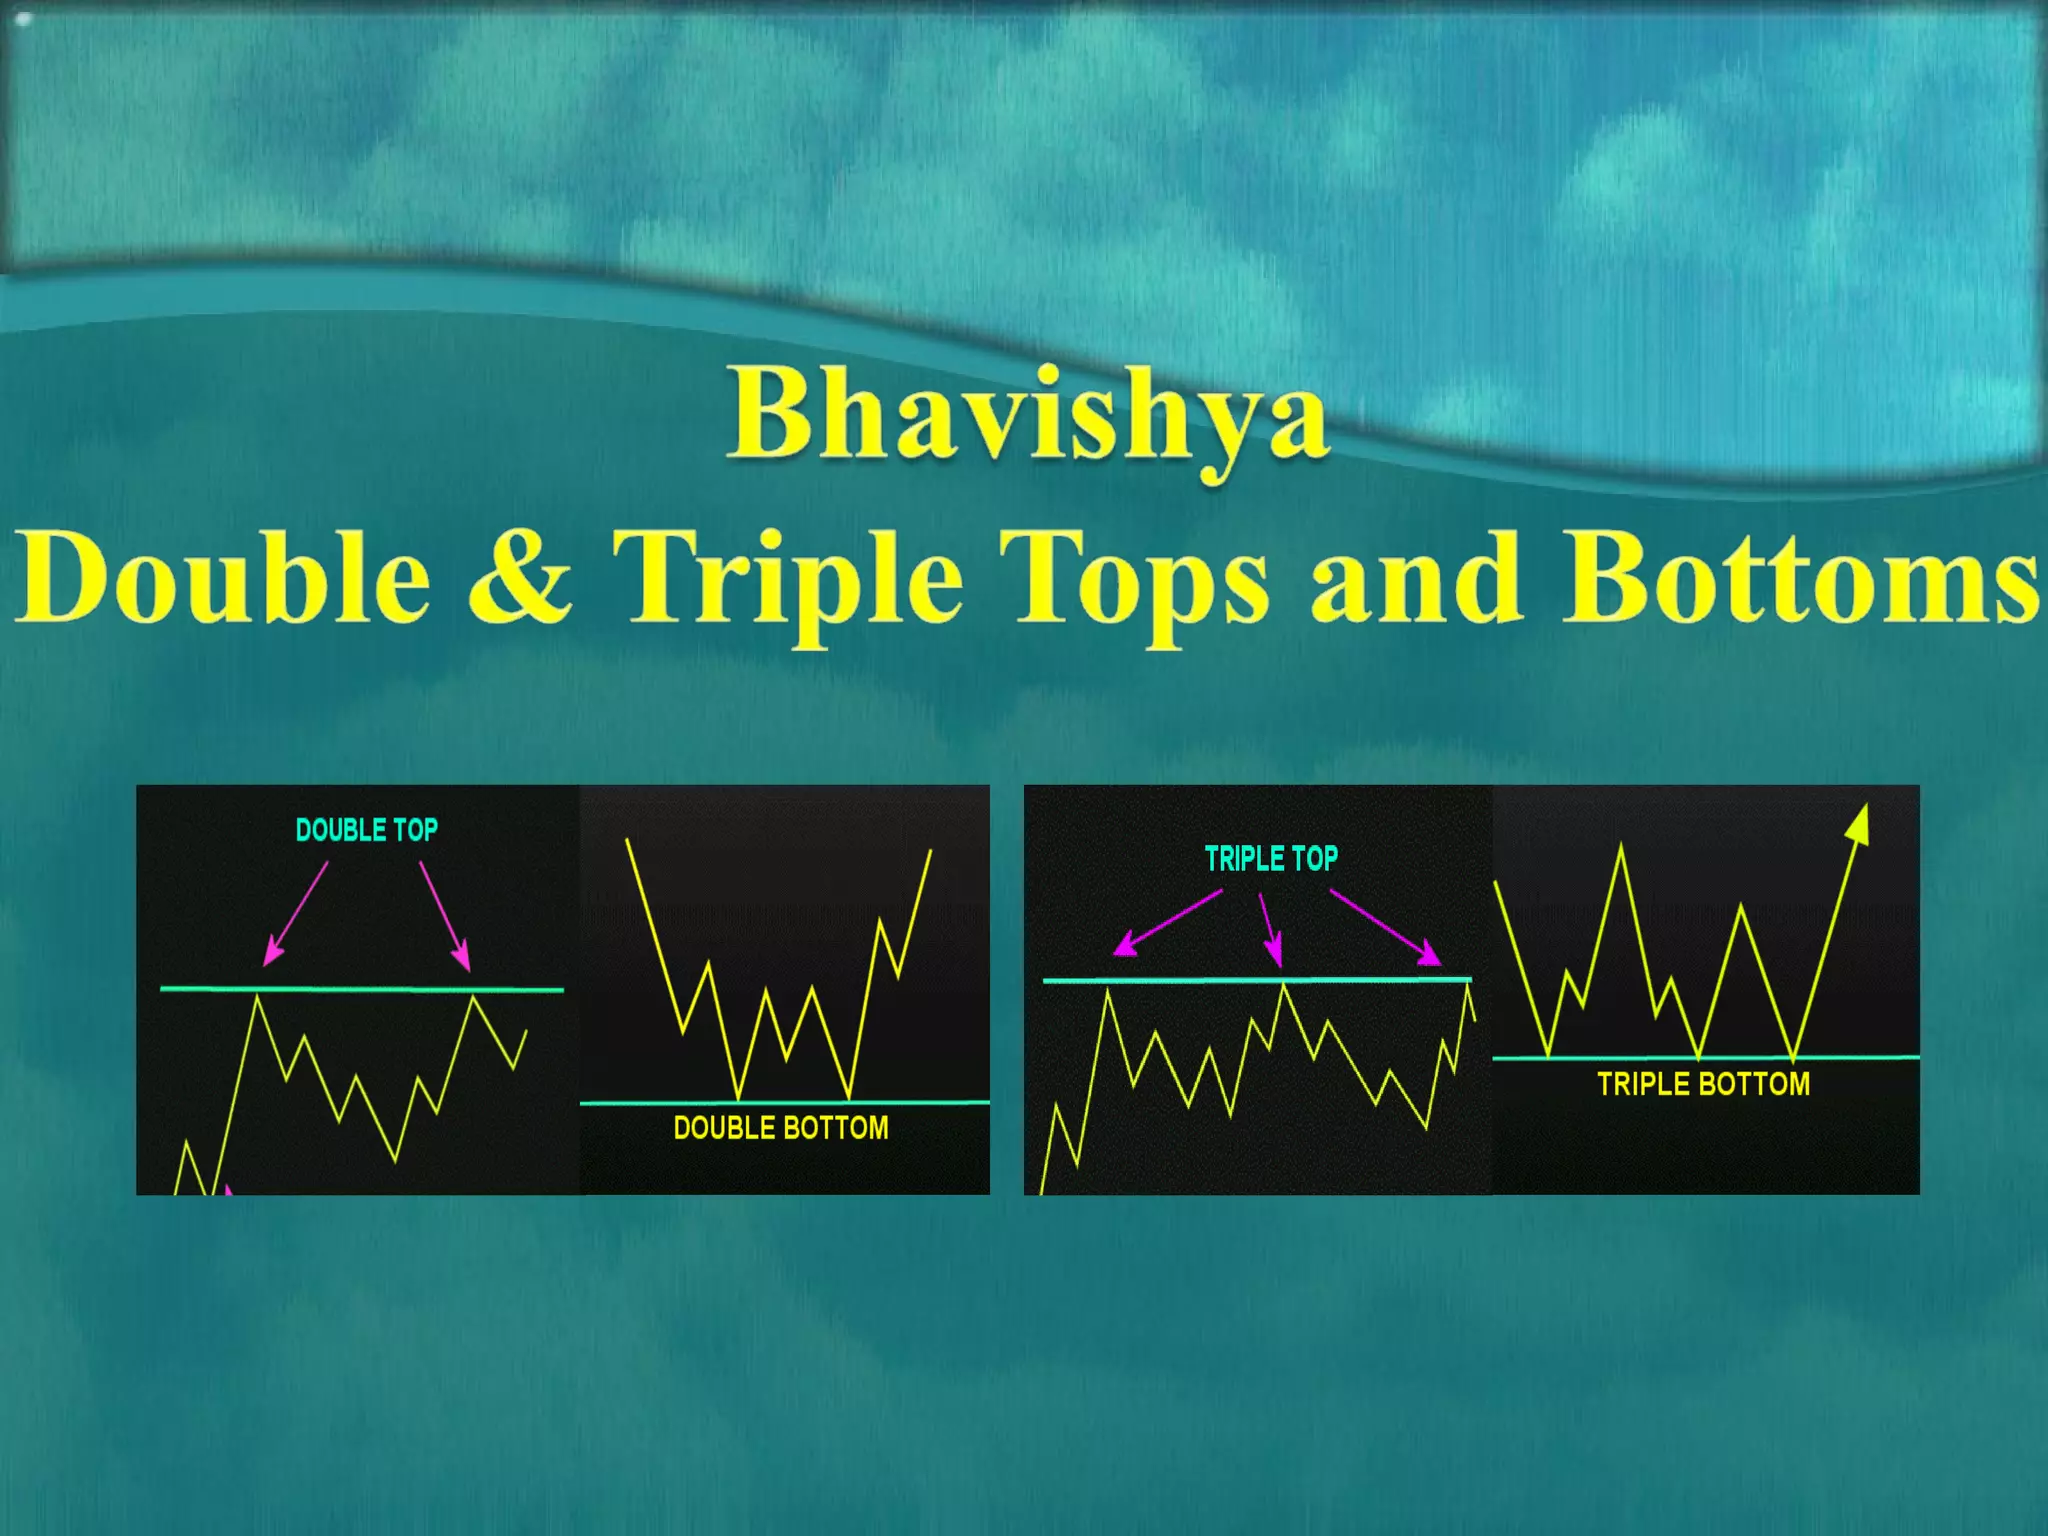
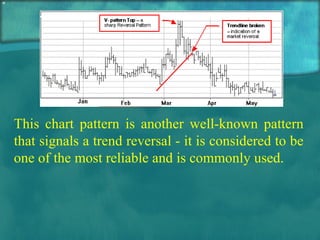
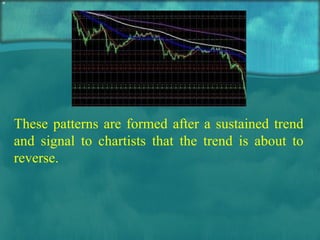
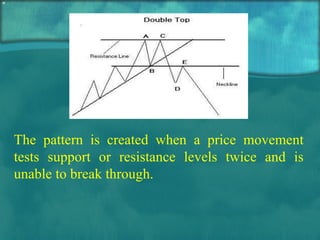
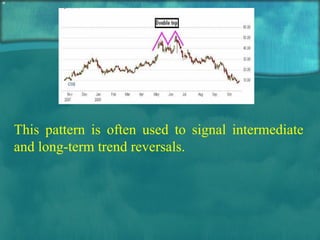
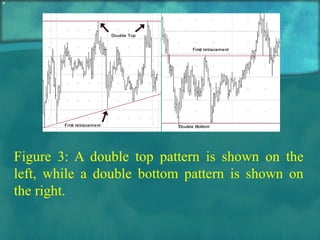
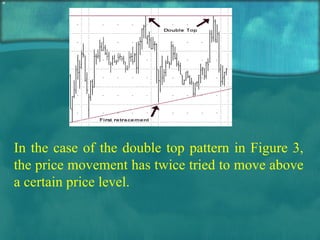
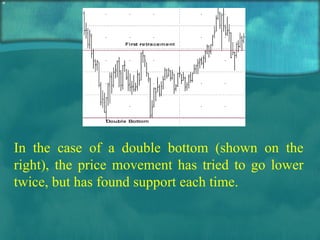
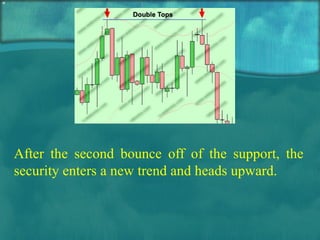
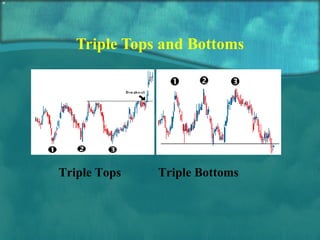
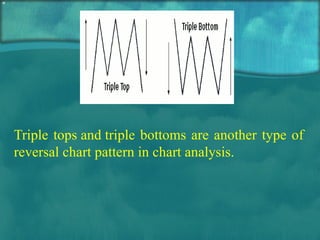
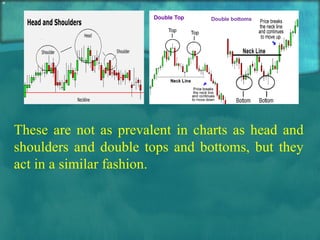
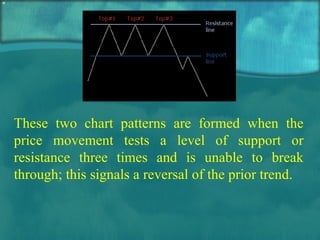
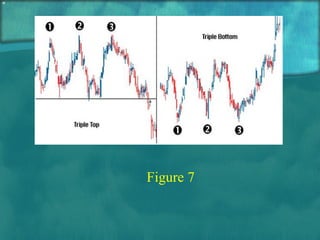
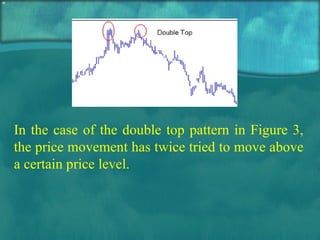
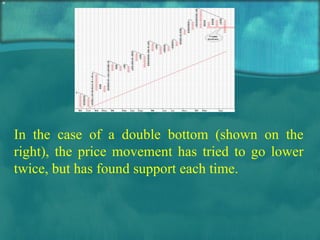
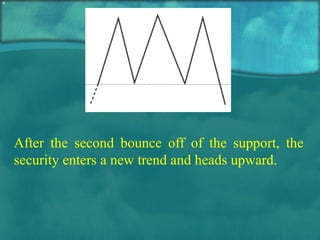
The document discusses chart patterns that indicate trend reversals, specifically focusing on double tops and bottoms, as well as triple tops and bottoms. These patterns form when price movements test support or resistance levels multiple times without breaking through, signaling a potential reversal. Double tops suggest a downward trend after two failed attempts to rise, while double bottoms indicate an upward trend following two successful tests of support.