Bhavishya - Cup and Handle
•Download as PPT, PDF•
2 likes•334 views
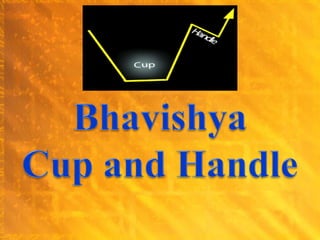
A cup and handle chart is a bullish continuation pattern in which the upward trend has paused but will continue in an upward direction once the pattern is confirmed.
Report
Share
Report
Share

Recommended
Learn the best day trading skills
http://www.marketgeeks.com - many day trading courses and seminars promise to teach you how to day trade successfully. Market geeks delivers the best day trading education to teach you the the skills you need to day trade the right way.
Stock chart pattern recognition
We bring to you the best Stock chart pattern recognition software available in the market. The pattern recognition process we follow is quite subjective in nature.
Bhavishya - Double & Triple Tops and Bottoms
Double Tops and Bottoms chart pattern is another well-known pattern that signals a trend reversal - it is considered to be one of the most reliable and is commonly used.
Chart pattern
We can offer you free access to the chart patterns by buying or selling into perception and by extending the forces of demand and supply in any single picture.
Best Swing Trading Indicators and Oscillators
The best swing trading strategies are the ones that allow you to trade and profit from your beliefs about the market. I have added some of the most popular swing trading indicators as a guide for you to explore. The swing trading indicators listed here focus on trend trading, volatility, and overbought/oversold conditions.
Japanese candlesticks-cheat-sheet
This document defines and describes various candlestick patterns used in technical analysis for stock trading, including bullish patterns like hammer and piercing line that indicate reversals from downtrends, as well as bearish patterns like hanging man, dark cloud cover, and doji variations that signal potential trend changes. It provides brief explanations of common candlestick formations and their implications for identifying bullish or bearish market momentum.
Pull Back Swing Trading Strategy I The Only Way To Trade Stocks and E-Mini Re...
Visit Us at http://MarketGeeks.com for professional trading education.
The 4 by 4 Retracement or pullback strategy works equally well with stocks and index futures contracts. Both end of day and intra-day time frame work well.
RSI Strategy
The document introduces the RSI indicator strategy for trend reversals on timeframes of 5-15 minutes for currency pairs like EURUSD and GBPUSD. It explains that RSI shows when the price is overbought or oversold, signaling trend reversals back within its 30-70 trading range. It provides instructions on how to set up the RSI indicator on a 1-minute candle chart using a period of 5, and describes buying put options when RSI drops below 70 from overbought conditions or call options when RSI rises above 30 from oversold conditions.
Keep Your Trading Simple Like The Big Players
- Trading can involve simple patterns, entries, risk reduction, and exits, but managing risk and other variables that make up the act of trading requires work.
- A simple uptrend was present in the USDCAD market over recent weeks, with large momentum moves, however the past 10 weeks have been in a pause.
- When the channel formed by the recent uptrend was broken with momentum, it provided a signal to enter a long trade, with the trade being exited for a profit of 134 pips.
Chart pattern part-1
Seperti yang telah kita pelajari sebelumnya bahwa Bermain forex tanpa mengetahui analisa berarti kita melakukan gambling atau untung-untungan. Dan jelas, dengan cara ini kemungkinan besar akan berujung pada kerugian. Sebelum anda memulai aktivitas trading Forex, anda wajib mengetahui konsep analisa yang akan membantu anda menghasilkan trading yang menguntungkan alias lebih banyak untung daripada ruginya ;).
Secara garis besar, analisa dalam forex trading dibagi menjadi dua cara, yaitu analisa Fundamental dan analisa Teknikal yang sebelumnya telah kita pelajari, Dan dari kedua analisa tersebut berpijak pada asumsi yang berbeda satu sama lain.
Masih dalam bahasan Analisa Teknikal, Mempelajari analisa teknikal pada dunia trading memang seperti tidak pernah selesai. Begitulah, seperti ilmu-ilmu pada umumnya, memang pastinya akan selalu bertambah untuk bisa kita gunakan dalam kegiatan trading sehari-hari. Oleh karena itulah, pada bahasan kali ini, kita akan lebih jauh membahas mengenai pola grafik pada analisa teknikal.
Pola grafik pada chart MetaTrader pastinya akan membingungkan pada saat pertama kali dilihat. Namun di balik semua itu, terdapat hal-hal yang jika bisa kita pahami, maka akan membawa pengaruh besar terhadap keputusan trading kita nantinya. Seperti garis naik, pin bar turun, indikator garis dan lainnya yang sebenarnya memperlihatkan suatu bentuk yang disebut pola. Pola ini biasanya terjadi berulang, dan dari sanalah para trader dapat melakukan analisa dan memperkirakan seperti apa pola yang terjadi di masa selanjutnya.
Profit From Pullback Trading
http://www.premiertraderuniversity.com/ptucourse -- PTU Trading Course!
What is the fundamental pattern of any market that is trending? Depends on the direction, right?
If a market is trending up, we expect to see higher highs and lows and the downswings to be relatively the same.
Flip what I just mentioned over and you have a market that is heading down.
This is certainly basic knowledge that any trader should know….and be able to profit from and I want to show you how.
http://www.netpicks.com/trading-article/trading-pullbacks-profit/
Technically speaking
Technical analysis is the forecasting of future asset prices based on past price movements. It uses charts, indicators, and patterns to analyze supply and demand forces influencing prices over time. The objectives are to determine the direction and extent of price trends, as well as when trends may reverse. Key aspects of technical analysis include identifying support and resistance levels, trendlines, moving averages, and common patterns like head and shoulders and triangles. Volume analysis and indicators provide additional context for interpreting price charts and anticipating trend changes.
Stock Chart (CCI indicator)
Stock chart illustrating how to use the Commodity
Channel Index (CCI) indicator; and avoid common
day or swing trading mistakes.
Learn more.
http://www.dayprotraders.com
How to trade currencies short term
The document analyzes recent stock market trends. It finds that 417 stocks are hitting 1-year highs, compared to only 50 hitting 1-year lows, demonstrating that the current rally is broad-based across many sectors and stock values. Only the beverage sector showed decreased value recently. This suggests the market will likely see a gentle correction rather than a fast, volatile drop, as the rally's strength is driven by widespread gains, not a few influential stocks. The author advises traders to take short-term positions and avoid initiating long-term holds until after the expected upcoming correction.
Technical Analysis (basic)
Analisa teknikal menggunakan data historis harga, volume, dan lainnya untuk memprediksi arah pergerakan harga di masa depan. Terdapat dua pendekatan utama yaitu subjektif yang menganalisis pola harga dan garis penunjang serta mekanik yang menggunakan indikator seperti moving average dan oscillator. Analisa teknikal meyakini bahwa harga mendiskon semua informasi dan sejarah akan berulang.
Fear & Greed
"Financial intelligence is 90% emotional IQ and 10% Technical IQ.
What determines what we do and who we are, is how we as individuals respond to our emotions".
Robert Kyiosaki
Whether we’re talking about economic confidence or investor optimism, emotions drive the marketplace!
634268797027443776(1)
This document discusses the benefits of technical analysis and chart patterns over fundamental analysis for making trading decisions. It provides an example of a stock that was traded over the course of a year, demonstrating how identifying buy and sell opportunities from chart patterns could have resulted in gains of 159% compared to a 13% gain from a simple buy and hold strategy. The document promotes learning the seven key chart patterns presented in this book as tools for identifying trading opportunities and making well-timed entry and exit decisions.
Bhavishya - Dow Theory
Dow theory was formulated from a series of Wall Street Journal editorials authored by Charles H. Dow from 1900 until the time of his death in 1902. Dow theory identifies three trends within the market: primary, secondary and minor.
Bhavishya - Rounding Bottoms
A rounding bottom chart pattern looks similar to a cup and handle pattern but without the handle. A rounding bottom, also referred to as a saucer bottom, is a long-term reversal pattern that signals a shift from a downward trend to an upward trend.
Bhavishya - Head & Shoulders
Head and shoulders is a reversal chart pattern that when formed, signals that the security is likely to move against the previous trend.
Bhavishya- Elliot Wave Theory
The Elliott Wave theory is based on how groups of people behave. Mass psychology with swings from pessimism to optimism and back is described as the basis for the patterns the Elliott wave is suppose to identify.
Bhavishya- Technical Analysis
Technical analysis is a method of evaluating securities by analyzing the statistics generated by market activity, such as past prices and volume. Technical analysts do not attempt to measure a security's intrinsic value, but instead use charts and other tools to identify patterns that can suggest future activity
Bhavishya- Fundamental analysis
Fundamental analysis is a method of evaluating a security or asset by attempting to measure its intrinsic value by examining related economic, financial and other qualitative and quantitative factors.
一比一原版(QMUE毕业证书)英国爱丁堡玛格丽特女王大学毕业证文凭如何办理
永久可查学历认证【微信:A575476】【(QMUE毕业证书)英国爱丁堡玛格丽特女王大学毕业证成绩单Offer】【微信:A575476】(留信学历认证永久存档查询)采用学校原版纸张、特殊工艺完全按照原版一比一制作(包括:隐形水印,阴影底纹,钢印LOGO烫金烫银,LOGO烫金烫银复合重叠,文字图案浮雕,激光镭射,紫外荧光,温感,复印防伪)行业标杆!精益求精,诚心合作,真诚制作!多年品质 ,按需精细制作,24小时接单,全套进口原装设备,十五年致力于帮助留学生解决难题,业务范围有加拿大、英国、澳洲、韩国、美国、新加坡,新西兰等学历材料,包您满意。
【业务选择办理准则】
一、工作未确定,回国需先给父母、亲戚朋友看下文凭的情况,办理一份就读学校的毕业证【微信:A575476】文凭即可
二、回国进私企、外企、自己做生意的情况,这些单位是不查询毕业证真伪的,而且国内没有渠道去查询国外文凭的真假,也不需要提供真实教育部认证。鉴于此,办理一份毕业证【微信:A575476】即可
三、进国企,银行,事业单位,考公务员等等,这些单位是必需要提供真实教育部认证的,办理教育部认证所需资料众多且烦琐,所有材料您都必须提供原件,我们凭借丰富的经验,快捷的绿色通道帮您快速整合材料,让您少走弯路。
留信网认证的作用:
1:该专业认证可证明留学生真实身份
2:同时对留学生所学专业登记给予评定
3:国家专业人才认证中心颁发入库证书
4:这个认证书并且可以归档倒地方
5:凡事获得留信网入网的信息将会逐步更新到个人身份内,将在公安局网内查询个人身份证信息后,同步读取人才网入库信息
6:个人职称评审加20分
7:个人信誉贷款加10分
8:在国家人才网主办的国家网络招聘大会中纳入资料,供国家高端企业选择人才
→ 【关于价格问题(保证一手价格)
我们所定的价格是非常合理的,而且我们现在做得单子大多数都是代理和回头客户介绍的所以一般现在有新的单子 我给客户的都是第一手的代理价格,因为我想坦诚对待大家 不想跟大家在价格方面浪费时间
对于老客户或者被老客户介绍过来的朋友,我们都会适当给一些优惠。
选择实体注册公司办理,更放心,更安全!我们的承诺:可来公司面谈,可签订合同,会陪同客户一起到教育部认证窗口递交认证材料,客户在教育部官方认证查询网站查询到认证通过结果后付款,不成功不收费!
8328958814KALYAN MATKA | MATKA RESULT | KALYAN
8328958814KALYAN MATKA | MATKA RESULT | KALYAN KALYAN MATKA | MATKA RESULT | KALYAN MATKA TIPS | SATTA MATKA | MATKA.COM | MATKA PANA
Pro Tips for Effortless Contract Management
Tired of chasing down expiring contracts and drowning in paperwork? Mastering contract management can significantly enhance your business efficiency and productivity. This guide unveils expert secrets to streamline your contract management process. Learn how to save time, minimize risk, and achieve effortless contract management.
DearbornMusic-KatherineJasperFullSailUni
My powerpoint presentation for my Music Retail and Distribution class at Full Sail University
The latest Heat Pump Manual from Newentide
𝐔𝐧𝐯𝐞𝐢𝐥 𝐭𝐡𝐞 𝐅𝐮𝐭𝐮𝐫𝐞 𝐨𝐟 𝐄𝐧𝐞𝐫𝐠𝐲 𝐄𝐟𝐟𝐢𝐜𝐢𝐞𝐧𝐜𝐲 𝐰𝐢𝐭𝐡 𝐍𝐄𝐖𝐍𝐓𝐈𝐃𝐄’𝐬 𝐋𝐚𝐭𝐞𝐬𝐭 𝐎𝐟𝐟𝐞𝐫𝐢𝐧𝐠𝐬
Explore the details in our newly released product manual, which showcases NEWNTIDE's advanced heat pump technologies. Delve into our energy-efficient and eco-friendly solutions tailored for diverse global markets.
More Related Content
Viewers also liked
Keep Your Trading Simple Like The Big Players
- Trading can involve simple patterns, entries, risk reduction, and exits, but managing risk and other variables that make up the act of trading requires work.
- A simple uptrend was present in the USDCAD market over recent weeks, with large momentum moves, however the past 10 weeks have been in a pause.
- When the channel formed by the recent uptrend was broken with momentum, it provided a signal to enter a long trade, with the trade being exited for a profit of 134 pips.
Chart pattern part-1
Seperti yang telah kita pelajari sebelumnya bahwa Bermain forex tanpa mengetahui analisa berarti kita melakukan gambling atau untung-untungan. Dan jelas, dengan cara ini kemungkinan besar akan berujung pada kerugian. Sebelum anda memulai aktivitas trading Forex, anda wajib mengetahui konsep analisa yang akan membantu anda menghasilkan trading yang menguntungkan alias lebih banyak untung daripada ruginya ;).
Secara garis besar, analisa dalam forex trading dibagi menjadi dua cara, yaitu analisa Fundamental dan analisa Teknikal yang sebelumnya telah kita pelajari, Dan dari kedua analisa tersebut berpijak pada asumsi yang berbeda satu sama lain.
Masih dalam bahasan Analisa Teknikal, Mempelajari analisa teknikal pada dunia trading memang seperti tidak pernah selesai. Begitulah, seperti ilmu-ilmu pada umumnya, memang pastinya akan selalu bertambah untuk bisa kita gunakan dalam kegiatan trading sehari-hari. Oleh karena itulah, pada bahasan kali ini, kita akan lebih jauh membahas mengenai pola grafik pada analisa teknikal.
Pola grafik pada chart MetaTrader pastinya akan membingungkan pada saat pertama kali dilihat. Namun di balik semua itu, terdapat hal-hal yang jika bisa kita pahami, maka akan membawa pengaruh besar terhadap keputusan trading kita nantinya. Seperti garis naik, pin bar turun, indikator garis dan lainnya yang sebenarnya memperlihatkan suatu bentuk yang disebut pola. Pola ini biasanya terjadi berulang, dan dari sanalah para trader dapat melakukan analisa dan memperkirakan seperti apa pola yang terjadi di masa selanjutnya.
Profit From Pullback Trading
http://www.premiertraderuniversity.com/ptucourse -- PTU Trading Course!
What is the fundamental pattern of any market that is trending? Depends on the direction, right?
If a market is trending up, we expect to see higher highs and lows and the downswings to be relatively the same.
Flip what I just mentioned over and you have a market that is heading down.
This is certainly basic knowledge that any trader should know….and be able to profit from and I want to show you how.
http://www.netpicks.com/trading-article/trading-pullbacks-profit/
Technically speaking
Technical analysis is the forecasting of future asset prices based on past price movements. It uses charts, indicators, and patterns to analyze supply and demand forces influencing prices over time. The objectives are to determine the direction and extent of price trends, as well as when trends may reverse. Key aspects of technical analysis include identifying support and resistance levels, trendlines, moving averages, and common patterns like head and shoulders and triangles. Volume analysis and indicators provide additional context for interpreting price charts and anticipating trend changes.
Stock Chart (CCI indicator)
Stock chart illustrating how to use the Commodity
Channel Index (CCI) indicator; and avoid common
day or swing trading mistakes.
Learn more.
http://www.dayprotraders.com
How to trade currencies short term
The document analyzes recent stock market trends. It finds that 417 stocks are hitting 1-year highs, compared to only 50 hitting 1-year lows, demonstrating that the current rally is broad-based across many sectors and stock values. Only the beverage sector showed decreased value recently. This suggests the market will likely see a gentle correction rather than a fast, volatile drop, as the rally's strength is driven by widespread gains, not a few influential stocks. The author advises traders to take short-term positions and avoid initiating long-term holds until after the expected upcoming correction.
Technical Analysis (basic)
Analisa teknikal menggunakan data historis harga, volume, dan lainnya untuk memprediksi arah pergerakan harga di masa depan. Terdapat dua pendekatan utama yaitu subjektif yang menganalisis pola harga dan garis penunjang serta mekanik yang menggunakan indikator seperti moving average dan oscillator. Analisa teknikal meyakini bahwa harga mendiskon semua informasi dan sejarah akan berulang.
Fear & Greed
"Financial intelligence is 90% emotional IQ and 10% Technical IQ.
What determines what we do and who we are, is how we as individuals respond to our emotions".
Robert Kyiosaki
Whether we’re talking about economic confidence or investor optimism, emotions drive the marketplace!
634268797027443776(1)
This document discusses the benefits of technical analysis and chart patterns over fundamental analysis for making trading decisions. It provides an example of a stock that was traded over the course of a year, demonstrating how identifying buy and sell opportunities from chart patterns could have resulted in gains of 159% compared to a 13% gain from a simple buy and hold strategy. The document promotes learning the seven key chart patterns presented in this book as tools for identifying trading opportunities and making well-timed entry and exit decisions.
Viewers also liked (9)
More from shivamantri
Bhavishya - Dow Theory
Dow theory was formulated from a series of Wall Street Journal editorials authored by Charles H. Dow from 1900 until the time of his death in 1902. Dow theory identifies three trends within the market: primary, secondary and minor.
Bhavishya - Rounding Bottoms
A rounding bottom chart pattern looks similar to a cup and handle pattern but without the handle. A rounding bottom, also referred to as a saucer bottom, is a long-term reversal pattern that signals a shift from a downward trend to an upward trend.
Bhavishya - Head & Shoulders
Head and shoulders is a reversal chart pattern that when formed, signals that the security is likely to move against the previous trend.
Bhavishya- Elliot Wave Theory
The Elliott Wave theory is based on how groups of people behave. Mass psychology with swings from pessimism to optimism and back is described as the basis for the patterns the Elliott wave is suppose to identify.
Bhavishya- Technical Analysis
Technical analysis is a method of evaluating securities by analyzing the statistics generated by market activity, such as past prices and volume. Technical analysts do not attempt to measure a security's intrinsic value, but instead use charts and other tools to identify patterns that can suggest future activity
Bhavishya- Fundamental analysis
Fundamental analysis is a method of evaluating a security or asset by attempting to measure its intrinsic value by examining related economic, financial and other qualitative and quantitative factors.
More from shivamantri (6)
Recently uploaded
一比一原版(QMUE毕业证书)英国爱丁堡玛格丽特女王大学毕业证文凭如何办理
永久可查学历认证【微信:A575476】【(QMUE毕业证书)英国爱丁堡玛格丽特女王大学毕业证成绩单Offer】【微信:A575476】(留信学历认证永久存档查询)采用学校原版纸张、特殊工艺完全按照原版一比一制作(包括:隐形水印,阴影底纹,钢印LOGO烫金烫银,LOGO烫金烫银复合重叠,文字图案浮雕,激光镭射,紫外荧光,温感,复印防伪)行业标杆!精益求精,诚心合作,真诚制作!多年品质 ,按需精细制作,24小时接单,全套进口原装设备,十五年致力于帮助留学生解决难题,业务范围有加拿大、英国、澳洲、韩国、美国、新加坡,新西兰等学历材料,包您满意。
【业务选择办理准则】
一、工作未确定,回国需先给父母、亲戚朋友看下文凭的情况,办理一份就读学校的毕业证【微信:A575476】文凭即可
二、回国进私企、外企、自己做生意的情况,这些单位是不查询毕业证真伪的,而且国内没有渠道去查询国外文凭的真假,也不需要提供真实教育部认证。鉴于此,办理一份毕业证【微信:A575476】即可
三、进国企,银行,事业单位,考公务员等等,这些单位是必需要提供真实教育部认证的,办理教育部认证所需资料众多且烦琐,所有材料您都必须提供原件,我们凭借丰富的经验,快捷的绿色通道帮您快速整合材料,让您少走弯路。
留信网认证的作用:
1:该专业认证可证明留学生真实身份
2:同时对留学生所学专业登记给予评定
3:国家专业人才认证中心颁发入库证书
4:这个认证书并且可以归档倒地方
5:凡事获得留信网入网的信息将会逐步更新到个人身份内,将在公安局网内查询个人身份证信息后,同步读取人才网入库信息
6:个人职称评审加20分
7:个人信誉贷款加10分
8:在国家人才网主办的国家网络招聘大会中纳入资料,供国家高端企业选择人才
→ 【关于价格问题(保证一手价格)
我们所定的价格是非常合理的,而且我们现在做得单子大多数都是代理和回头客户介绍的所以一般现在有新的单子 我给客户的都是第一手的代理价格,因为我想坦诚对待大家 不想跟大家在价格方面浪费时间
对于老客户或者被老客户介绍过来的朋友,我们都会适当给一些优惠。
选择实体注册公司办理,更放心,更安全!我们的承诺:可来公司面谈,可签订合同,会陪同客户一起到教育部认证窗口递交认证材料,客户在教育部官方认证查询网站查询到认证通过结果后付款,不成功不收费!
8328958814KALYAN MATKA | MATKA RESULT | KALYAN
8328958814KALYAN MATKA | MATKA RESULT | KALYAN KALYAN MATKA | MATKA RESULT | KALYAN MATKA TIPS | SATTA MATKA | MATKA.COM | MATKA PANA
Pro Tips for Effortless Contract Management
Tired of chasing down expiring contracts and drowning in paperwork? Mastering contract management can significantly enhance your business efficiency and productivity. This guide unveils expert secrets to streamline your contract management process. Learn how to save time, minimize risk, and achieve effortless contract management.
DearbornMusic-KatherineJasperFullSailUni
My powerpoint presentation for my Music Retail and Distribution class at Full Sail University
The latest Heat Pump Manual from Newentide
𝐔𝐧𝐯𝐞𝐢𝐥 𝐭𝐡𝐞 𝐅𝐮𝐭𝐮𝐫𝐞 𝐨𝐟 𝐄𝐧𝐞𝐫𝐠𝐲 𝐄𝐟𝐟𝐢𝐜𝐢𝐞𝐧𝐜𝐲 𝐰𝐢𝐭𝐡 𝐍𝐄𝐖𝐍𝐓𝐈𝐃𝐄’𝐬 𝐋𝐚𝐭𝐞𝐬𝐭 𝐎𝐟𝐟𝐞𝐫𝐢𝐧𝐠𝐬
Explore the details in our newly released product manual, which showcases NEWNTIDE's advanced heat pump technologies. Delve into our energy-efficient and eco-friendly solutions tailored for diverse global markets.
The Most Inspiring Entrepreneurs to Follow in 2024.pdf
In a world where the potential of youth innovation remains vastly untouched, there emerges a guiding light in the form of Norm Goldstein, the Founder and CEO of EduNetwork Partners. His dedication to this cause has earned him recognition as a Congressional Leadership Award recipient.
Dpboss Matka Guessing Satta Matta Matka Kalyan Chart Indian Matka
Dpboss Matka Guessing Satta Matta Matka Kalyan Chart Indian Matka➒➌➎➏➑➐➋➑➐➐Dpboss Matka Guessing Satta Matka Kalyan Chart Indian Matka
9356872877Sattamatka.satta.matka.satta matka.kalyan weekly chart.kalyan chart.kalyan jodi chart.kalyan penal chart.kalyan today.kalyan open.fix satta.fix fix fix Satta matka nambar.PM Surya Ghar Muft Bijli Yojana: Online Application, Eligibility, Subsidies &...
PM Surya Ghar Muft Bijli Yojana: Online Application, Eligibility, Subsidies &...Ksquare Energy Pvt. Ltd.
During the budget session of 2024-25, the finance minister, Nirmala Sitharaman, introduced the “solar Rooftop scheme,” also known as “PM Surya Ghar Muft Bijli Yojana.” It is a subsidy offered to those who wish to put up solar panels in their homes using domestic power systems. Additionally, adopting photovoltaic technology at home allows you to lower your monthly electricity expenses. Today in this blog we will talk all about what is the PM Surya Ghar Muft Bijli Yojana. How does it work? Who is eligible for this yojana and all the other things related to this scheme?Adani Group's Active Interest In Increasing Its Presence in the Cement Manufa...
Time and again, the business group has taken up new business ventures, each of which has allowed it to expand its horizons further and reach new heights. Even amidst the Adani CBI Investigation, the firm has always focused on improving its cement business.
Satta Matka Dpboss Kalyan Matka Results Kalyan Chart
SATTA MATKA DPBOSS KALYAN MATKA RESULTS KALYAN CHART KALYAN MATKA MATKA RESULT KALYAN MATKA TIPS SATTA MATKA MATKA COM MATKA PANA JODI TODAY BATTA SATKA MATKA PATTI JODI NUMBER MATKA RESULTS MATKA CHART MATKA JODI SATTA COM INDIA SATTA MATKA MATKA TIPS MATKA WAPKA ALL MATKA RESULT LIVE ONLINE MATKA RESULT KALYAN MATKA RESULT DPBOSS MATKA 143 MAIN MATKA KALYAN MATKA RESULTS KALYAN CHART
AI Transformation Playbook: Thinking AI-First for Your Business
I dive into how businesses can stay competitive by integrating AI into their core processes. From identifying the right approach to building collaborative teams and recognizing common pitfalls, this guide has got you covered. AI transformation is a journey, and this playbook is here to help you navigate it successfully.
❼❷⓿❺❻❷❽❷❼❽ Dpboss Matka Result Satta Matka Guessing Satta Fix jodi Kalyan Fin...
❼❷⓿❺❻❷❽❷❼❽ Dpboss Matka Result Satta Matka Guessing Satta Fix jodi Kalyan Fin...❼❷⓿❺❻❷❽❷❼❽ Dpboss Kalyan Satta Matka Guessing Matka Result Main Bazar chart
❼❷⓿❺❻❷❽❷❼❽ Dpboss Matka Result Satta Matka Guessing Satta Fix jodi Kalyan Final ank Satta Matka Dpbos Final ank Satta Matta Matka 143 Kalyan Matka Guessing Final Matka Final ank Today Matka 420 Satta Batta Satta 143 Kalyan Chart Main Bazar Chart vip Matka Guessing Dpboss 143 Guessing Kalyan night Call 8867766396 Dpboss Matka Guessing Satta Matta Matka Kalyan Chart Indian M...
Dpboss Matka Guessing Satta Matta Matka Kalyan Chart Indian Matka
Satta Matka Dpboss Kalyan Matka Results Kalyan Chart
SATTA MATKA DPBOSS KALYAN MATKA RESULTS KALYAN CHART KALYAN MATKA MATKA RESULT KALYAN MATKA TIPS SATTA MATKA MATKA COM MATKA PANA JODI TODAY BATTA SATKA MATKA PATTI JODI NUMBER MATKA RESULTS MATKA CHART MATKA JODI SATTA COM INDIA SATTA MATKA MATKA TIPS MATKA WAPKA ALL MATKA RESULT LIVE ONLINE MATKA RESULT KALYAN MATKA RESULT DPBOSS MATKA 143 MAIN MATKA KALYAN MATKA RESULTS KALYAN CHART
Cover Story - China's Investment Leader - Dr. Alyce SU
In World Expo 2010 Shanghai – the most visited Expo in the World History
https://www.britannica.com/event/Expo-Shanghai-2010
China’s official organizer of the Expo, CCPIT (China Council for the Promotion of International Trade https://en.ccpit.org/) has chosen Dr. Alyce Su as the Cover Person with Cover Story, in the Expo’s official magazine distributed throughout the Expo, showcasing China’s New Generation of Leaders to the World.
The Role of White Label Bookkeeping Services in Supporting the Growth and Sca...
The Role of White Label Bookkeeping Services in Supporting the Growth and Sca...YourLegal Accounting
Effective financial management is important for expansion and scalability in the ever-changing US business environment. White Label Bookkeeping services is an innovative solution that is becoming more and more popular among businesses. These services provide a special method for managing financial duties effectively, freeing up companies to concentrate on their main operations and growth plans. We’ll look at how White Label Bookkeeping can help US firms expand and develop in this blog.Ellen Burstyn: From Detroit Dreamer to Hollywood Legend | CIO Women Magazine
In this article, we will dive into the extraordinary life of Ellen Burstyn, where the curtains rise on a story that's far more attractive than any script.
Recently uploaded (20)
The Most Inspiring Entrepreneurs to Follow in 2024.pdf
The Most Inspiring Entrepreneurs to Follow in 2024.pdf
Dpboss Matka Guessing Satta Matta Matka Kalyan Chart Indian Matka
Dpboss Matka Guessing Satta Matta Matka Kalyan Chart Indian Matka
PM Surya Ghar Muft Bijli Yojana: Online Application, Eligibility, Subsidies &...
PM Surya Ghar Muft Bijli Yojana: Online Application, Eligibility, Subsidies &...
Adani Group's Active Interest In Increasing Its Presence in the Cement Manufa...
Adani Group's Active Interest In Increasing Its Presence in the Cement Manufa...
Satta Matka Dpboss Kalyan Matka Results Kalyan Chart
Satta Matka Dpboss Kalyan Matka Results Kalyan Chart
AI Transformation Playbook: Thinking AI-First for Your Business
AI Transformation Playbook: Thinking AI-First for Your Business
❼❷⓿❺❻❷❽❷❼❽ Dpboss Matka Result Satta Matka Guessing Satta Fix jodi Kalyan Fin...
❼❷⓿❺❻❷❽❷❼❽ Dpboss Matka Result Satta Matka Guessing Satta Fix jodi Kalyan Fin...
Call 8867766396 Dpboss Matka Guessing Satta Matta Matka Kalyan Chart Indian M...
Call 8867766396 Dpboss Matka Guessing Satta Matta Matka Kalyan Chart Indian M...
Satta Matka Dpboss Kalyan Matka Results Kalyan Chart
Satta Matka Dpboss Kalyan Matka Results Kalyan Chart
Cover Story - China's Investment Leader - Dr. Alyce SU
Cover Story - China's Investment Leader - Dr. Alyce SU
The Role of White Label Bookkeeping Services in Supporting the Growth and Sca...
The Role of White Label Bookkeeping Services in Supporting the Growth and Sca...
Ellen Burstyn: From Detroit Dreamer to Hollywood Legend | CIO Women Magazine
Ellen Burstyn: From Detroit Dreamer to Hollywood Legend | CIO Women Magazine
Bhavishya - Cup and Handle
- 2. A cup and handle chart is a bullish continuation pattern in which the upward trend has paused but will continue in an upward direction once the pattern is confirmed.
- 3. Figure 2 : Cup with handle
- 4. As you can see in Figure 2, this price pattern forms what looks like a cup, which is preceded by an upward trend.
- 5. The handle follows the cup formation and is formed by a generally downward/sideways movement in the security's price.
- 6. Once the price movement pushes above the resistance lines formed in the handle, the upward trend can continue.
- 7. There is a wide ranging time frame for this type of pattern, with the span ranging from several months to more than a year.