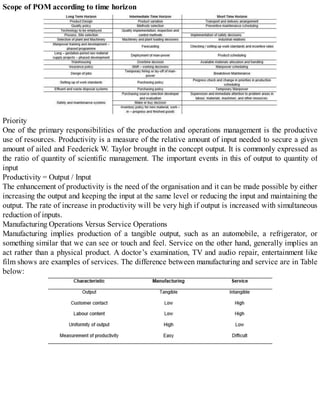
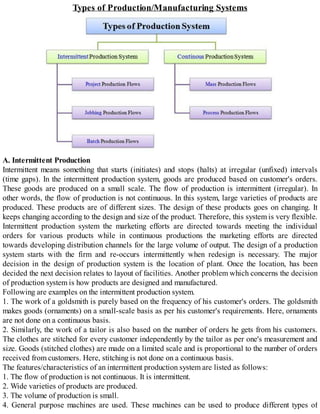
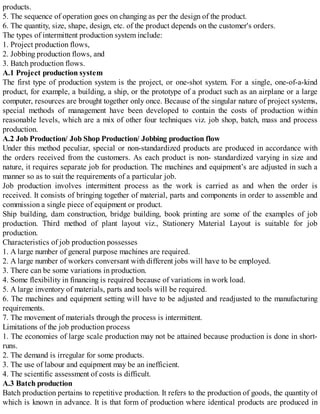
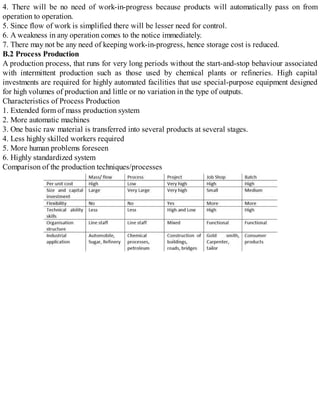
POM BBA MGSU
By Manish Tanwar
This Book is meant for students who are pursuing BBA course from MGS University, Bikaner. The
book covers various theoretical topics in the subject of Production and Operation Management. It is
recommended that the students use this book in consultation with their Guides for the numerical
portion of the syllabus.
Table of Contents
Production and Operation Management
Types of Production/Manufacturing Systems
Forecasting
Capacity Planning
Plant Location
Plant Layout
Production Planning and Control (PPC)
Aggregate Planning
Line Balancing
PERT and CPM: Techniques of Project Management
Inventory Management
Material Requirements Planning
Quality
Basic Quality Concepts
Fundamental Principles of Quality
Cost of Quality
Statistical quality control (SQC)
Statistical Process Control (SPC) Methods
Acceptance Sampling
Types of maintenance
Operational Management in service
Contemporary issues in Production Management
Production and Operation Management
Functions of Production and Operations Management
Production and operations management concerns not only with the production of goods and services
but also all the activities connected with the production. When the word ‘production’ is mentioned, it
brings in the things like factories, machines, equipment, assembly lines. This is nothing but things
related to manufacturing. In the past, emphasis was on manufacturing management, which
subsequently got changed into production management. Production concepts and techniques are being
applied to a wide range of activities and situations which have little or nothing to do with factories or
manufacturing. These activities resulted not in the realization of goods but in services like banking,
hotel management, health services, educations, transportation, recreating, government operations. Due
to the widening of the scope, the name was changed from production management into operations
management, where the concepts, tools and techniques are applied on diverse nature of activities.
First let us define production. This is a process or a set of procedures to be executed in order to
convert or transform a set of inputs into a pre-determined set of outputs in accordance with the
objectives assigned to the production system. Generally, a system consists of a transformation or
conversion process for a given input to be converted into the required output with a feedback
mechanism, so that any deviation or irregularities can be identified and corrected,
In the production environment the input may be labour, energy, capital, information and technology,
the transformation process is the production processes and the output may take the form of products or
services or processed information.
Operations management, with its widened scope, is responsible for the management of productive
systems, that is, it is responsible for systems which either create goods or private service or both.
The operations management personnel have the ultimate responsibility for the creating of goods or
services. The variety of jobs which the operations group will oversee will differ from one
organization to another. But the basic task of coordinating the use of resources through the
management process, which involves planning, organizing, staffing, directing and controlling.
Planning involved determining a future course of action. The planning process begins by deciding
what is desired and then designing the way for accomplishing that objective.
Organizing refers to the administrative structure of the organization. It involves putting the parts of
the system together in such a way that desired results can be achieved.
Staffing involves selection and training of personnel who will operate the system.
Directing refers to the release of commands or orders, making suggestions or otherwise motivating
subordinates to perform their assigned duties in a timely and efficient manner.
Controlling involves measuring the results of operations, deciding if they are acceptable and
instituting corrective action if need be.
Relationship between POM and other functions
There are three primary functions, which exist in most of the organizations and they are Operations,
Marketing and Finance. These three cannot be mutually exclusive and the functional overlap is
unavoidable. The level of overlapping varies from one organisation to another.
In addition to these three major functions of business organizations, the operation management
function has to interact with many supporting functions. The supporting functions are research and
development, product design, industrial engineering, maintenance, personnel, accounting, costing,
materials, etc. The level of interaction and presence of some departments may be Exchange of
information on current and future decided based on the size of the organization, product line and type
of management.
The operations management personnel and the other major of support functional personnel have to
necessarily interact with each other in the activities identified below:
Finance
• Economic analysis of investment products
• Budgeting and timing of funds
• Provision and release of funds
Marketing
• Developing and maintaining the market
• Advertisement and sales promotion
• Sales forecast
• Production improvement / new product development.
Research and Development
• Idea generation
• Product formulations
• Prototype Development
• Test Marketing
Product Design
• Preliminary and final design
• Detailed Drawings
• Assembly and parts manufacturing drawings
• Quality standards
• Exchange of information on current and future capabilities
Maintenance
• Evolution of maintenance policy
• Implementation for general upkeep of equipment
Industrial Engineering
• Scheduling
• Setting up of standards
• Work methods: time study
• Quality audit and contact
• Material handling
Materials
• Procurement of materials and equipment
• Inventory control
• Economic order quantity and timing of purchase
• Inspection and clearance
• Vendor evaluation and rating
Personnel
• Recruitment and training
• Labour relations
• Wage and Salary administration
• Manpower Projections
Accounting and Costing
• Preparation of financial statements
• Cost data on labour, materials and overhead
• Report on scrap, downtime and inventories
• Payables, receivables management
• Insurance
Scope of POM according to time horizon
Priority
One of the primary responsibilities of the production and operations management is the productive
use of resources. Productivity is a measure of the relative amount of input needed to secure a given
amount of ailed and Feederick W. Taylor brought in the concept output. It is commonly expressed as
the ratio of quantity of scientific management. The important events in this of output to quantity of
input
Productivity = Output / Input
The enhancement of productivity is the need of the organisation and it can be made possible by either
increasing the output and keeping the input at the same level or reducing the input and maintaining the
output. The rate of increase in productivity will be very high if output is increased with simultaneous
reduction of inputs.
Manufacturing Operations Versus Service Operations
Manufacturing implies production of a tangible output, such as an automobile, a refrigerator, or
something similar that we can see or touch and feel. Service on the other hand, generally implies an
act rather than a physical product. A doctor’s examination, TV and audio repair, entertainment like
film shows are examples of services. The difference between manufacturing and service are in Table
below:
Types of Production/Manufacturing Systems
A. Intermittent Production
Intermittent means something that starts (initiates) and stops (halts) at irregular (unfixed) intervals
(time gaps). In the intermittent production system, goods are produced based on customer's orders.
These goods are produced on a small scale. The flow of production is intermittent (irregular). In
other words, the flow of production is not continuous. In this system, large varieties of products are
produced. These products are of different sizes. The design of these products goes on changing. It
keeps changing according to the design and size of the product. Therefore, this system is very flexible.
Intermittent production system the marketing efforts are directed towards meeting the individual
orders for various products while in continuous productions the marketing efforts are directed
towards developing distribution channels for the large volume of output. The design of a production
system starts with the firm and re-occurs intermittently when redesign is necessary. The major
decision in the design of production system is the location of plant. Once the location, has been
decided the next decision relates to layout of facilities. Another problem which concerns the decision
of production system is how products are designed and manufactured.
Following are examples on the intermittent production system.
1. The work of a goldsmith is purely based on the frequency of his customer's orders. The goldsmith
makes goods (ornaments) on a small-scale basis as per his customer's requirements. Here, ornaments
are not done on a continuous basis.
2. Similarly, the work of a tailor is also based on the number of orders he gets from his customers.
The clothes are stitched for every customer independently by the tailor as per one's measurement and
size. Goods (stitched clothes) are made on a limited scale and is proportional to the number of orders
received from customers. Here, stitching is not done on a continuous basis.
The features/characteristics of an intermittent production system are listed as follows:
1. The flow of production is not continuous. It is intermittent.
2. Wide varieties of products are produced.
3. The volume of production is small.
4. General purpose machines are used. These machines can be used to produce different types of
products.
5. The sequence of operation goes on changing as per the design of the product.
6. The quantity, size, shape, design, etc. of the product depends on the customer's orders.
The types of intermittent production system include:
1. Project production flows,
2. Jobbing production flows, and
3. Batch production flows.
A.1 Project production system
The first type of production system is the project, or one-shot system. For a single, one-of-a-kind
product, for example, a building, a ship, or the prototype of a product such as an airplane or a large
computer, resources are brought together only once. Because of the singular nature of project systems,
special methods of management have been developed to contain the costs of production within
reasonable levels, which are a mix of other four techniques viz. job shop, batch, mass and process
production.
A.2 Job Production/ Job Shop Production/ Jobbing production flow
Under this method peculiar, special or non-standardized products are produced in accordance with
the orders received from the customers. As each product is non- standardized varying in size and
nature, it requires separate job for production. The machines and equipment’s are adjusted in such a
manner so as to suit the requirements of a particular job.
Job production involves intermittent process as the work is carried as and when the order is
received. It consists of bringing together of material, parts and components in order to assemble and
commission a single piece of equipment or product.
Ship building, dam construction, bridge building, book printing are some of the examples of job
production. Third method of plant layout viz., Stationery Material Layout is suitable for job
production.
Characteristics of job production possesses
1. A large number of general purpose machines are required.
2. A large number of workers conversant with different jobs will have to be employed.
3. There can be some variations in production.
4. Some flexibility in financing is required because of variations in work load.
5. A large inventory of materials, parts and tools will be required.
6. The machines and equipment setting will have to be adjusted and re​adjusted to the manufacturing
requirements.
7. The movement of materials through the process is intermittent.
Limitations of the job production process
1. The economies of large scale production may not be attained because production is done in short-
runs.
2. The demand is irregular for some products.
3. The use of labour and equipment may be an inefficient.
4. The scientific assessment of costs is difficult.
A.3 Batch production
Batch production pertains to repetitive production. It refers to the production of goods, the quantity of
which is known in advance. It is that form of production where identical products are produced in
batches on the basis of demand of customers’ or of expected demand for products.
This method is generally similar to job production except the quantity of production. Instead of
making one single product as in case of job production, a batch or group of products are produced at
one time. It should be remembered here that one batch of products may not resemble with the next
batch.
Under batch system of production, the work is divided into operations and one operation is done at a
time. After completing the work on one operation it is passed on to the second operation and so on till
the product is completed. Batch production can be explained with the help of an illustration. An
enterprise wants to manufacture 20 electric motors.
The work will be divided into different operations. The first operation on all the motors will be
completed in the first batch and then it will pass on to the next operation. The second group of
operators will complete the second operation before the next and so on. Under job production the
same operators will manufacture full machine and not one operation only.
Batch production can fetch the benefits of repetitive production to a large extent, if the batch is of a
sufficient quantity. Thus batch production may be defined as the manufacture of a product in small or
large batches or lots by series of operations, each operation being carried on the whole batch before
any subsequent operation is operated. This method is generally adopted in case of biscuit and
confectionery and motor manufacturing, medicines, tinned food and hardware’s like nuts and bolts etc.
Characteristics of batch production method
1. The work is of repetitive nature.
2. There is a functional layout of various manufacturing processes.
3. One operation is carried out on whole batch and then is passed on to the next operation and so on.
4. Same type of machines is arranged at one place.
5. It is generally chosen where trade is seasonal or there is a need to produce great variety of goods.
B. Continuous Production
Continuous means something that operates constantly without any irregularities or frequent halts. In
the continuous production system, goods are produced constantly as per demand forecast. Goods are
produced on a large scale for stocking and selling. They are not produced on customer's orders. Here,
the inputs and outputs are standardized along with the production process and sequence.
In continuous production system, the most common material handling equipment are belt conveyors,
roller conveyors, chutes, rails etc. It is because in continuous production systems one or a few
standard products are manufactured with pre-determined sequence of operations with inflexible
material handling devices. In intermittent production system portable material handling equipment are
used and various products are produced with greater flexibility in the systems.
Continuous production system requires a larger investment than intermittent production system
because of fixed path material handling equipment, costly control mechanism and special purpose
machines for various operations. Even the marketing techniques also differ for continuous production
system and intermittent production system.
Following are examples on the continuous production system
1. The production system of a food industry is purely based on the demand forecast. Here, a large-
scale production of food takes place. It is also a continuous production.
2. Similarly, the production and processing system of a fuel industry is also purely based on, demand
forecast. Crude oil and other raw sources are processed continuously on a large scale to yield usable
form of fuel and compensate global energy demand.
The features/characteristics of a continuous production system are listed as follows:
1. The flow of production is continuous. It is not intermittent.
2. The products are standardized.
3. The products are produced on predetermined quality standards.
4. The products are produced in anticipation of demand.
5. Standardized routing sheets and schedules are prepared.
The types of continuous production system include:
1. Mass/Assembly line production, and
2. Process production
B.1 Mass/Assembly line production
This method involves a continuous production of standardized products on a large scale. Under this
method, production remains continuous in anticipation of future demand. Standardization is the basis
of mass production. Standardized products are produced under this method by using standardized
materials and equipment. There is a continuous or uninterrupted flow of production obtained by
arranging the machines in a proper sequence of operations. Process layout is best suited method for
mass production units.
Flow production is the manufacture of a product by a series of operations, each article going on to a
succeeding operation as soon as possible. The manufacturing process is broken into separate
operations.
The product completed at one operation is automatically passed on to the next till its completion.
There is no time gap between the work done at one process and the starting at the next. The flow of
production is continuous and progressive.
Characteristics of mass or flow production
1. The units flow from one operation point to another throughout the whole process.
2. There will be one type of machine for each process.
3. The products, tools, materials and methods are standardised.
4. Production is done in anticipation of demand.
5. Production volume is usually high.
6. Machine set ups remain unchanged for a considerable long period.
7. Any fault in flow of production is immediately corrected otherwise it will stop the whole
production process.
Suitability of flow/mass production
1. There must be continuity in demand for the product.
2. The products, materials and equipment must be standardised because the flow of line is inflexible.
3. The operations should be well defined.
4. It should be possible to maintain certain quality standards.
5. It should be possible to find time taken at each operation so that flow of work is standardised.
6. The process of stages of production should be continuous.
Advantages of mass production
1. The product is standardised and any deviation in quality etc. is detected at the spot.
2. There will be accuracy in product design and quality.
3. It will help in reducing direct labour cost.
4. There will be no need of work-in-progress because products will automatically pass on from
operation to operation.
5. Since flow of work is simplified there will be lesser need for control.
6. A weakness in any operation comes to the notice immediately.
7. There may not be any need of keeping work-in-progress, hence storage cost is reduced.
B.2 Process Production
A production process, that runs for very long periods without the start-and-stop behaviour associated
with intermittent production such as those used by chemical plants or refineries. High capital
investments are required for highly automated facilities that use special-purpose equipment designed
for high volumes of production and little or no variation in the type of outputs.
Characteristics of Process Production
1. Extended form of mass production system
2. More automatic machines
3. One basic raw material is transferred into several products at several stages.
4. Less highly skilled workers required
5. More human problems foreseen
6. Highly standardized system
Comparison of the production techniques/processes
Forecasting
a) Forecasting means estimation of type, quantity and quality of future work e.g. sales etc.
b) The survival of a manufacturing enterprise depends on its ability to assess, with reasonable
accuracy, the market trends several years ahead.
c) Forecasters will be able to make use of sales trends, but these must be considered in the light of
expected introduction of new materials, fashion changes, policies of competitors, unseasonable
weather, threat of war and the general economic situation expected in the country and foreign markets.
These circumstances and others necessitate changes in sales forecast from time to time during the
forecast period.
d) Forecast represents a commitment on the part of the sales department and each of is divisions of
expected sales. It becomes a goal against which the effectiveness of the sales department will be
measured.
e) Forecasting plays a crucial role in the development of plans for the future.
f) Sales budget (estimate) forms the basis for manufacturing budget. It is the sales forecast which
enables to determine production quantities, labour, equipment and raw material requirement (Refer to
Chapter no. 28)
g) A sales forecast should be:
a. Accurate
b. Simple and easy to understand and
c. Economical
Purpose of Sales Forecasting
Sales forecasting is essential because,
(i) It determines the volume of production and the production rate.
(ii) It forms basis for production budget, labour budget, material budget, etc.
(iii) It suggests the need for plant expansion
(iv) It emphasizes the need for product research development
(v) It suggests the need for changes in production methods
(vi) It helps establishing pricing policies
(vii) It helps deciding the extent of advertising, product distribution, etc.
Basic Elements of Forecasting
• Forecasting means predicting future events by the best possible means
• In any sales forecasting analysis, there are four basic elements of economic data that should be used
1. Trends
2. Cycles
3. Seasonal variations
4. Irregular variations
• Trends are the long term, long range movements of a series of economic data. They have little
relationship to the month-to-month changes that take place, and they manifest their direction slowly.
• Cycles are of shorter duration and they are usually featured by alternate periods of expansion and
contraction.
• Seasonal variations occur within a certain period of year and recur at about the same time and to
approximately the same extent from year to year.
• Irregular variations are the result of unforeseen or non-recurring events that have an economic
influence. A strike in a key industry might cause an irregular variation.
Forecasting Techniques
Forecasting is the formal process of predicting future events that will significantly affect the
functioning of the enterprise.
Sales forecasting techniques may be categorized as follows:
(a) Historic estimate
(b) Sales force estimate
(c) Trend line (or Time series analysis) technique
(d) Market survey
(e) Delphi method
(f) Judgmental techniques
(g) Prior knowledge
(h) Forecasting by past average
(i) Forecasting from last period’s sales
(j) Forecasting by Moving average
(k) Forecasting by Weighted Moving average
(l) Forecasting by Exponential Smoothing
(m) Correlation analysis
(n) Linear Regression Analysis
The details of the forecasting techniques are given below:
(a) Historic estimate
• This technique makes use of the assumption that what happened in past will happen in future. For
example, L. a concern has sold 5000 blankets in winter last year, it will be able to sell the same
quantity in winter this year also.
• Historic estimate is useful if the activity is affected by pattern of seasonality.
• It is useful for determining model, size and colours distribution.
• It is successful only when pattern of events remains unchanged, i.e., if economy is static. This is
rarely true except for short period of time.
• Historic estimate is not scientifically valid and thus it is not an accurate method, the total sales
forecast provided by this method should be modified by other techniques.
(b) Sales force estimate
• This technique is based upon the principle – that the persons in contact with the market know best
about the future market tends.
• Individual salesmen make sales estimates of their territories and submit it with the District Sales
Manager who analysis it, modified it and sends the same to Factory Sales Manager. Factory Sales
Manager in consultation with other related factory executive formulates the final estimate of sales.
• This technique is useful when an industry is making a limited number of products (e.g., commercial
power generating equipment) and there are a few large customers.
(c) Trend line technique
• Trent line technique is employed when there is an appreciable amount of historical data.
• This technique involves plotting historical data, i.e., a diagram (Fig. 7.3) between activity indicator,
e.g. tons of material (say past sales) on Y – axis and time on X – axis.
• A single best fitting line (using statistical technique) is drawn and projected to show sales estimate
for future.
• This technique is more accurate as it makes use of a large past data and possesses scientific
validity.
• However, it is time-consuming, involves long mathematical calculations and assumes an infinite
population of relatively small customers so that the decision of an individual customer cannot have an
appreciable effect on total product demand.
(d) Market Survey, i.e. Market Research Technique
• This technique finds application when a concern introduces a new product in the market and is
interested to estimate its sales forecast. For a new product, naturally, no historic or past data
regarding sales will be available.
• This technique may be very informal, utilizing the sales force to feel out the potential customers in
order to establish the extent of the market or it may be a systematically conducted survey using
special mathematical tools.
• Generally, the new product is introduced in a relatively small critical trial area, market reaction is
noted and the total sale (country wide) is projected from these results.
(e) Delphi Method
• A panel of experts is interrogated by a sequence of questionnaires in which the response to one
questionnaire is used to produce the next questionnaire. Any set of information available to some
experts and not others is thus passes on to the others, enabling all the experts to have access to all he
information for forecasting. The method solicits and collates from experts to arrive at a reliable
consensus. This technique eliminates the bandwagon effect of majority opinion.
• Delphi method has fair to very good accuracy for short and long term forecasts.
• The method is applicable to forecasts of long-range and new-product sales.
(f) Judgmental techniques
• Opinions of consumers and customers. Questionnaires related to buying the product may be sent to a
selected group of consumers and to the customers who have already purchased the product. The
information thus received can be very useful in estimating product performance and its probable
demand in future.
• Retail and wholesale dealers can provide some insight into the pace of current and future sales.
• The opinion of area sales manager can also be quite useful.
(g) Prior knowledge
• This is used by ancillary units which are more or less a part of the large organisation. The large
organisation informs each ancillary unit how many components parts to make.
• The forecast estimate is needed only to establish the material and tool requirements, etc.
(h) Forecasting by Past average
• If our objectives are to forecast or predict the sales of an item for the next sale period, then this
method is used.
(i) Forecasting from last period’s sales
• The method eliminates the influence of past (old) data and bases the forecast only upon the sales of
the previous period.
(j) Forecasting by Moving Average
• This method represents a compromise between the two above explained methods, in that the
forecast is neither influenced by very old data nor does it solely reflect the figure of the previous
period.
(k) Weighted Moving Average Method for Forecasting
• Whereas the simple moving average gave equal effects to each components of the moving average
database, a weighted moving average allows any weights to be placed on each element, providing, of
course, that the sum of all weights equals one.
The weighted moving average method has a defined advantage in being able to remove the effects of
past data, but it also has the disadvantage of remembering the total history for the time period.
(l) Forecasting by Exponential Smoothing
The main disadvantages of the moving average method are:
• The lengthy calculations involved
• The need to keep quantities of historical data.
• The fact that the normal (or simple) moving average method places equal weight on each of the
historical figures used.
• The age of the data, which increase with the number of periods used.
All of these disadvantages are overcome by the exponential smoothing technique. Using this
technique, it is necessary only to retain the previous forecast figure and to know the latest actual sales
figure. The technique works by modifying the old forecast in the light of new sales figure.
Capacity Planning
Capacity is defined as the ceiling on the maximum load a production unit can handle at a given point
of time. In other words, capacity is defined as an upper limit on the rate of output.
The capacity question does not arise alone. It comes in conjunction with:
1. New facility planning
2. Leasing or buying the equipment required to maintain the output.
3. Expansion of the existing facilities
4. While introducing new product or services
5. While finalizing the fund and energy requirements
The above mentioned situations, if come across alone, are easy to tackle. It becomes complicated
when more than one situation is encountered at the same time.
A facility’s Capacity is the rate of productive capability of a facility. Capacity is usually expressed as
maximum productive volume of output per time period. Operations managers are concerned with
capacity for capability, usually several reasons. First, they want sufficient capacity to meet customer
demand in a expressed as volume of output per period of timely manner. Second, capacity affects the
cost efficiency of operations, the case or time. Difficulty of scheduling output, and the costs of
maintaining the facility. Finally, capacity requires an investment. Since managers seek a good return
on investment, both the costs and revenues of a capacity planning decision must be carefully
evaluated.
Definition of Production Capacity
Facility planning includes, determination of how much long-range production capacity is needed,
when additional capacity is needed, where production facilities should be located and the layout and
characteristics of the facilities.
Capacity in general is the maximum production rate of a facility or a firm. It is usually expressed as
volume of output per period of time. Capacity indicates the ability of a firm to meant market demand.
Operations managers are concerned with capacity because.
(a) They want sufficient capacity to meet customer demand in time
(b) Capacity affects cost efficiency of operations, the case or difficulty of scheduling output and the
costs of maintaining the facility.
(c) Capacity requires an investment of capital.
Capacity planning
Capacity planning design is the first level planning for the inputs, conversion activities and outputs of
a production operation. Design decisions are very important because they’re often associated with
significant investment of funds. The initial outlay and operating expenses are established based on
design decisions, and these in turn affect productivity of the concern in future. So they affect fixed
cost and variable cost.
Design Capacity: preliminary estimate of capacity is done based on long-range forecast extending 5
to 10 years into the future. The design capacity of a system is the rate of output of goods or services
under full scale operating conditions. For example, a cement factory may be designed to produce 200
tons per day. The projected demand for period anywhere from 5 to 10 years is taken as the estimate
for the design capacity, since frequent expansion will lead to productivity loss.
System Capacity: In practice, it may not be possible to achieve production to the extent of design
capacity mainly because of mismatch between required resources and available resources. The
maximum output of a specific product or product mix that the system of workers and equipment is
capable of producing as an integrated whole is called system capacity. This may be less than that of
the design capacity.
The actual output may be even less than the system capacity since it is affected by short-range factors
such as actual demand, equipment breakdowns, and personal absenteeism or productivity.
Need for Capacity Planning
Capacity planning is necessary when an organization decides to increase its production or introduce
new products into the market. Once capacity is evaluated and a need for new or expanded facilities is
determined, decisions regarding the facility location and process technology selection are taken.
Capacity planning is the first step when an organization decides to produce more or a new product.
Once capacity is evaluated and a need for new or expanded facilities is determined, facility location
and process technology activities occur. Too much capacity would require exploring ways to reduce
capacity, such as temporarily closing, selling, or consolidating facilities. Consolidation might involve
relocation, a combining of technologies, or a rearrangement of equipment and process.
Importance of Capacity Planning
The importance of capacity planning lies in the fact that it is more fundamental. Every organization
looks at the future with its’ own focus and develop and adjusts ‘its’ strategies to reach the goal.
Capacity planning relates to the organization potential impact on the ability of the organization to meet
the future demands for it’s product / service. This is because of the fact that the possible rate of output
is limited by the capacity.
a. There is also link between the capacity and the operating cost. Every managers wants to minimize
the operating cost of the final product. Also they are interested in utilizing the established capacity to
the fullest possible extent. This trade – off puts the whole process, into a vicious circle.
b. Minimizing the operating cost is not possible always, as the demand is a variable factor. The
demand variation is due to:
• Increased competition (through the entry of new players; (or) due to the change in the strategies of
the existing players).
• Technological changes (through some inventions (or) entry of MNC’s through joint ventures)
• User’s perception (which changes from time to time)
• Nature of the product (accordingly the demand will be seasonal or cyclical)
Possible demand patterns are:
• Growth
• Decline
• Cyclical
• Stable
a. The Initial Investment involved. This is due to the fact that, the capacity is a major determinant of
the cost of a product, which will decide about the organization’s position in the market.
b. Long term commitment of resources. Once a capacity is created, it is very difficult – not impossible
– to modify. In future, if modification is needed, it calls for heavy investment.
Capacity Planning Decisions
Capacity planning involves activities such as:
(a) Assessing existing capacity
(b) Forecasting future capacity needs
(c) Identifying alternative ways to modify capacity
(d) Evaluating financial, economic and technological capacity alternatives
(e) Selecting a capacity alternative most suited to achieve the strategic mission of the firm. Capacity
planning involves capacity decisions that must merge consumer demands with human, material and
financial resources of the organization.
Often decisions about capacity are inseparable from decisions about locations: Capacity depends
upon demand and demand often depends on location. Commercial banks, for example, simultaneously
expand capacity and demand by building branch banks. Decisions about the size and location of the
branch are made according to projections about neighbourhood population densities and growth,
geographic locations of market segments, transportation (traffic) flows, and the locations of
competitors. Adding a new branch offers greater convenience to some existing customers and,
management hopes, attracts new customers as well. Obviously this decision affects the revenues,
operating costs and capital costs of the organisation.
In the public sector, the capacity decision involves similar considerations. Municipalities face ever-
increasing demands for public services, strong public sentiment for tightening budgets, and greater
performance accountability. Consequently, officials have increased their efforts to rearrange public
resources so that service capacity is increased but the cost of operating is not. Municipal emergency
services, for example, are periodically expanded by adding to show population growth and shifts.
Next, municipal officials plan where to locate new stations, taking into consideration both areas of
greatest need and costs of operation and facilities. Although the capacity may not involve direct
revenues, cost savings for citizens can be considered a form of indirect revenues. These cost savings
can result in reduced tax burdens of lower insurance rates in areas with improved emergency
services.
Modelling techniques, are playing a central role in these planning processes. One study, for example,
explain how mathematical programming is used for greater ambulance effectiveness considering time-
to-scene, time-to-hospital, a distance-to-hospital factors, thereby increasing effective service system
capacity. Another study shows how mathematical modelling can determine optimal fleet sizes and
vehicle routes for a commercial common carrier. Yet another study demonstrates the value of queuing
models in a computer-based information system for the St. Louis County Police Department. The
system gives a way to allocate police patrols, thereby using existing capacity more efficiently or
reducing the size of operations without diminishing existing service levels. All these examples show
how systematic analysis and planning can lead to effective use and improvement of capacity.
Capacity Planning Strategies
Capacity is a measure of the ability to produce goods or services or, it may be called as the rate of
output. Capacity planning is the task of determining the long – and short – term capacity needs of an
organization and then determining how these needs will be satisfied.
Long-term capacity strategies: Top management may have the following strategies to cope up with
major changes in products and services that it can provide to customers in the long run which will
have significant impact on the capacity. The major changes will altogether revise the demand and
resource requirements. There are:
• develop new product lines
• expand existing facilities
• construct or phase out production plants
Technological obsolescence may force some industries to use phase-in strategy for introducing the
next model of the same product or service to retain and/or improve its market segment. The phase – in
strategy is nothing but het planning for the next model even when the present model is moving well.
Especially, in electronics industry, any company should do continuous research and development to
improve the operational features of the product through advanced technology so that the company will
be in a position to bring out products into the market with the latest technology without any time lag.
At the same time, all the products will not have continued demand for ever. Moreover, continuing the
production of some products will be uneconomical over a period of time. This will force a company
to diversify and/or phase out some of the existing products. Phasing out of a product should be done
over a period of time properly by taking the re-employment features into account.
Short – term capacity strategies: In short-term planning, horizon, capacity decisions are taken by
considering the fluctuations in demand caused by seasonal and economic factors. The purpose of
short-term capacity planning is to respond to variations in demand during the short-term planning
horizon. Strategies like, overtime, subcontracting, hiring firing, etc. can be used to cope up with the
fluctuations in demand.
Factors Affecting Capacity Planning
The capacity variables are:
(a) Controllable Factor’s such as amount of labour employed, facilities installed, machines, tooting,
shifts worked per day, days worked per week, overtime work, sub-contracting, alternative routing of
work, preventive maintenance and number of production set-ups.
(b) Less Controllable Factors are absenteeism, labour-performance, machine break-down, material
shortage, scrap and rework and unexpected problems such as strike, lockout, fire accidents etc.
Types of Capacity
1. Fixed Capacity: The capital asset (buildings and equipment) the company will have at a particular
time is known as the fixed capacity. They cannot be easily changed within the intermediate time range.
Capacity represents an upper limit to the internal capacity, that the company concentrates can use in
its efforts to meet demand
2. Adjustable Capacity: It is on and the size of the workforce, the number of hours per week they
work, the number of shifts and the extent of sub-contracting.
3. Design Capacity: it is the planned rate of output of goods or services under normal full-scale
operating conditions. It is also known as installed capacity. It sets the maximum limit to capacity and
serves to judge the actual utilization of capacity.
4. System Capacity: It is the maximum output of a specific product or product-mix that the system of
workers and machines i.e., the productive system is capable of producing as an integral whole. It is
less than or equal to the design capacity of the individual components because the system may be
limited by:
(a) The product mix
(b) Quality specifications and
(c) The current balance of equipment and labour
5. Potential Capacity: It is that, which can be made available within the decision horizon of the top
management.
6. Immediate Capacity: It is that, which can be made available within the current budgeted period.
7. Effective Capacity: is the capacity, which is used within the current budget period. It is also
known as practical capacity or operating capacity. No plant can work up to the maximum or the
theoretical capacity (installed or design capacity) because of the loss of capacity due to scheduling
delays, machine break-down and preventive maintenance. This result in the plant working at an
efficiency of loss than 100%. Also, the actual output will be less than the designed output due to
rejections and scrap.
8. Normal Capacity or Rated Capacity: This is the estimated quantity of output or production, that
should be usually achieved as per the estimation done by the Industrial Engineering department.
Actual capacity is usually expressed as a percentage of rated capacity. For example, the rated
capacity of a steel plant may be expressed as 1 lakh ton of steel per month. This is also sometimes
called as average capacity of the plant.
9. Actual or Utilized Capacity: This is the actual output achieved during a particular time period.
The actual output may be less than the rated output because of short-range factors such as actual
demand, employed absenteeism, labour inefficiency and low productivity levels.
Long-range effect: Product-mix, long range market conditions, tight quality specifications, inherent
imbalance between equipment and labour.
Short-range effect: Actual demand, management performance vis scheduling, staffing, strategy and
control, labour inefficiencies, wear scrap loss machine breakdown etc.
Capacity Decisions
Major considerations in capacity decisions are:
(a) What size of plant? How much capacity to install?
(b) When capacity is needed? When to phase-in capacity or phase-out capacity?
(c) At what cost? How to budget for the cost?
Factors Affecting Determination of Plant Capacity
• Market demand for a product service
• The amount of capital that can be invested
• Degree of automation desired
• Level of integration (i.e. vertical integration)
• Type of technology selected
• Dynamic nature of all factors affecting determination of plant capacity, viz., changes in the product
design, process technology, market conditions and product life cycle, etc.
• Difficulty in forecasting future demand and future technology
• Obsolescence of product and technology over a period of time
• Present demand and future demand both over short-range, intermediate-range and long-range time
horizons.
• Flexibility for capacity additions.
Classification of Capacity Planning
• Long-term capacity planning
• Short-term capacity planning
• Finite capacity planning
• Infinite capacity planning
Long-term or long-range capacity planning is concerned with accommodating major changes that
affect the overall level of output in the longer run. Major changes could be decisions to develop new
product lines expand existing facilities and construct or phase out production plants.
Short-term or short-range capacity planning is concerned with responding to relatively intermediate
variations in demand. In the short-term planning horizon, capacity concerns involve the fluctuations in
demand caused by seasonal or economic factors.
Ways of adjusting the capacity to the varying demands in the short-term time horizon are:
(i) Use of overtime or idle time
(ii) Increasing the number of shifts per day to meet a temporary strong demand.
(iii) Sub-contracting to other firms.
Service industries use flexible work hours, part-time employees and overtime work scheduling to
meet peaks in demands.
In operations planning, two conflicting constraints are time and capacity. If time is fixed by the
customer’s required delivery date or processing cycle. It is possible to accept time as the primary
constraint and plan backwards to accommodate these times. In such cases, planning backwards to
infinite capacity offers a potential solution to the problem. On the other hand, if the processing time is
not a constraint in cases where products are produced to stock and sell, it is simpler to use a forward
plan based on finite capacity i.e., based on available resources.
Constraints On Capacity Planning
Immediate capacity is limited by:
• The plant/equipment size;
• Availability of equipment;
• Availability of manpower;
• Availability of cash;
• Financial policies;
• Purchasing policy;
• Sub-contracting policy;
• The technical demands of the tasks;
• The number of different tasks being undertaken.
• Technical abilities in the pre-operations stages;
• Organizational skills in the planning stages;
• Purchasing skills;
• Sub-contracting skills;
• Maintenance policies and abilities;
• Versatility of workforce;
• Efficiency of workforce.
Capacity Planning in Service Organisation
Service organizations, for the capacity measurement, can be divided into the companies offering:
• Homogenous Services
• Heterogeneous Services
In the case of Insurance companies, the service offered is homogenous i.e. it is based on the number
of policies serviced per year.
Banks and Transport companies offer heterogeneous services. Their offer is restricted by the
availability of limited resources under their possession. For example, in banks, it is measured by the
man hours available per week; and in case of transport companies, it is tonnage per kilo-meter.
Difficulty in Capacity Planning in Service Organizations
• The nature of service itself, i.e. the output cannot be stored.
• Average demand for the service will be far less than the peak demand. This will lead to lower
capacity utilization during the off-peak demands. This results in low productivity. (Example:
Electricity Production and Consumption)
• Demand fluctuation during the course of time. (Example: Placement of funds by the Financial
Institutions)
Capacity Planning Process in Service Organizations
i) Predict future demands
ii) Determine the available capacity
iii) Translate prediction into physical capacity requirement.
iv) Develop alternate capacity plans for matching required and available capacities.
v) Analyse the economic effects of alternate capacity plans.
vi) Analyse the risk and other Strategic consequences of alternate plans
vii) Recommend a course of action
viii) Implementation of the selected course of action.
Plant Location
An important decision which has a bearing on efficiency of production management relates to the
suitable location of plant. The chief object of an industrial concern is to maximize profit through the
minimization of cost of production. this is possible when the firm is of the right (i.e. optimum) size
and is located at a place which provides economies of all kinds in production. In other words,
optimum size has to be combined with optimum location if profit is to be maximized. It must be
clearly understood at this stage that optimum location does not necessarily imply the most favourable
location where labour costs are lowest, transportation cost is minimum, and the water is the best, “but
rather where the entire group of considerations is the optimum size. Just as the optimum size is
determined through a reconciliation of the various relevant forces, the optimum location is also the
outcome of proper reconciliation of various considerations relevant to the question.
It is responsibility of the promoter or entrepreneur to search for a location which yields maximum
advantage to the business enterprise in terms of raw materials, labour, market, transportation and
communication, power and fuel, storage, climate, security, and the like. It is important for the
entrepreneur to choose a location which meets not only the present requirements of an enterprise, but
also the changes likely to occur in the foreseeable future. Consideration of this factor is important for
an enterprise which proposes to undertake expansion and growth programmes without the botheration
of searching for alternative locations.
The problem of location has several technical, economic, managerial, social and strategic
implications. These various aspects vary in their importance and direction at various places. So that
all the relevant consideration is fully take into account, it is imperative for the promoter or
entrepreneur to be extra careful in choosing a location. In medium and large-sized enterprises, the
location study is usually conducted by a special committee consisting of members having a thorough
understanding of the technical, managerial, social, and political aspects of location. When the
location problem is very complex, it is expedient to use an outside consulting firm that specializes in
location studies.
Importance of Plant Location
1. Influence on the Cost of Production and Effectiveness of Marketing: The location chosen for a
business enterprise has a direct influence on the cost of production as well as on the effectiveness of
marketing. It is one location that the ability of a business at a minimum cost, to maintain a sufficient
labour force, and to serve satisfactorily its customers.
2. Effect on the Life of the Business: The factor of location assumes greater importance because
once a plant location is chosen, the enterprise is compelled to remain in that location for many years.
Any decision to change the location later on may mean a substantial loss in the value of the assets and
additional cost in resetting the business. Thus, errors in decision-making in the realm of plant location
often lead to long-term problem which are very difficult to overcome.
Objectives Achieved Through Location
1. Holding Capital Investment and Operating Costs to Minimum: The foremost objective in
selecting an ideal location should be to ensure a minimum amount of investment in capital assets and
also lowest possible operating costs.
2. Ensuring Smooth Operation of the Business: Another objective that an entrepreneur can hope to
achieve through ideal location is the smooth running of the business enterprise. For smooth operation,
a business enterprise needs the efficient services of transportation, communication, banking, repairs
and maintenance and regular supply of raw materials, labour, power and fuel, and the like. An ideal
location by making these services and facilities available with regularity and in sufficient quantities
helps a business enterprise in conducting its operations smoothly and economically.
3. Promoting Employee Welfare and Public Needs: an ideal location, by making available various
facilities and resources, helps achieving employees’ welfare and public needs. For instance, if the
enterprise is located where educational, recreational, medical, religious and security needs of
employees are met, they will certainly feel attached to the enterprise and would develop their loyalty
and commitment for it.
4. Coordinating with Government Policies: Another objective that may guide an entrepreneur’s
decision to select a particular location may be that of coordination with government policies. The
government’s policy on location veers around one important consideration, that is, a balanced
regional development. This policy is sought to be accomplished through various positive and negative
measures. While selecting a location for enterprise, the entrepreneur must ensure that his decision
does not conflict with the government’s policy.
Factors of Location
Decision regarding location requires a careful balancing of several factors. Some of these are more
important than the rest and are usually called, ‘primary factors’, while the less important ones are
referred to as ‘secondary factors’. It is, however, possible that the secondary factors may exert a
greater degree of influence on the location of an industry than any of the primary factors. The
distinction is, therefore, not clear-cut. Further, considerations of broader national interest must also
be given due regard.
The various factors which usually determine the location of industries may be described as under:
(A) Primary Factors
1. Raw Material
From the point of view of minimization of transport costs, the nature of raw material is of great
importance. Certain raw materials are of weight-losing character, say sugarcane. Such materials lose
much of their weight while passing through the process of production. As a result, the finished
product is lighter than the raw materials used in its manufacture. It is well known that ten tons of
sugarcane are needed to manufacture one tone of sugar. Therefore, a good deal of economy in
transport costs can be achieved if industries which use weight-losing materials are located near the
source materials. In such cases, the weight of finished product includes a very small part of the
weight of the raw material used and therefore, transport will be needed only for the greatly reduce
volume of the finished product. There are some raw materials which are common and are found
everywhere. Such materials, are called ‘ubiquities’ and do not affect the location of industries.
Examples of such materials are clay, sand and water.
Apart from these considerations, the promoter of an industrial venture must view the supply of raw
materials from other different angles also viz.,
• Whether the raw materials are home produced or imported – in the latter case the unit must be
established near ports.
• If there is financial linkage with raw material suppliers so that the raw materials may be available
below market prices at some specific points.
• Reliability and continuity of the source of supply, and
• The security of means of transport.
Further, as between two equally suitable locations, the promoter is well advised to consider a
location which has auxiliary raw materials also or has market for the by – products of the industry.
2. Market
The industries which use ‘pure’ raw materials, i.e. materials which do not lose much of their weight
while being converted into finished goods, are generally located near the markets. Cotton is a good
example. Upto ginning, cotton is a weight-losing material, therefore, ginning factories are generally
found near cotton markets. After ginning cotton becomes non-weight-losing, because out of a hundred
pounds of cotton about 95 pounds of cloth can be obtained. This is the chief reason why the cotton
textile industry is located near markets.
The advantage of proximity to market is not only in the transport cost but also in the personal touch
between the producers and consumers. In addition, the increased demand for rapid and regular
delivery of small consignments and the practice of offering after-sale services made it imperative for
the producers to be near the consumers or at least to open branches in those centres”.
Thus, the choice between the point where materials are produced and the point where finished goods
are sold is generally made on the basis of the weight-loosing character of the materials.
3. Fuel and Power
The problem of fuel and power can also be solved with reference to the nature of raw materials. The
industries which use very large quantities of coal are generally located near the coal mines. The chief
reason why steel mills are generally found near coal mines rather than iron-ore mines is that the coal
loses its weight completely. The development of electric and diesel power has reduced the
importance of coal.
4. Transport
The facilities for transport available in a particular region and the policy of freight rates are also of
great importance. For instance, previously the Indian railways had preferential freight rates for raw
materials moving towards the ports and for finished goods moving from the ports to inland centres.
This encouraged starting of industries in port tows like Bombay or Calcutta. Availability of cheap
transport (water transport) is, however, one of the chief reasons why the jute industry is localized on
the two banks of the Hooghly.
5. Labour
Another important factor influencing the location of industries is labour industry can be started only at
a place where the right type of labour is abundantly available at reasonable wages. For example, tea
industry depends not only on the right soil and climate, but also because abundant cheap labour was
available. The wage levels in an area, the influence of trade unions and the character of labour unions
are some aspects of labour force which influence the decision of the entrepreneur to locate the plant
in a particular region or even at a particular place.
(B) Secondary Factors
1. Momentum of an Early Start
Another factor of some importance has been the momentum of an early start. There are a number of
places where, to begin with, only one or two factories are started. With the passage of time these
places gained importance and attracted industries. As a place gains in industries, certain facilities
usually begin to develop. For example:
• Transport facilities are developed because railways and other agencies find it economical to serve
the centre.
• Facilities for repairs and maintenance begin to be provided by specialist firms.
• Banking facilities become available.
• Labour possessing various skills is attracted towards it.
These are important facilities and will automatically attract more industries.
2. Industrial Atmosphere
The industrial atmosphere of a place cannot be measured in tangible terms, but it has a very important
advantage. Industrial atmosphere may be said to exist where people living at a place think
instinctively of industry and learn the intricacies of machines without much effort. This helps the
growth of even new industries.
3. Special Advantage of a Place
The special advantages offered by a place also have some importance. For example, previously some
of the princely States charged little or no income-tax and also offered some advantages in the matter
of labour.
4. Soil and Climate
The question of soil and climate is important particularly for agricultural products like tea, coffee and
rubber, but due to scientific inventions and developments it is becoming less important for most of the
manufactured goods. Previously the cotton textile industry had to be started in a place where the
climate was damp but with artificial humidification, cotton textile mills can be started also in
completely dry places provided other factors justify the starting of the industry there.
5. Personal Factors
The initial location of an industry may, in may cases, be promoted more by the personal likes and
dislikes than purely economic considerations. It must, however be recognized that such locations
cannot endure unless they prove to be economical enough in the long run.
6. Historical Factors
Factors like personal fancies of entrepreneurs or historical accidents may lead to the development of
a place as the centre of an industry. Dr. Om Prakash cites the instance of Kanpur which has developed
as the ‘premier textile centre of northern India’ but has hardly any advantage. It grew as such largely
because some pioneers especially Europeans chose Kanpur as the centre of their cotton activity.
7. Political Stability
The lack of political stability in a State makes for uncertainty in the attitude of State Governments to
industry. In locating plant, it must be seen as to whether the State has a record of political and
economic stability. It is common knowledge that many industrialists have moved out and many more
are planning to move out of West Bengal because of adverse political and law and order situation
there.
8. Special Concession and Benefits
Each State Government has been trying to promote industrial development in relatively backward
regions by offering various concessions and incentives in the form of financial assistance, cheap land,
tax-subsidy etc. to new enterprises. In many cases the location of the plat may be influenced by this
factor.
(C) National and Strategic Considerations
Balanced Regional Development of Industry
The consideration given above are mostly economic in character. These considerations, however,
ignore the broader national interest and, as pointed out earlier, lead to concentration of industries in a
few places. This is clearly undesirable from the point of view of national defence. From the point of
view of equity, too, it is unfair, because it means that people living in a few places will enjoy the
benefits of industry in the form of employment. It is necessary that the distribution of industries over
the various region of the country should be equitable.
Plant Layout
Plant layout deals with the arrangement of physical facilities and manpower required to manufacture a
product. Plant layout, in a more specific sense, covers the planning of space requirements for all
activities in an industrial enterprise – offices, rest rooms, warehouses and all other facilities
associated with the total manufacturing plant – with a view to enabling the plant to function most
effectively. The over-all objective is to plan the arrangement of facilities and personnel so that the
manufacturing process is carried out in an effective manner. This objective involves a minimum of
movement on the part of both materials and men in the organisation.
Plant layout is very complex in nature as it involves concepts relating to such fields as engineering,
architecture, economics and business administration. Since a plant layout, when properly designed,
encompasses all production and service facilities and provides for the most effective utilization of
men, materials, and machines constituting the process, it is a master blueprint for coordinating all
operations.
Objectives of Plant Layout
• Plant layout facilitate the manufacturing process by maintaining balance in the process.
• Efficient and economic material handling
• Smooth flow of factory operations
• Promote effective utilization of manpower and other physical facilities
• Minimize interference from machines
• Reduce hazards affecting employees
• Increase employee morale
• Hold down investment in equipment and other services; and
• Built-in-provision for future expansion.
Factors Affecting Plant Layout
1. Nature of Product
In this category, two factors are quite important – products to be manufactured and volume of
production. The type of product affects plant layout in many ways. Small and light products can be
easily removed from one machine to another and from one man to another, and therefore, for such
products more attention can be given to machine locations and the handling of materials. Similarly,
the volume or rate of production has a significant bearing on the plant layout. In plant layout it is
reflected in the total size of the operation to be planned as well as being the principal factor in the
type of manufacture to be employed.
2. Nature of Process
Factors relating to the process may be, type of process, sequence of operations, number of machines
and equipment, and space requirements of machines and equipment. Variations among the kinds of
processes to be carried on in different industries necessitate considerable difference in plant layout
for the respective types of manufacturing.
3. Materials
Materials – storage and materials-handling are probably then most important factors to be considered
in planning a layout. For materials storage, factors such as rate of use of the material; space, volume
and weight of materials; flour loan capacity, ceiling height; method of storing should be given special
consideration. This will affect the space as well as the efficiency of the production process in the
plant.
4. Personnel
While laying out a plant, safety and comfort of the personnel must be given a special consideration.
Layout should provide for the provision of rest rooms, drinking water, an d other services, as is also
provided in the Factories Act, 1948, people working on machines should be provided with safety
devices. A proper layout should take these factors into consideration.
5. Layout
The type of layout – process layout, product layout and layout by fixed position – will affect the plant
layout.
6. Miscellaneous Factors
Plant layout is also affected by factors such as plant site, building, flexibility, working conditions,
supervisory requirement and the like. The plant site is the connecting link between the factory and the
surrounding community. The building itself, either existing or as proposed, will often have a bearing
on the layout. Working conditions such as illumination, ventilation, heating, noise and vibration,
temperature, employee facility etc. affect the layout.
Each and every one of the above factors presents a problem to the plant layout engineer. One must
realize that a solution that is completely favourable in all ways is seldom reached. In fact, some of
them are rather in opposition to each other. Nevertheless, each represents an important problem
which the plant layout engineer has to consider. As in most design solutions, a compromise must be
made to attain an optimum solution.
Types of Plant Layout
There are three basic types of plant layout – product, process and fixed position layout. It is rare to
find that only one type is present in a single factory, usually they exist side by side. Selection of the
basic plan to be used depends upon many factors; however, of these, the type of product and type of
manufacture are of significant importance.
Process or Functional Layout
In the process layout, all facilities for performing the same or similar functions are grouped together,
i.e. lathes, milling machines, drill presses etc. are found in separate areas. a part being worked on
them travels from one area to another according to the established sequence of operations through
which it must be put, and where the proper machines are located for each operation.
Characteristics of Process Layout
Layout by process is associated with jobbing in small batch production and has the following
characteristics:
• Allows specialized supervision;
• Facilitates provision of services;
• Failure of machines or absence of workers does not disrupt production excessively;
• Good machine utilization;
• Operations may be missed and ‘bad’ jobs delayed because of the necessary flexibility of control,
• High work-in-progress.
Advantages of Process Layout
1. Flexibility: Process layouts are noted for flexibility which is possible in terms of products which
can be manufactured and the jobs that can be done.
2. Financial Investment: Process layout puts much less strain on the scarce financial resources of the
organisation. Under it, general-purpose machines with usually less cost are used. It require typically
lower set-up and maintenance costs. this layout requires less duplication of machines and supporting
equipment. Besides, general-purpose machines do not depreciate or become obsolete as rapidly as
specialized machines used in product layout. All these result in usually a lower financial investment
in machines and other equipments.
3. Working Conditions: Process layout facilitates installation of machines in separate areas without
any dependence on other sequences. Process layout makes it easy to isolate machines which produce
excessive noise, vibration, fume or heat thereby resulting in heavy working conditions in the work
place. The effect of such working conditions is reflected in terms of enhanced employee morale.
4. Output Rate: Process layouts are less vulnerable to break-downs. Machine breakdowns in a
process layout situation only tie up production on broken machines. This reduces the productive
capacity of succeeding operations in the ratio of one to the total number of machines on the labour
operation on which a single machine breaks down. Besides, it is easier to handle breakdown of
equipment by transferring work to other equipment or work station.
5. Supervision: under process layout better and efficient supervision is possible through
specialization.
Disadvantages of Process Layout
1. Inefficient Materials-handling: Efficient materials – handling is difficult to practice in process
layouts. Back-tracking and side-tracking materials become common and are costly and it eliminates
the savings which result form the use of conveyors, chutes and other fixed-path equipment.
2. Unbalanced Line of Production: Process layout do not lend themselves to the maintenance of
balance line of production and they make it difficult to carry out ‘routing’ and ‘scheduling’ function
for they require special routing for different jobs. Therefore, execution of orders is usually delayed
and production rate is hampered.
3. High Inventory Investment: Compared to product layout, inventory investments are usually larger
in case of process layout. This ties up more working capital in ‘work-in-progress’ inventory.
4. High Cost of Supervision: Under process layout, the number of employees for supervision per
supervisor is less and results in reduced supervisory span of control and increased cost of
supervision.
5. Less Mechanization: Less mechanization of handling is the characteristic of process-laid-out
plants, so handling efficiency is less and cost is high. Because of this, the chances of accidents and
fatigue hazards are greater resulting in high insurance rates and lows employee morale.
Suitability of Process Layout
Process layout is suitable where
(1) Non-repetitive items are manufactured. In other words, emphasis is on special orders.
(2) It is difficult to achieve good labour and equipment balance.
(3) Production is not carried on large scale.
(4) It is difficult to undertake adequate time and motion studies.
(5) It is frequently necessary to use the same machine or work station for two or more operations.
(6) During the sequence of operation many inspections are required.
Product Layout
Product layout (or flow, sequential, or line layout) is another basic type of plant layout. In it, all the
machines of each kind needed for balanced operations on a given production or assembly line are
located adjacent to it in labour operation sequence. In product layout, all plant facilities – machines,
men and materials – are arranged according to the sequence of operations required to produce a
specific product. A continuous production system usually utilizes a product layout.
Characteristics of Product Layout
Layout by product is associated with mass and large batch production and has the following
characteristics:
• Little material-handling necessary;
• Good machine utilization;
• Low work-in-progress;
• Production control facilitated
• Minimum floor space required;
• Machine breakdown disrupts production;
• Effective use of labour, i.e. minimum training, job specialization, etc.
Evaluation of Product Layout
The evaluation of product layout is simple to make because the advantages of product layout are
essentially the same as the disadvantages of the process layout and vice versa.
Advantages of Product Layout
1. Lower total materials – handling cost.
2. Less total production time.
3. Less work-in-process
4. Greater simplicity of production control, fewer controls and records needed, and lower accounting
cost, and
5. Less supervision
Disadvantages of Product Layout
(1) Decreased flexibility
(2) Increased investment in equipment and machines
(3) Frequently greater difficulty in expanding production beyond the capacities of the lines in layout
by product, and
(4) Greater difficulty in securing specialization in supervision.
Stability of Product Layout
The product layout is suitable:
1. Where one or a few standardized products are manufactured.
2. Where large volume of production of each item has to travel the production process over a
considerable period of time.
3. Where time and motion studies can be made to determine the rate of work
4. Where a possibility of good labour and equipment balance exists.
5. Where minimum of inspection during sequence of operation is required.
6. Where materials and products permit bulk or continuous handling by mechanical means.
7. Where minimum of set-ups are required.
Layout by Fixed Position
Besides process and product layouts, a less common but basic type of layout exists and is known as a
fixed-position layout. In a fixed-position layout, the material or principal component is fixed or must
remain in fixed position and facilities move to and from the product. Examples of this type of layout
can be found in the building of aircraft, ship-building, ship-yards, and civil engineering works like
bridge construction cases etc.
A fixed – position layout has several advantages and disadvantages. For example, this type of layout
can accommodate variety in product, changes in design etc. Also breakdowns on one part of the
project do not necessarily stop the entire production operation. The main disadvantage of this layout
is, poor facility utilization, particularly on remote work, such as civil engineering.
Criteria for A Good Layout
The process of plant layout is a creative one in so far as it helps minimize movement of machines and
personnel, facilitate the manufacturing process, and reduce the cost of production. while the
techniques employed in making a layout are normal work-study techniques; however, it cannot be set
down with any finality, and, as a matter of fact, in this, experience plays an important role.
Furthermore, it is not possible to define a good layout with any precision. However, there are certain
criteria which should be satisfied by a good layout, which are:
1. Maximum Flexibility: A good layout will be one which can be rapidly modified to meet changing
circumstances.
2. Maximum Coordination: Layout requires to be considered as a whole and not in parts. It should be
a master blueprint for coordinating all operations. It should clearly state the interrelationships
between different machines, departments, and personnel and should provide for coordinated efforts.
For example, entry into, and disposal from any department should be in such a manner that it is more
convenient to the issuing or receiving departments.
3. Maximum use of Volume: Maximum use should be made of the volume available: conveyors can be
run above head height and equipment can be suspended from the ceiling. This principle is particularly
true in stores, where goods can be stacked at considerable heights without inconvenience, especially
if lift-trucks are used.
4. Maximum Visibility: All men and materials should be readily observable at all times, there should
be not ‘hiding places’ into which goods can be mislaid. This criterion is sometimes difficult to fulfil
particularly when an existing plant is taken over. It is also a principle that may be resisted if such,
‘places’ add to the face lifting of the plant.
5. Maximum Accessibility: All servicing and maintenance points should be readily accessible. For
instance, a piece of plant placed in front of a fuse box will impede the work of the electricians and
may cause an unnecessary stoppage of the machine when the fuse box is opened.
6. Minimum Distance: All movements should be both necessary and direct. Handling materials adds
to the cost of the product but does not increase its value, consequently any unnecessary or circuitous
movements should be avoided.
7. Minimum Discomfort: Poor lighting, excessive sunlight, heat, noise, vibrations, and smells should
be minimized and if possible counteracted.
8. Minimum Handling: The best handling is ‘no handling’, but where handling is unavoidable it
should be reduced to a minimum by the use of conveyors, lifts, chutes, hoists and trucks. Materials
being worked on should be kept at working height, and never placed on the floor if it is to be lifted
later.
9. Inherent Safety, Maximum Security, Visible Routes: All layouts should be inherently safe, and no
person should be exposed to danger. Care must be taken not only of the persons operating the
equipment but also of the passers-by, who may be required to go behind a machine, the back of which
is unguarded. Similarly, safeguards against fire, moisture, theft, and general deterioration should be
provided, as far as possible, in the original layout. Definite liens of travel should be provided and, if
possible, clearly marked, no gangways should ever be used for storage purposes, even temporarily.
Procedure for Designing a Plant Layout
The steps which are logically necessary in order to prepare a satisfactory plant layout are:
1. Obtain basic production data, starting with a list of operations to make a product, the machines to
be used or processes to be employed, and the sequence or route to be followed.
2. Prepare an assembly chart, obtaining and analysing and coordinating the basic production data, so
that a flow process chart can be derived showing the path taken by materials and labour/machine
requirements.
3. Calculate equipment requirements needed to produce the particular production rate, making
allowance for machine capacity, machine utilization etc.
4. Materials-handling plan containing decisions on whether the movement of materials between
machines, work stations, or process plant is to be by means of conveyors, cranes, hoists etc.
materials-handling is a very significant cost factor in production and this aspect of production should
receive very serious considerations at this stage.
5. Space allocation study: Since site considerations chiefly relate to the case of transfer of materials
between the various operations, factors related to materials-handling dominate at this stage.
6. Prepare first draft layout plan. This will involve using the site plan and incorporating on it the
various machines and materials-handling equipment needed as a result of the initial assembly chart
and flow process chart.
7. Prepare first draft flow diagram. This will show whether the flow diagram is good and free from
complex movements.
8. Revise layout and prepare revised flow diagram as necessary until the best arrangement is
obtained.
9. Plan individual machines, work stations, or plant in relation to access for work in process, for
repair and maintenance of plant and for services such as electricity, gas, high-pressure air, etc. it is
also necessary to ensure that there is adequate illumination.
10. Plan materials-handling equipment in detail, as related to the individual machines, work stations,
or process plant.
11. Plan and locate all service supplies to each part of the layout.
12. Prepare master plan
Production Planning and Control (PPC)
The main functions of PPC are the coordination of all the activities, which exist during production or
manufacturing.
Materials: This function is concerned with ensuring that the Raw material, standard finished parts,
finished parts of products must be available while starting the operation within the time.
Methods: This function is concerned with the analysis of all methods of manufacturing and selecting
the best appropriate method according to the given set of circumstances and facilities.
Machines and Equipment: It is important that methods of manufacturing should to be related to the
available production facilities coupled with a detail study of equipment replacement policy. This
function is concerned with the detailed analysis of the production facilities, maintenance procedures
and equipment policy.
Routing: It refers to the flow of sequence of operation and processes to be followed in producing a
particular finish product. It determines manufacturing operation and their sequence.
Estimating: This function is concerned with estimation of operations time. The operation time can be
worked Out once the overall method and sequence of operation is fixed and process sheet for each
operation is available.
Loading & Scheduling: It is important that machine should be loaded according to their capabilities
performance the given and according to the capacity. It is concerned with preparation of machine
loads and fixation of starting and completion dates for a particular operation.
Dispatching: It means the assignment of work to different machines or work places which involve
authorities to start of production activities in order of their priority as determined by scheduling.
Expediting: It is also called Follow Up or Progress. Follow up which regulates the progress of
materials and parts through the production process. It is closely interrelated with activities of
dispatching.
Inspection: It is an important control tool. Its assessment is important in the execution of current
program and planning stage of undertaking when the limitations of the processor, method and
manpower are known. It forms a basis for future investigations with respect to method, process etc.
which is useful for evaluation phase.
Evaluating: This is the integral part of control function. The evaluating function is concerned with
providing a feedback mechanism on the long term basis so that the past experience can be evaluated
with the aim of improving utilization of method and facilities.
Aggregate Planning
Aggregate planning is the process of developing, analysing, and maintaining a preliminary,
approximate schedule of the overall operations of an organization. The aggregate plan generally
contains targeted sales forecasts, production levels, inventory levels, and customer backlogs. This
schedule is intended to satisfy the demand forecast at a minimum cost. Properly done, aggregate
planning should minimize the effects of short-sighted, day-to-day scheduling, in which small amounts
of material may be ordered one week, with an accompanying layoff of workers, followed by ordering
larger amounts and rehiring workers the next week. This longer-term perspective on resource use can
help minimize short-term requirements changes with a resulting cost savings.
In simple terms, aggregate planning is an attempt to balance capacity and demand in such a way that
costs are minimized. The term "aggregate" is used because planning at this level includes all
resources "in the aggregate;" for example, as a product line or family. Aggregate resources could be
total number of workers, hours of machine time, or tons of raw materials. Aggregate units of output
could include gallons, feet, pounds of output, as well as aggregate units appearing in service
industries such as hours of service delivered, number of patients seen, etc.
Aggregate planning does not distinguish among sizes, colours, features, and so forth. For example,
with automobile manufacturing, aggregate planning would consider the total number of cars planned
for not the individual models, colours, or options. When units of aggregation are difficult to determine
(for example, when the variation in output is extreme) equivalent units are usually determined. These
equivalent units could be based on value, cost, worker hours, or some similar measure.
Aggregate planning is considered to be intermediate-term (as opposed to long- or short-term) in
nature. Hence, most aggregate plans cover a period of three to 18 months. Aggregate plans serve as a
foundation for future short-range type planning, such as production scheduling, sequencing, and
loading. The master production schedule (MPS) used in material requirements planning (MRP) has
been described as the aggregate plan "disaggregated."
Steps taken to produce an aggregate plan begin with the determination of demand and the
determination of current capacity. Capacity is expressed as total number of units per time period that
can be produced (this requires that an average number of units be computed since the total may
include a product mix utilizing distinctly different production times). Demand is expressed as total
number of units needed. If the two are not in balance (equal), the firm must decide whether to increase
or decrease capacity to meet demand or increase or decrease demand to meet capacity. In order to
accomplish this, a number of options are available.
Options for situations in which demand needs to be increased in order to match capacity include:
1. Pricing. Varying pricing to increase demand in periods when demand is less than peak. For
example, matinee prices for movie theatres, off-season rates for hotels, weekend rates for telephone
service, and pricing for items that experience seasonal demand.
2. Promotion. Advertising, direct marketing, and other forms of promotion are used to shift demand.
3. Back ordering. By postponing delivery on current orders demand is shifted to period when
capacity is not fully utilized. This is really just a form of smoothing demand. Service industries are
able to smooth demand by taking reservations or by making appointments in an attempt to avoid walk-
in customers. Some refer to this as "partitioning" demand.
4. New demand creation. A new, but complementary demand is created for a product or service.
When restaurant customers have to wait, they are frequently diverted into a complementary (but not
complimentary) service, the bar. Other examples include the addition of video arcades within movie
theatres, and the expansion of services at convenience stores.
Options which can be used to increase or decrease capacity to match current demand include:
1. Hire/lay off. By hiring additional workers as needed or by laying off workers not currently
required to meet demand, firms can maintain a balance between capacity and demand.
2. Overtime. By asking or requiring workers to work extra hours a day or an extra day per week,
firms can create a temporary increase in capacity without the added expense of hiring additional
workers.
3. Part-time or casual labour. By utilizing temporary workers or casual labour (workers who are
considered permanent but only work when needed, on an on-call basis, and typically without the
benefits given to full-time workers).
4. Inventory. Finished-goods inventory can be built up in periods of slack demand and then used to
fill demand during periods of high demand. In this way no new workers have to be hired, no
temporary or casual labour is needed, and no overtime is incurred.
5. Subcontracting. Frequently firms choose to allow another manufacturer or service provider to
provide the product or service to the subcontracting firm's customers. By subcontracting work to an
alternative source, additional capacity is temporarily obtained.
6. Cross-training. Cross-trained employees may be able to perform tasks in several operations,
creating some flexibility when scheduling capacity.
7. Other methods. While varying workforce size and utilization, inventory build-up/backlogging, and
subcontracting are well-known alternatives, there are other, more novel ways that find use in industry.
Among these options are sharing employees with counter-cyclical companies and attempting to find
interesting and meaningful projects for employees to do during slack times.
Aggregate Planning Strategies
There are two pure planning strategies available to the aggregate planner: a level strategy and a chase
strategy. Firms may choose to utilize one of the pure strategies in isolation, or they may opt for a
strategy that combines the two.
Level Strategy
A level strategy seeks to produce an aggregate plan that maintains a steady production rate and/or a
steady employment level. In order to satisfy changes in customer demand, the firm must raise or lower
inventory levels in anticipation of increased or decreased levels of forecast demand. The firm
maintains a level workforce and a steady rate of output when demand is somewhat low. This allows
the firm to establish higher inventory levels than are currently needed. As demand increases, the firm
is able to continue a steady production rate/steady employment level, while allowing the inventory
surplus to absorb the increased demand.
A second alternative would be to use a backlog or backorder. A backorder is simply a promise to
deliver the product at a later date when it is more readily available, usually when capacity begins to
catch up with diminishing demand. In essence, the backorder is a device for moving demand from one
period to another, preferably one in which demand is lower, thereby smoothing demand requirements
over time.
A level strategy allows a firm to maintain a constant level of output and still meet demand. This is
desirable from an employee relations standpoint. Negative results of the level strategy would include
the cost of excess inventory, subcontracting or overtime costs, and backorder costs, which typically
are the cost of expediting orders and the loss of customer goodwill.
Chase Strategy
A chase strategy implies matching demand and capacity period by period. This could result in a
considerable amount of hiring, firing or laying off of employees; insecure and unhappy employees;
increased inventory carrying costs; problems with labour unions; and erratic utilization of plant and
equipment. It also implies a great deal of flexibility on the firm's part. The major advantage of a chase
strategy is that it allows inventory to be held to the lowest level possible, and for some firms this is a
considerable savings. Most firms embracing the just-in-time production concept utilize a chase
strategy approach to aggregate planning.
Most firms find it advantageous to utilize a combination of the level and chase strategy. A
combination strategy (sometimes called a hybrid or mixed strategy) can be found to better meet
organizational goals and policies and achieve lower costs than either of the pure strategies used
independently.
Techniques for Aggregate Planning
Techniques for aggregate planning range from informal trial-and-error approaches, which usually
utilize simple tables or graphs, to more formalized and advanced mathematical techniques. William
Stevenson's textbook Production/Operations Management contains an informal but useful trial-and-
error process for aggregate planning presented in outline form. This general procedure consists of the
following steps:
1. Determine demand for each period.
2. Determine capacity for each period. This capacity should match demand, which means it may
require the inclusion of overtime or subcontracting.
3. Identify company, departmental, or union policies that are pertinent. For example, maintaining
a certain safety stock level, maintaining a reasonably stable workforce, backorder policies, overtime
policies, inventory level policies, and other less explicit rules such as the nature of employment with
the individual industry, the possibility of a bad image, and the loss of goodwill.
4. Determine unit costs for units produced. These costs typically include the basic production costs
(fixed and variable costs as well as direct and indirect labor costs). Also included are the costs
associated with making changes in capacity. Inventory holding costs must also be considered, as
should storage, insurance, taxes, spoilage, and obsolescence costs. Finally, backorder costs must be
computed. While difficult to measure, this generally includes expediting costs, loss of customer
goodwill, and revenue loss from cancelled orders.
5. Develop alternative plans and compute the cost for each.
6. If satisfactory plans emerge, select the one that best satisfies objectives. Frequently, this is the
plan with the least cost. Otherwise, return to step 5.
Line Balancing
Many differences exist in the management of production activities in make-to-order and make-to-
stock firms. In make-to-order situations, due dates are important, and hence the sequencing of
customer orders at various machine centres is an essential function. This involves both planning and
control of activities. Make-to-stock products are generally high-volume consumer goods, such as
telephones, automobiles, wrist watches, etc. The manufacture of standardized, high-volume items,
which involves flow shops requires control for effective production.
A flow shop consists of a set of facilities through which work flows in a serial fashion. The same
operations are performed repeatedly in every work station, thus require lower-level skilled workers.
The flow shop generally represents a mass production situation and hence the operations are carried
out very efficiently e.g. when an operator has to install a gear box on an automotive assembly or
assembling cooling system on a washing machine.
In flow shops, items enter the finished goods inventory one after another, often in the same order of
the inputs for these goods, leaving very low in-process inventories. Since the items are mostly make-
to-stock, forecasting is a difficult job, and hence the finished goods levels in terms of anticipation
inventories are very high. For the same reason, raw materials are carried at higher inventory levels.
Machines in flow shop tend to have a special purpose design, and hence the initial investment level is
generally high for heavy automated plants.
The production control system of continuous production is called flow control. Specialization, high
volume, division of labour and efficiency are built into the design of assembly lines.
The main objective of flow control in flow shops it to balance the assembly line. The assembly line is
represented in the form of a precedence diagram.
Objective of Assembly Line Balancing
The objective of assembly line balancing is to subdivide the network into several sub networks
(stations) without violating the precedence relationships and allocating operations to each station
without exceeding the cycle time, i.e. the sum of the times of operations allocated to each station
should not exceed the cycle time.
While allocating operations to each station, the precedence relationships must be maintained. If these
are followed, then we can ensure production of the specific volume of products ore items using the
assembly line. At an interval equal to the cycle time, a completed assembly will be related from the
assembly line.
PERT and CPM: Techniques of Project Management
PERT and CPM are techniques of project management useful in the basic managerial functions of
planning, scheduling and control. PERT stands for “Programme Evaluation & Review Technique” and
CPM are the abbreviation for “Critical Path Method”. These days the projects undertaken by business
houses are very large and take a number of years before commercial production can start.
The techniques of PERT and CPM help greatly in completing the various jobs on schedule. They
minimise production delays, interruptions and conflicts. These techniques are very helpful in
coordinating various jobs of the total project and thereby expedite and achieve completion of project
on time.
PERT is a sophisticated tool used in planning, scheduling and controlling large projects consisting of
a number of activities independent of one another and with uncertain completion times. It is
commonly used in research and development projects.
The following steps are required for using CPM and PERT for planning and scheduling:
(i) Each project consists of several independent jobs or activities. All these jobs or activities must be
separately listed. It is important to identify and distinguish the various activities required for the
completion of the project and list them separately.
(ii) Once the list of various activities is ready the order of precedence for these jobs has to be
determined. We must see which jobs have to be completed before others can be started. Obviously,
certain jobs will have to be done first.
Many jobs may be done simultaneously and certain jobs will be dependent upon the successful
completion of the earlier jobs. All these relationships between the various jobs have to be clearly
laid down.
(iii) The next step is to draw a picture or a graph which portrays each of these jobs and shows the
predecessor and successor relations among them. It shows which job comes first and which next. It
also shows the time required for completion of various jobs. This is known as the project graph or the
arrow diagram.
The three steps given above can be understood with the help of an example. Suppose, we want to
construct a project graph of the simple project of preparing a budget for a large manufacturing firm.
The managing director of this company wants his operating budget for the next year prepared as soon
as possible.
To accomplish this project, the company salesmen must provide sales estimates in units for the period
to the sales manager. The sales manager would consolidate this data and give it to the production
manager.
He would also estimate market prices of the sales and give the total value of sales schedules of the
units to be produced and assign machines for their manufacture. He would also plan the requirements
of labour and other inputs and give all these schedules together with the number of units to be
produced to the accounts manager who would provide cost of production data to the budget officer.
Using the information provided by the sales, production and accounting departments, and the budget
officer would make the necessary arrangements for internal financing and prepare the budget. We
have seen that the project of preparing the budget involves a number of activities.
Advantages of PERT
The following advantages are derived from the pert:
1. It compels managers to plan their projects critically and analyse all factors affecting the progress
of the plan. The process of the network analysis requires that the project planning be conducted on
considerable detail from the start to the finish.
2. It provides the management a tool for forecasting the impact of schedule changes and be prepared
to correct such situations. The likely trouble spots are located early enough so as to apply some
preventive measures or corrective actions.
3. a lot of data can be presented in a highly ordered fashion. The task relationships are graphically
represented for easier evaluation and individuals in different locations can easily determine their role
in the total task requirements.
4. The PERT time (Te) is based upon 3-way estimate and hence is the most objective time in the light
of uncertainties and results in greater degree of accuracy in time forecasting.
5. It results in improved communication; the network provides a common ground for various parties
such as designers, contractors, project managers etc. and they must all understand each other’s role
and contributions.
The network will highlight areas that require attention of higher priority so that concentration can be
applied to the key jobs without ignoring the lower priority tasks. This gives the management an
opportunity to shift attention to any critical task so that the entire project is completed in time.
Limitations of Pert
Some of the limitations and problems that arise are:
1. Uncertainly about the estimate of time and resources. These must be assumed and the results can
only be as good as the assumptions.
2. The costs may be higher than the conventional methods of planning and control. Because of the
nature of net working and net work analysis, it needs a high degree of planning skill and greater
amount of details which would increase the cost in time and manpower resources,
3. It is not suitable for relatively simple and repetitive processes such as assembly line work which
are fixed-sequence jobs.
Hence PERT is not very effective in manufacturing operations, since it deals in the time domain only
and does not deal with the quality information which is necessary in manufacturing processes.
These activities listed in the order of precedence are given below:
In this graph jobs are shown as arrows leading from one circle on the graph to another. Thus, the
arrow connecting the two circles represents a job. Circle one and two represent job a i.e. forecasting
of units sale which would take 14 days.
Circles 2 and 4 represent job b which will take ten days and so on. It would be seen that job c is not
dependent upon job b and therefore, the two jobs can be done simultaneously. Once we reduce the
project to network of activities and events and we estimate activity durations, we are in a position to
determine the minimum time required for completion of the whole project.
To do so, we must find the longest path or sequence connecting the activities through the network.
This is called the ‘critical path’ of the project. The longest path is the critical path. In our example,
there are two paths. One is connecting circle numbers 1, 2, 4 and 5. This path will take 14+10 + 10 =
34 days.
The other path, is connecting circles 1,2,3,4 and 5, this path will takes 14 + 7 + 4+ 10 = 35 days.
Obviously the 2nd path is the critical path and the project of budget presentation will take this much
of time. The students will however notice that this time is shorter than the total time listed under Table
1 which will be 45 days. This is because jobs b and c can be done simultaneously.
What we have basically described above is the very careful technique of CPM and PERT which
consists of decomposing project into activities and then ordering activities according to their
relationships to find out the shortest time required to carry on an activity.
This technique is very useful in case of projects which involve a large number of activities. It makes
the project manager list out all the possible activities, their relationships, find out which activities
can be performed first, which next and which can be performed simultaneously so as to find out the
best possible manner of completing the project.
A good project network goes a long way in reducing costs. Many companies work out the cost
estimate of each activity and show
Advantages of PERT:
The following advantages are derived from the pert:
1. It compels managers to plan their projects critically and analyse all factors affecting the progress
of the plan. The process of the network analysis requires that the project planning be conducted on
considerable detail from the start to the finish.
2. It provides the management a tool for forecasting the impact of schedule changes and be prepared
to correct such situations. The likely trouble spots are located early enough so as to apply some
preventive measures or corrective actions.
3. a lot of data can be presented in a highly ordered fashion. The task relationships are graphically
represented for easier evaluation and individuals in different locations can easily determine their role
in the total task requirements.
4. The PERT time (Te) is based upon 3-way estimate and hence is the most objective time in the light
of uncertainties and results in greater degree of accuracy in time forecasting.
5. It results in improved communication; the network provides a common ground for various parties
such as designers, contractors, project managers etc. and they must all understand each other’s role
and contributions.
The network will highlight areas that require attention of higher priority so that concentration can be
applied to the key jobs without ignoring the lower priority tasks. This gives the management an
opportunity to shift attention to any critical task so that the entire project is completed in time.
Limitations of Pert:
Some of the limitations and problems that arise are:
1. Uncertainly about the estimate of time and resources. These must be assumed and the results can
only be as good as the assumptions.
2. The costs may be higher than the conventional methods of planning and control. Because of the
nature of net working and net work analysis, it needs a high degree of planning skill and greater
amount of details which would increase the cost in time and manpower resources,
3. It is not suitable for relatively simple and repetitive processes such as assembly line work which
are fixed-sequence jobs.
Hence PERT is not very effective in manufacturing operations, since it deals in the time domain only
and does not deal with the quality information which is necessary in manufacturing processes.
Inventory Management
In financial parlance, inventory is defined as the sum of the value of raw materials, fuels and
lubricants, spare parts, maintenance consumables, semi-processed materials and finished goods stock
at any given point of time. The operational definition of inventory would be. The amount of raw
materials, fuel and lubricants, spare parts and semi-processed materials to be stocked for the smooth
running of the plant. Since these resources are idle when kept in the stores, inventory is defined as an
idle resource of any kind having an economic value.
Inventories are maintained basically for the operational smoothness which they can effect by
uncoupling successive stages of production, whereas the monetary value of inventory serves as a
guide to indicate the size of the investment made to achieve this operations conveniences. The
materials management department is expected to provide this operational convenience with a
minimum possible investment in inventories. The objectives of inventory, operational and financial,
needless to say, are conflicting. The materials department is accused of both stockouts as well as
large investment in inventories. The solution lies in exercising a selective inventory control and
applications of inventory control techniques.
Types of Inventories
Inventories may be classified as under:
1. Raw materials and production inventories: These are raw materials, parts and components which
enter into the product direct during the production process and generally form part of the product.
2. In process inventories: Semi-finished parts, work-in-process and partly finished products formed
at various stages of production.
3. M.R.O. Inventories: Maintenance, repairs and operating supplies which are consumed during the
production process and generally do not form part of the product itself (e.g. Petroleum products –
petrol, kerosene, diesel, various oils and lubricants, machinery and plant spares, tools, jibs and
fixtures etc.)
4. Finished goods inventories: Complete finished products ready for sale.
Inventories may also be classified according to the function they serve, such as:
a) Movement and transit inventories: This arises because of the time necessary to move stocks from
one place to another. The average amount can be determined mathematically thus –
I = S x T
Where, S represents the average rate of sales (say, weekly or monthly average) and T, the transit time
required to move from one place to another, and I the movement inventory needed. As for example, if
it takes three weeks to move materials to a warehouse from the plant and if the warehouse sells 110
per week, then the average inventory needed will be 110 units x 3 weeks – 330 units. In fact, when a
unit of finished product is manufactured and ready for sale, it must remain idle for three weeks for
movement to warehouse. Therefore, the plant stock on an average must be equal to three weeks’ sale
in transit.
b) Lot-size inventories: In order to keep costs of buying, receipt, inspection and transport and
handling charges low, larger quantities are bought than are necessary for immediate use. It is common
practice to buy some raw materials in large quantities in order to avail of quantity discounts.
c) Fluctuation inventories: In order to cushion against unpredictable demands these are maintained,
but they are not absolutely essential in the sense that such stocks are always uneconomical. Rather
than taking what they can get, general practice of serving the customer better is the reason for holding
such type of inventories.
d) Anticipation inventories: Such inventories are carried out to meet predictable changes in demand.
In case of seasonable variations in the availability of some raw materials, it is convenient and also to
some extent economical to build up stocks where consumption pattern may be reasonably uniform and
predictable.
Of the types of inventories discussed above, the Lot – size. Fluctuation and Anticipation Inventories
may be said to be ‘Organisatoin Inventories’ As more and more of these basic types of inventories are
carried into stock, less coordination and planning are required. Also less clerical and administrative
efforts are needed and greater economies can be obtained in handling, manufacturing and dispatching.
But the difficulty is that gains are not directly proportional to the size of inventories maintained. As
the size increases, even if they are efficiently maintained, handled and properly located, gains form
additional stock become less and less prominent. The cost of warehousing, obsolescence and capital
costs associated with maintenance of large quantities grow at a faster quantities grow at a faster rate
than the inventories themselves. As such, the basic problem is to strike a balance between the
increase in costs and the decline in return from holding additional inventories. Striking a balance in a
complex business situation through intuition alone is not easy. Costs, and to be sure, the balancing of
opposite costs, like at the heart of all inventory control problems, for which cost analysis are
necessary.
As has already been said that even a typically medium size industrial organisation may use 10,000 to
15,000 different items which are carried in inventory. Initial planning and subsequent control of such
inventories can only be accomplished on the basis of knowledge about them. Consequently, the
starting point in inventory management and control is the development of a stores catalogue, which is
more or less comprehensive and complete in all respects. All inventories should be fully and
carefully described and a code number should be allotted. Similar items should be grouped together
and standard codification should be adopted.
Inventory Control
Inventory control may be said to be a planned method whereby investments in inventories held in
stock is maintained in such a manner that it ensures proper and smooth flow of materials needed for
production operations as well as sales while at the same time, the total costs of investment in
inventories is kept at a minimum.
From the above definition it follows that a comprehensive inventory control system must be closely
coordinated with other planning and control activities, such as, cash planning, capital budgeting, sales
forecasting, including production planning, production scheduling and control. This impinges on a
wide range of operations, operating decisions and policies for production, sales and finance. The
finance controller of a company regards inventory as a necessary evil, since it drains off cash which
could be used elsewhere to earn some profits. The marketing manner always wants enough of ready
stock of finished goods inventories in order to give better customer service to ensure the company’s
goodwill and would not like to see a sales opportunity lost for want of saleable ready stock. The
production manager does not want an out of stock condition for which production might be held up. It
will, therefore, be seen that everyone has some objectives which are conflicting in nature. The basic
problem is, therefore, to strike a balance between operating efficiency and the costs of investment and
other associated costs with large, inventories, with the object to keep the basic conflicts at the
minimum while optimizing the inventory holding.
Objective of Inventory Control
1. To reduce to the minimum idle time due to shortage of materials and spare parts. Neither man nor
machine should have idle time due to lack of materials.
2. Similarly, to offer maximum service and satisfaction to the customers with regard to fulfilling the
due dates strictly as per orders. The sole aim of a business is to create and retain customers.
3. At the same time, to minimize capital investment and cost of storage.
Importance of Efficient Inventory Control System
1) An efficient inventory control system minimizes the possibility of delay in production. there is no
danger of closure of plant, unemployment, lower dividend and replacement of management – a dark
picture resulting out of poor inventory control.
2) It helps a company to secure many economies. For instance, no duplication in ordering, better use
of available materials by inter department transfers, economies due to bulk purchases such as low
freight, higher discount, lower price, less clerical work etc.
3) It is necessary for efficient accounting system, particularly for material aspect of cost accounting.
4) It discourages dishonesty, e.g. stealing material from the plant.
5) It expedites preparation of financial statements.
6) Losses, damages, deterioration of materials can be minimized and enables careful material-
handling.
Functions of Inventory Control
(1) Keeping the stock of goods at the most appropriate level at all times so that the requirements of
sales department can be always fulfilled.
(2) Maintaining capital investment in stocks at a minimum desirable level, without sacrificing the
main interest of trading.
(3) Protecting the stocks from losses and damages due to improper handling, pilferage or
unauthorized removal from the store.
(4) Receiving and recording of all goods routed in the store and keeping up-to-date trace of every
outgoing item.
(5) Indexing of all items of stock for their quick location. This is done through identifying marks,
labels and Bin Cards.
(6) Up-to-date inventory records must show the quantity and value of all goods in the warehouse, all
receipts and deliveries made from the warehouse and the points at which replenishment of stocks
become necessary by ordering new stocks.
Standards in Inventory Control
There are four important quantity standards in inventory control.
1. The Maximum Level
It indicates the upper limit of the level of stocks or inventory. It points out the largest quantity to be
normally kept in the store in the interest of economy.
2. The Minimum Level
It indicates the lower limit of the level of stocks of inventory which is really a maximum reserve or
margin of safety. This level of safety may be used only in an emergency. It is the level acting as a
safety value. it is the minimum level of stocks which must be always on hand. It is the minimum
reserve of the dealer.
3. The Standard Order
It is quantity of stocks to be requisitioned for purchase at any one time. A repeat order for a
commodity is always of the same quantity until conditions change, necessitating a revision of the
standard order. The purchase requisition given the quantity for replenishment of stocks.
4. The Ordering Point
It is the quantity of stock necessary to protect against the exhaustion of the stock during the gap
between the date of order and the date of actual receipt. When the level of stocks or the balance on
hand reaches this level, it is an indication that a new order must be placed at once. The time
necessary to secure the stock of required articles after requisitioning must be carefully calculated and
sufficient margin must be provided for contingent delays or bottlenecks in transport.
The following factors are to be considered for establishing the stock level to be maintained in a
business for effectiveness of the system of control.
1. On the basis of the previous records pertaining to sales and production, the demand for the
inventory should be determined. It is essential to make allowance for fluctuations. In the case of
business with seasonal sales, a change in the inventory level is necessary by periodical review of the
inventory, the restored level should be maintained.
2. Present position regarding supplies of materials and labour and their availability
3. The next factor is the time that elapses between the time of requisitioning of the items and the time
of the receipt of the same. This is called ‘lead time’. Due allowance should be made for the
variability in the lead time.
4. Quantities of stocks on hand and required at the end of the period.
5. The effectiveness of the system depends upon the storage facilities available. Inventory level will
be affected if there is lack of storage facilities.
6. In carrying stocks at higher levels there is the danger of expenses of storage involved.
7. The most important is the price factor. Low value items may be purchased in large quantities to
take advantage of the price position while higher value items may be purchased frequently in small
quantities.
8. Capital to be invested in stock.
9. If higher levels of inventories are maintained, stock level will be affected by obsolescence, change
in fashion and improvements in technicalities.
Inventory Control Techniques
(1) Perpetual Inventory and Continuous Stock Taking
(2) A. B. C Analysis
(3) Input-Output Ratio Analysis
(4) Inventory Turnover Ratio
(5) Economic Order Quantity
1. Perpetual Inventory System
According to the Institute of Costs and Management Accountants, England, it is defined as “a system
of records maintained by the controlling department which reflects the physical movements of stocks
and their current balance”.
It is a method of ascertaining balance after every receipt and issue of materials through stock records
to facilitate and issue of materials through stock records to facilitate regular checking and to avoid
closing down for stock-taking. In order to ensure accuracy of perpetual inventory record, it is
desirable to check the physical stocks by a programme of continuous stock-taking. Any discrepancy
noted between physical stock and stock records can be investigated and rectified, then and there.
2. A B C Control Method
This method is useful in business organisations which are dealing in a number of items of goods.
Under this method, inventories are grouped under three categories A, B and C “A” is allotted for the
high value items, “B” for medium value items and “C” for low value items. Values of the items are
converted into percentages; each item being stated at a percent of the total value of all the items.
Usually items which account for 70% to 80% of the values are grouped under item ‘A’. Those which
account for 10% to 20% of the values are grouped under item ‘B’. The remaining items are grouped
under category ‘C’. High value items should be reviewed frequently and accurately and low value
items may be reviewed at long periods. In the case of medium value items, the control should be more
than the low value items, the control should be more than the low value items and less than the high
value items. Moreover, in this case review need not be made as frequently as in the case of high value
items.
3. Input-Output Ratio Analysis
This ratio is the ratio of the raw-materials put into manufacturing and the standards raw materials
content of the actual output. A standard ratio of input of material and output of material should be
determined and the actual ratio is higher than the standard ratio, the performance will be considered
to be below the standard ratio and vice-versa. In process industries it is a valuable report to show the
percentage of losses that have occurred at each stage. It also measures the productivity of capital. this
method is also useful to ascertain the raw material cost of finished output by multiplying the raw
material cost per unit by this ratio.
4. Inventory Turnover Ratio
This ratio is another method of exercising control. It is essential to compare the turnover of different
kinds of materials to find out the items: which are slow moving, thus helping the management to avoid
keeping capital locked up in such item. A low ratio is an indicator of slow moving stock,
accumulation of obsolete stock, carrying of too much stock. It will lead to the disadvantages arising
out of over-stocking. But a high turnover ratio is an indication of fast moving stock and investment in
stock. If this ratio for a particular item is zero, it means that the item had not been used at all during
the period and should be immediately disposed of; otherwise the quality of the item may get
deteriorated.
5. Economic Order Quantity (EOQ)
The economy order quantity represents that quantum of products which should be ordered at a time so
that the overall inventory cost is the lowest and stockout situations may be prevented. When the EOQ
is determined, it helps management to order such a desirable quantity, that the erratic ordering to
manufacturing plant is avoided to a large extent. When the ordering cost and the cost of carrying an
additional unit in inventory are constant and the demand is known, the following formula, also called
‘square root law’, may be applied to arrive at the EOQ.
EOQ = under root(2AO/C)
EOQ = the most economical order quantity in units
O = the preparation cost of one order in rupees
A = the total number of units of products required per year, and
C = the carrying cost per unit per year.
Limitation of EOQ Formula
However, the very restrictive nature of the assumptions made in the EOQ formula restrict the use of
the formula in many cases of practical inventory situations. The cost-analyses on the basis of which
the formulas have been developed are merely national rather than actual in some cases. In practice,
unit cost of purchase of an item varies, lead times are uncertain and also requirements or demands of
inventory items are not perfectly predictable in advance. Rate of consumption varies greatly in many
cases. As such, the application of the formula often becomes difficult and a complicated matter.
Inventory costs
While there are a lot of common grounds in the literature, the categories and subcategories of
inventory costs fluctuate and overlap, or are designated under different names.
Inventory costs fall into 3 main categories:
• Ordering costs (also called Setup costs)
• Carrying costs (also called Holding costs)
• Stock-out costs (also called Shortage costs)
Ordering costs
The ordering cost (also called setup costs, especially when producers are concerned), or cost of
replenishing inventory, covers the friction created by orders themselves, that is, the costs incurred
every time you place an order. These costs can be split in two parts:
• The cost of the ordering process itself: it can be considered as a fixed cost, independent of the
number of units ordered. It typically includes fees for placing the order, and all kinds of clerical costs
related to invoice processing, accounting, or communication. For large businesses, particularly for
retailers, this might mainly boil down to the amortized cost of the EDI (electronic data interchange)
system which allows the ordering process costs to be significantly reduced (sometimes by several
orders of magnitude).
• The inbound logistics costs, related to transportation and reception (unloading and inspecting).
Those costs are variable. Then, the supplier’s shipping cost is dependent on the total volume ordered,
thus producing sometimes strong variations on the cost per unit of order.
It is not easy to produce even a rough estimate of the ordering cost, since it includes elements that are
very business specific and even item specific: suppliers can be local or overseas, they can adopt
rules to deliver only per palette instead of per unit, or only when a certain number of items is
ordered; then of course, suppliers can provide volume discounts, etc.
There are ways to try to minimize those costs, more precisely to determine the right trade-off of
carrying costs vs. volume discounts, thus essentially balancing the cost of ordering too much and the
cost of ordering too less (basically, a smaller inventory typically leads to more orders, which means
higher ordering costs, but is also implies lower carrying costs). This is usually achieved through the
calculation of the Economic Order Quantity (EOQ). Without going into details here, let’s just add the
following reminder: though a classical way often appears in the literature to compute the EOQ with
the Wilson formula, this particular formula - going back to 1913 - is a poor fit for retailers, mainly
because it assumes that the ordering cost is a flat. Nevertheless, it is possible to determine optimal
order quantities by devising a cost function taking into account volume discounts, as detailed in our
article.
Carrying costs
Carrying costs are central for a “static” viewpoint on inventory, that is, when focusing on the impact
of having more or less inventory, independently of the inventory flow.
Again the typology varies in the literature; the categorization we propose is the following:
• Capital costs (or financing charges)
• Storage space costs
• Inventory services costs
• Inventory risk costs
Capital costs
It is the largest component among the carrying inventory costs. It includes everything related to the
investment, the interests on working capital and the opportunity cost of the money invested in the
inventory.
Storage space costs
They include the cost of building and facility maintenance (lighting, air conditioning, heating, etc.),
the cost of purchase, depreciation, or the lease, and the property taxes.
These costs are obviously vastly dependent on the kind of storage chosen, whether the warehouses
are company owned or rented, for instance. For smaller businesses, when the same building is used
for different purposes, the portion of the building associated with receiving and storing inventory
must be determined.
Inventory services costs
They include insurance, IT hardware and applications, but also physical handling with the
corresponding human resources, management, etc. We can also put in this category the expenses
related to inventory control and cycle counting. Finally, although they are kind of a category on their
own, taxes can also be added here.
Inventory risk costs
They cover essentially the risk that the items might fall in value over the period they are stored. This
is especially relevant in the retail industry and with perishable goods.
Risks first include shrinkage, which is basically the loss of products between the purchase from the
suppliers (i.e. recorded inventory) and the point of sale (i.e. actual inventory), caused by
administrative errors (shipping errors, misplaced goods, …), vendor fraud, pilferage and theft
(including employee theft), damage in transit or during the period of storage (because of incorrect
storage, water or heat damage, …).
For the reasons mentioned previously, it is hard to give more precise estimates. Let’s simply say that
for the categories mentioned above, the following estimates can be found in the literature:
• Capital costs: 15% approximately
• Storage space costs: 2% approximately
• Inventory service costs: 2% approximately
• Inventory risks costs: 6% approximately
Stock out costs
Finally, to get a complete vision of the inventory costs, we should also add the stock out costs (or
shortage costs), that is, the costs incurred when stock outs take place. For retailers, it can include the
costs of emergency shipments, change of suppliers with faster deliveries, substitution to less
profitable items, etc. While this kind of costs can be determined quite precisely, others are not so
easy to pinpoint, such as the cost in terms of customer loss of loyalty or the general reputation of the
company.
Modelling the cost of stock outs is in itself a vast topic that goes beyond the scope of this article.
Let’s simply mention that basically the cost of inventory is counter-balanced by the opportunity cost
of stock-outs. Balancing the cost of inventory with cost of stock-outs is typically achieved through the
tuning of service levels.
Selective Inventory Control
ABC Analysis
This is one of the basic analytical management tool which enables top management to place the effort
where the results will be greatest. This technique tries to analyze the distribution of an characteristic
by money value of importance in order to determine its priority. The annual materials consumption
analysis of an organisation would indicate that a handful of high value items-less than 10 percent of
the total number will account for a substantial portion of about 70-75 percent of the total consumption
value, and these few vital items are called ‘A’ items which needs careful attention of the materials
manager.
Similarly, large number of bottom’ items over 70 percent of the total number called the trivial many –
account for about 10 percent of the total consumption value, and are known as the ‘C’ class. The items
that lie between the top and bottom are called the ‘B’ category items.
Procedural Steps of ‘ABC’ Analysis
a) Identify all the items used by a company
b) List all the items as per their money value in the descending order. i.e. The high valued items will
be listed first followed by the next valued item.
c) Count the number of high valued, medium valued and low valued items
d) Calculate the individual values of the high, medium and low valued items. This is arrived at first
by multiplying the number of items as in step and
(d) Their values as in step (b) and adding all the items in different categories high, medium and low.
e) Find the percentage of high, medium and low valued items. High valued items normally contribute
for 70 percent or so of the total inventory cost and medium and low valued items 20 and 10 percent
respectively.
f) A graph can be plotted between percent of items and percent of total inventory cost.
Purpose of ABC Analysis
The object of carrying out ABC analysis is to develop policy guidelines for selective control. After
the analysis, broad policy guidelines can be established.
A. Items: High Consumption Value
B. Items: Moderate Value
C. Items: Low Consumption Value
Advantages and Disadvantages of ABC Analysis
This approach helps the materials manager to exercise selective control and focus his attention only
on a few items when he is confronted with lakhs of stores items. By concentrating on high valued ‘A’
items, the manager will be able to effectively control inventories and show the ‘visible’, results in a
short spen of time by reducing the overall working capital requirement and increasing the profit of the
company. By this analysis obsolete stocks are automatically pin pointed. This results in better
planning and improved inventory turnover.
The major limitation of the ABC analysis is that it takes into account the total consumption value of
items but not their vitality. Some items, though negligible in monitory value, may be vital for running
the plant or machines. For example, the connecting belts in case of motors, foundation bolts etc. the
results of ABC analysis have to be reviewed periodically and updated. Low valued item in ‘C’
category, like diesel oil to ruin the generator, may become B for A category item during the power
crises.
VED analysis
This analysis attempts to classify items into many categories depending upon the consequences of
materials stock out when demanded. The cost of storage may vary depending upon the seriousness of
such a situation. The items are classified into V (Vital), E (Essential) and D (Desirable) categories.
Vital items are the most critical having extremely high opportunity cost of shortage and must be
available in stock when demanded. Essential items are quite critical with substantial cost associated
with shortage and should be available in stock and by and large. Desirable group of items do not have
very serious consequences if not available when demanded but can be stocked items.
Hence, the percentage risk of shortage with the ‘vital’ items has to be quite small, thus calling for high
level of stock. With ‘Essential category we can take a relatively high risk of shortage and for
‘Desirable’ category even higher. So, depending upon the seriousness of the requirement of the item
they are classified.
FSN Analysis
The items that are being used in a company are not required to be purchased at the same frequency.
Some materials are quite regularly required, yet some others are required very occasionally and some
materials may have become absolute and might not have been demanded for years together. This FSN
analysis groups then into three categories as fast moving. Slow-moving and Non-moving items.
Inventory policies and models for he three categories have to be different. Most spare parts come
under the slow moving category which has to be managed on a different basis. For non-moving dead
stock, we have to determine optimal stock disposal procedures and rules rather than inventory
provisioning rules. Categorization of materials into three types on values, critically and usage enables
us to adopt the right type of inventory policy to suit a particular situation.
Material Requirements Planning
Material requirements planning (MRP) is a computer-based inventory management system designed
to assist production managers in scheduling and placing orders for items of dependent demand.
Dependent demand items are components of finished goods—such as raw materials, component parts,
and subassemblies—for which the amount of inventory needed depends on the level of production of
the final product. For example, in a plant that manufactured bicycles, dependent demand inventory
items might include aluminium, tires, seats, and bike chains.
The first MRP systems of inventory management evolved in the 1940s and 1950s. They used
mainframe computers to explode information from a bill of materials for a certain finished product
into a production and purchasing plan for components. Before long, MRP was expanded to include
information feedback loops so that production personnel could change and update the inputs into the
system as needed. The next generation of MRP, known as manufacturing resources planning or MRP
II, also incorporated marketing, finance, accounting, engineering, and human resources aspects into
the planning process. A related concept that expands on MRP is enterprise resources planning (ERP),
which uses computer technology to link the various functional areas across an entire business
enterprise.
MRP works backward from a production plan for finished goods to develop requirements for
components and raw materials. MRP begins with a schedule for finished goods that is converted into
a schedule of requirements for the subassemblies, the component parts, and the raw materials needed
to produce the final product within the established schedule. MRP is designed to answer three
questions: what is needed? how much is needed? and when is it needed?"
MRP breaks down inventory requirements into planning periods so that production can be completed
in a timely manner while inventory levels—and related carrying costs—are kept to a minimum.
Implemented and used properly, it can help production managers plan for capacity needs and allocate
production time. But MRP systems can be time consuming and costly to implement, which may put
them out of range for some small businesses. In addition, the information that comes out of an MRP
system is only as good as the information that goes into it. Companies must maintain current and
accurate bills of materials, part numbers, and inventory records if they are to realize the potential
benefits of MRP.
MRP Inputs
The information input into MRP systems comes from three main sources: a bill of materials, a master
schedule, and an inventory records file. The bill of materials is a listing of all the raw materials,
component parts, subassemblies, and assemblies required to produce one unit of a specific finished
product. Each different product made by a given manufacturer will have its own separate bill of
materials. The bill of materials is arranged in a hierarchy, so that managers can see what materials
are needed to complete each level of production. MRP uses the bill of materials to determine the
quantity of each component that is needed to produce a certain number of finished products. From this
quantity, the system subtracts the quantity of that item already in inventory to determine order
requirements.
The master schedule outlines the anticipated production activities of the plant. Developed using both
internal forecasts and external orders, it states the quantity of each product that will be manufactured
and the time frame in which they will be needed. The master schedule separates the planning horizon
into time "buckets," which are usually calendar weeks. The schedule must cover a time frame long
enough to produce the final product. This total production time is equal to the sum of the lead times of
all the related fabrication and assembly operations. It is important to note that master schedules are
often generated according to demand and without regard to capacity. An MRP system cannot tell in
advance if a schedule is not feasible, so managers may have to run several possibilities through the
system before they find one that works.
The inventory records file provides an accounting of how much inventory is already on hand or on
order, and thus should be subtracted from the material requirements. The inventory records file is
used to track information on the status of each item by time period. This includes gross requirements,
scheduled receipts, and the expected amount on hand. It includes other details for each item as well,
like the supplier, the lead-time, and the lot size.
MRP Processing
Using information culled from the bill of materials, master schedule, and inventory records file, an
MRP system determines the net requirements for raw materials, component parts, and subassemblies
for each period on the planning horizon. MRP processing first determines gross material
requirements, then subtracts out the inventory on hand and adds back in the safety stock in order to
compute the net requirements.
The main outputs from MRP include three primary reports and three secondary reports. The primary
reports consist of: planned order schedules, which outline the quantity and timing of future material
orders; order releases, which authorize orders to be made; and changes to planned orders, which
might include cancellations or revisions of the quantity or time frame. The secondary reports
generated by MRP include: performance control reports, which are used to track problems like
missed delivery dates and stock outs in order to evaluate system performance; planning reports,
which can be used in forecasting future inventory requirements; and exception reports, which call
managers' attention to major problems like late orders or excessive scrap rates.
Although working backward from the production plan for a finished product to determine the
requirements for components may seem like a simple process, it can actually be extremely
complicated, especially when some raw materials or parts are used in a number of different products.
Frequent changes in product design, order quantities, or production schedule also complicate matters.
The importance of computer power is evident when one considers the number of materials schedules
that must be tracked.
Benefits and Drawbacks of MRP
MRP systems offer a number of potential benefits to manufacturing firms. Some of the main benefits
include helping production managers to minimize inventory levels and the associated carrying costs,
track material requirements, determine the most economical lot sizes for orders, compute quantities
needed as safety stock, allocate production time among various products, and plan for future capacity
needs. The information generated by MRP systems is useful in other areas as well. There is a large
range of people in a manufacturing company that may find the use of information provided by an MRP
system very helpful. Production planners are obvious users of MRP, as are production managers, who
must balance workloads across departments and make decisions about scheduling work. Plant
foremen, responsible for issuing work orders and maintaining production schedules, also rely heavily
on MRP output. Other users include customer service representatives, who need to be able to provide
projected delivery dates, purchasing managers, and inventory managers.
MRP systems also have several potential drawbacks. First, MRP relies upon accurate input
information. If a small business has not maintained good inventory records or has not updated its bills
of materials with all relevant changes, it may encounter serious problems with the outputs of its MRP
system. The problems could range from missing parts and excessive order quantities to schedule
delays and missed delivery dates. At a minimum, an MRP system must have an accurate master
production schedule, good lead-time estimates, and current inventory records in order to function
effectively and produce useful information.
Another potential drawback associated with MRP is that the systems can be difficult, time consuming,
and costly to implement. Many businesses encounter resistance from employees when they try to
implement MRP. For example, employees who once got by with sloppy record keeping may resent the
discipline MRP requires. Or departments that became accustomed to hoarding parts in case of
inventory shortages might find it difficult to trust the system and let go of that habit.
The key to making MRP implementation work is to provide training and education for all affected
employees. It is important early on to identify the key personnel whose power base will be affected
by a new MRP system. These people must be among the first to be convinced of the merits of the new
system so that they may buy into the plan. Key personnel must be convinced that they personally will
be better served by the new system than by any alternate system. One way to improve employee
acceptance of MRP systems is to adjust reward systems to reflect production and inventory
management goals.
MRP II
In the 1980s, MRP technology was expanded to create a new approach called manufacturing
resources planning, or MRP II. "The techniques developed in MRP to provide valid production
schedules proved so successful that organizations became aware that with valid schedules other
resources could be better planned and controlled," Gordon Minty noted in his book Production
Planning and Controlling. "The areas of marketing, finance, and personnel were affected by the
improvement in customer delivery commitments, cash flow projections, and personnel management
projections."
Minty went on to explain that MRP II "has not replaced MRP, nor is it an improved version of it.
Rather, it represents an effort to expand the scope of production resource planning and to involve
other functional areas of the firm in the planning process," such as marketing, finance, engineering,
purchasing, and human resources. MRP II differs from MRP in that all of these functional areas have
input into the master production schedule. From that point, MRP is used to generate material
requirements and help production managers plan capacity. MRP II systems often include simulation
capabilities so managers can evaluate various options.
Implementing or improving Material Requirements Planning can provide the following benefits for
your company:
• Reduced Inventory Levels
• Reduced Component Shortages
• Improved Shipping Performance
• Improved Customer Service
• Improved Productivity
• Simplified and Accurate Scheduling
• Reduced Purchasing Cost
• Improve Production Schedules
• Reduced Manufacturing Cost
• Reduced Lead Times
• Less Scrap and Rework
• Higher Production Quality
• Improved Communication
• Improved Plant Efficiency
• Reduced Freight Cost
• Reduction in Excess Inventory
• Reduced Overtime
• Improved Supply Schedules
• Improved Calculation of Material Requirements
• Improved Competitive Position
Quality
The word quality is often used indiscriminately for many different meanings. Quality can be defined
as “fitness for use,” “customer satisfaction,” “doing things right the first time,” or “zero defects.”
These definitions are acceptable because quality can refer to degrees of excellence. Webster’s
dictionary defines quality as “an inherent characteristic, property or attribute.” Quality is a
characteristic of a product or process that can be measured. Quality control is the science of keeping
these characteristics or qualities within certain bounds.
In a manufacturing or service environment, there are two major categories of quality: quality of
design and quality of conformance. A poorly designed product will not function properly regardless
of how well it meets its specifications. Conversely, a product that does not conform to excellent
design specifications will not properly perform its intended function.
Basic Quality Concepts
A Brief History of Quality
1550 BC - Egyptian royal cubit was standardized. It was about 20.63'' ± .02''.
1654 - Blaise Pascal with Pierre de Fermat developed the theory of probability. They were prompted
by the inquiries of gamblers seeking inside information to help them win at cards and dice.
Early 1800's - Concepts of tolerances and gauging were developed in American armories.
1861-1865, Civil War - Tolerance and gauging concepts were used to mass produce arms with
interchangeability of parts.
After the Civil War - Tolerance and gauging concepts were used and improved by companies such
as Singer and McCormick.
1916 - Ford Motor Company developed systematic material handling, machine tool design, factory
layout and final inspection. Automobile production went from ten thousand cars in 1909 to sixty
thousand in 1916. The price decreased from $850 to $350 per car.
1917 - The first published use of the term Control of Quality appeared in Industrial Management in an
article by G. S. Radford.
1922 - G. S. Radford published the first book on Quality Control: The Control of Quality of
Manufacturing.
1924 - Dr. Walter A. Shewhart of AT&T developed the concept of control charts. Dr. Shewhart is
referred to as the father of statistical quality control.
1925 - Harold F. Dodge of AT&T developed sampling concepts and terminology used in acceptance
sampling.
1931 - Dr. Walter A. Shewhart published Economic Control of Manufactured Product. This was the
first in-depth book on statistical quality control.
1941-1945 - The United States was involved in World War II. The war generated the first extensive
use of statistical concepts. U.S. Government suppliers were required to use statistical quality control.
The government sponsored many statistics and quality control training classes.
1941 - Harold F. Dodge and Harry G. Romig published a unique book on sampling
procedures. Single and Double Sampling Inspection Tables. These tables were the forerunners of the
military standard sampling tables.
1944 - The Dodge-Romig Sampling Tables were published. OC curves, lot sizes and sample sizes are
given by AOQL. The tables include single and double sampling plans.
1946 - The ASQC was organized and George Edwards of AT&T became the first president.
1947 - ASQC created the Shewhart medal to recognize outstanding contributors to the quality
profession.
1950 - Joseph M. Juran and W. Edwards Deming taught statistical methods and statistical quality
control to the Japanese.
1950 - Military Standard for Sampling by Attributes was published as Mil-Std 105A.
1951 - Joseph M. Juran published the first edition of Quality Control Handbook.
1968 - ASQC administers the first examination for Certified Quality Engineer. There were 147
successful candidates.
1970's - The focus was on continuous improvement and employee involvement.
1980's - The emphasis was on quality of design and design for manufacturability. Computers were
used extensively in all aspects of quality.
1987 - The International Organization for Standardization (ISO) establishes ISO 9000 Series Quality
System Standards.
1987 - Congress established the Malcolm Baldrige National Quality Award to promote quality
awareness, to recognize significant quality achievements of U.S.companies, and to call public
attention to successful quality strategies. The award is not for specific products or services.
1988 - The first Baldrige award winners were announced. They were Globe Metallurgical Inc. (small
business), Motorola Inc. (manufacturing) and Westinghouse Electric Corporation’s Commercial
Nuclear Fuel Division (manufacturing).
1989 - Military Standard for Sampling by Attributes is reissued as Mil-Std 105E.
1990's - Quality Concepts were extended to service industries. Emphasis is on total quality
management (TQM) and customer satisfaction.
1993 - ANSI/ASQC Z1.4 Sampling Tables and Procedures replaced Mil-Std 105E.
1994 - ISO 9000 Standards were revised (for clarification?). ANSI/ASQC series standards renamed
from Q90 series to Q9000 series.
1996 - Eight thousand U.S. companies have achieved ISO registration since its inception. Eight
percent of all companies that are ISO registered are located in North America. Forty six percent are
located in the United Kingdom.
1996 - Since the ASQC certification program began, more than 55,000 people have become certified
in one or more of the certification areas.
1997 - The American Society for Quality Control (ASQC) officially changed its name to the
American Society for Quality (ASQ).
The Nature of Variation
While standing on a street corner observing the passing traffic, two cars of the same make and model
stop at a traffic light. Both cars are the same color, have Goodyear tires and have a luggage rack on
the trunk. At first glance, the cars seem identical. Upon closer observation, differences are detected.
Both cars have Goodyear tires, but are the tires the same size? Are the radios the same? Is the
upholstery the same? There are many characteristics for comparison.
The closer an item is examined; the more differences are found. No two objects are exactly alike. All
things differ by some degree. Some variation may be obvious, but other variation may require precise
measuring equipment to detect.
All manufactured parts exhibit variation. It is the concept of variation that forms the basis of
probability, statistics and quality control. Consider a part that is produced by a punch press. As raw
material is fed into the press, the machine punches out the parts. Eventually the press will produce a
large number of similar parts. A visual check of the diameters may reveal no differences among the
parts. If the diameter is measured with a scale, some differences will be found. If the measurements
are made with a micrometre, a greater number of differences will be detected. Each level of
comparison or method of measurement reveals a greater amount of variation.
As the measurements increase in precision, the differences among the parts become greater and
greater until ultimately none of the parts would be the same. As the level of comparison becomes
more precise, the concept that no two objects are exactly alike is realized.
Design Quality
Design quality refers to the level of characteristics that the designers specify for a product. High-
grade materials, tight tolerances, special features and high performance are characteristics associated
with the term, high quality product.
An example of design quality may be shown by the comparison between an expensive automobile and
an economy model. A Ferrari and a Ford Escort are compared. Both cars will perform the same basic
function of getting from point A to point B. Each will generally conform to its design specification.
The owners in both cases may be satisfied with the way their cars are put together. However, that is
where the similarity ends. The Escort owner does not expect his car to go 150 mph, have leather seats
and have twelve coats of paint, or be highly responsive. The Ferrari owner expects these
characteristics or qualities.
The cost of making a product will usually rise as more characteristics are specified to increase
product performance, improve comfort, improve ease of use and make the product look better. High-
grade materials usually command a premium price. However, in many cases, increased competition
creates an atmosphere of finding ways to make better and less expensive designs. This is true for
products such as computers, VCRs and televisions.
The reliability of a product must be considered in the design stage. Reliability is the probability that a
product will perform its intended function, without failure, for a specified length of time. Reliability
is dependent on the basic design, the quality of materials and the quality of components that go into
the final product. To achieve the required reliability, designers may need to specify higher priced
components. This may translate to higher prices but also higher value for the consumer.
Many products command a premium price because they provide value to the consumer. Others may be
expensive because of their role as status symbols. Expensive products do not always contribute to
better product performance or customer satisfaction. This is particularly true in the software industry.
Many low priced applications work just as well and sometimes better than expensive ones.
The designer may receive input from various sources when determining the level of design quality. In
addition to the designer’s own ideas, input concerning product performance, materials to be used and
various product characteristics may be received from management, marketing, sales, other
engineering organizations or directly from customers. The final design specification may or may not
be what the designer had in mind.
Although some quality engineers and other quality professionals get involved with product design,
their time and effort is usually spent in designing and maintaining systems to measure and control
process and product characteristics after the design is complete. A challenge to quality engineers is to
implement the statistical techniques used in manufacturing during the design stage. The goals would
be to enhance product design by eliminating problems early in the design process to ensure the ease
of manufacturing.
Conformance Quality
After the level of design quality has been determined, the product characteristics are formed into
drawings and specifications. The manufacturing engineers will use the drawings and specifications to
develop manufacturing specifications and design the operations necessary to produce the product.
This includes the floor layout, machinery, test sets, tools and other equipment. A plan for the number
of employees required may also be included. The quality engineer works with the manufacturing
engineer to make the quality system and maintenance of conformance quality an integral part of the
manufacturing process. Any product checks, process checks or quality improvement activities should
be an inherent part of the process. Conformance quality may be defined as the degree of adherence of
the product characteristics to the design drawings and specifications. The objective of a quality
program is to have a system that will measure and control the degree of product and process
conformance in the most economical way.
The quality engineer will determine what product or process characteristics are to be checked. The
quality engineer will also determine the type of data to be collected, the corrective actions required,
and the statistical tools or other techniques to be used.
Quality Systems
A quality system is a mechanism that coordinates and maintains the activities needed to ensure that the
characteristics of products, processes or services are within certain bounds. A quality system
involves every part of an organization that directly or indirectly affects these activities. Typically, the
quality system is documented in a quality manual and in the associated documents that specify
procedures and standards.
Basic Elements in a Quality System
There are three basic elements in a quality system: Quality Management, Quality Control, and Quality
Assurance.
Quality Management: Quality management is the means of implementing and carrying out quality
policy. They perform goal planning and manage quality control and quality assurance activities.
Quality management is responsible for seeing that all quality goals and objectives are implemented
and that corrective actions have been achieved. They periodically review the quality system to ensure
effectiveness and to identify and review any deficiencies.
Quality Control: The term quality control describes a variety of activities. It encompasses all
techniques and activities of an organization that continuously monitor and improve the conformance of
products, processes or services to specifications. Quality control may also include the review of
processes and specifications and make recommendations for their improvement. Quality control aims
to eliminate causes of unsatisfactory performance by identifying and helping to eliminate or at least
narrow the sources of variation. Quality control has the same meaning as variation control of product
characteristics.
The objective of a quality control program is to define a system in which products meet design
requirements and checks and feedback for corrective actions and process improvements. Quality
control activities should also include the selecting and rating of suppliers to ensure that purchased
products meet quality requirements.
Quality Assurance: The term quality assurance describes all the planned and systematic actions
necessary to assure that a product or service will satisfy the specified requirements. Usually this
takes the form of an independent final inspection. The distinction between quality control and quality
assurance is stated in an ANSI/ASQ standard: “Quality control has to do with making quality what it
should be, and quality assurance has to do with making sure quality is what it should be.” The quality
assurance function should represent the customer and be independent of the quality control function,
which is an integral part of the manufacturing operation.
Fundamental Principles of Quality
Statistical Quality Control and Statistical Process Control
Statistical quality control (SQC) and statistical process control (SPC) are scientific methods for
analyzing data and keeping the process within certain boundaries. Many statistical tools, such as
control charts, Pareto analysis, design of experiments, regression analysis and acceptance sampling
may be used. SQC methods can be applied to anything that is possible to express in the form of
numbers. SQC is concerned with product characteristics and SPC is concerned with process
characteristics.
The word statistical means having to do with numbers, or more specifically, with drawing
conclusions from numbers. The word quality means much more than the goodness or defectiveness of
the product. It refers to the qualities or characteristics of the product or process being studied. The
word control means to keep something within boundaries or to regulate it so that its outcome may be
predicted with some degree of accuracy. In a manufacturing operation, conformance quality
characteristics are to be kept within certain bounds. Taken together, the words Statistical Quality
Control or Statistical Process Control mean:
Statistical - With the help of numbers or data,
Quality or Process - The characteristics of a product or process are studied,
Control - To make them behave the way they are intended to behave.
The most important element in statistical quality control is the feedback loop between the quality
control function and the make operation. In statistical process control, the feedback loop is between
the process control function and the device that regulates the process or the person responsible for
adjustments. Continuous feedback and the appropriate corrective action drive statistical quality
control and statistical process control to achieve the desired results. Both SQC and SPC seem to
work best when the checks and feedback loops are automated and human intervention is minimized.
The Law of Large Numbers
The law of large numbers is a mathematical concept that says: Individual occurrences are
unpredictable and group occurrences are predictable. The number of marriages, births and deaths in
the United States next year can be predicted with some degree of accuracy, but exactly who will get
married, who will be born or who will die cannot be predicted. This concept can be applied to a
manufacturing process. For example, a statistical study can determine that products from a certain
process are on average two percent defective. However, in any sample, the specific parts that will be
defective cannot be predicted.
Central Limit Theorem
The central limit theorem states that a group of averages of sample size 4, 5 or 6 units always tends to
follow the pattern of a normal distribution. If the population distribution leans to one side or the other,
the distribution of sample averages from that population will tend to be symmetrical and have normal
variation. The central limit theorem is what legitimizes the use of variables control charts regardless
of the actual population distribution. The normal distribution and control charts will be reviewed in a
subsequent chapter.
Data
Webster's dictionary defines the word data as a plural noun portraying factual information such as
measurements or statistics used as a basis for reasoning, discussion, or calculation. Data are
categorized in two ways: attribute data and variables data. Data classified as good/bad, pass/fail,
go/no-go, etc., are called attribute or discrete data. When actual measurements are taken and
recorded, the data are called variables or continuous data. In many cases (but not all cases), variables
data will be distributed in a symmetrical bell-shaped curve called the normal curve. The known areas
under the curve allow for inferences to be made about the process with relatively small amounts of
information. By using the known areas under the curve, the fraction of measurements that will lie
between, above, or below certain values can be predicted with a high degree of accuracy.
Distributions
Because of variation between measurements of individual parts, data when plotted will form a
distribution. A distribution model describes how the data are dispersed. A plot of the distribution
will show a center value and the range of measurements. The variation between data values will
usually be quite small and follow a natural pattern. Large variation indicates that the pattern is
unnatural. This may be attributed to external or assignable causes. When a pattern is unnatural, the
cause should be investigated and eliminated. Statistical techniques such as control charts are used to
identify the unnatural patterns. A plot of the actual data showing the data values versus the number of
occurrences is called a histogram. A mathematical estimate of the shape of the histogram is called a
frequency distribution. Distributions are formed because everything in the world that can be measured
exhibits variation. If the measuring instrument is very precise, it will be discovered that like the
snowflake, no two measurements are exactly the same.
Precision and Accuracy
In addition to the objects that are measured, the measuring instrument itself has variability. Two
different instruments may measure the same parts and yield different results. In many cases, measuring
parts a second time with the same instruments will give a different result. A low value of the
instrument’s standard deviation indicates greater precision. When an instrument is accurate but not
precise, the measurements are distributed about the true value within the acceptable range. When an
instrument is precise but not accurate, the measurements are clustered close together but at a distance
from the true value. When an instrument is both accurate and precise, the data are clustered close
together around the true value.
Statistical Techniques
Many statistical techniques are used in quality control and inspection. Listed below are the most
widely used statistical methods.
• Histograms
• Acceptance Sampling
• Statistical Inference
• Process Capability Analysis
• Hypothesis Testing
• Reliability
• Decision Errors
• Regression & Correlation
• Statistical Process Control
• Design of Experiments
• Control Charts
• Pareto Analysis
Cost of Quality
Cost of poor quality (COPQ)
The costs associated with providing poor quality products or services. There are four categories:
internal failure costs (costs associated with defects found before the customer receives the product or
service), external failure costs (costs associated with defects found after the customer receives the
product or service), appraisal costs (costs incurred to determine the degree of conformance to quality
requirements) and prevention costs (costs incurred to keep failure and appraisal costs to a minimum).
Cost of quality is a methodology that allows an organization to determine the extent to which its
resources are used for activities that prevent poor quality, that appraise the quality of the
organization’s products or services, and that result from internal and external failures. Having such
information allows an organization to determine the potential savings to be gained by implementing
process improvements.
Quality-related activities that incur costs may be divided into prevention costs, appraisal costs, and
internal and external failure costs.
Prevention costs
Prevention costs are incurred to prevent or avoid quality problems. These costs are associated with
the design, implementation, and maintenance of the quality management system. They are planned and
incurred before actual operation, and they could include:
Product or service requirements—establishment of specifications for incoming materials, processes,
finished products, and services
Quality planning—creation of plans for quality, reliability, operations, production, and inspection
Quality assurance—creation and maintenance of the quality system
Training—development, preparation, and maintenance of programs
Appraisal costs
Appraisal costs are associated with measuring and monitoring activities related to quality. These
costs are associated with the suppliers’ and customers’ evaluation of purchased materials, processes,
products, and services to ensure that they conform to specifications. They could include:
Verification—checking of incoming material, process setup, and products against agreed
specifications
Quality audits—confirmation that the quality system is functioning correctly
Supplier rating—assessment and approval of suppliers of products and services
Internal failure costs
Internal failure costs are incurred to remedy defects discovered before the product or service is
delivered to the customer. These costs occur when the results of work fail to reach design quality
standards and are detected before they are transferred to the customer. They could include:
Waste—performance of unnecessary work or holding of stock as a result of errors, poor organization,
or communication
Scrap—defective product or material that cannot be repaired, used, or sold
Rework or rectification—correction of defective material or errors
Failure analysis—activity required to establish the causes of internal product or service failure
External failure costs
External failure costs are incurred to remedy defects discovered by customers. These costs occur
when products or services that fail to reach design quality standards are not detected until after
transfer to the customer. They could include:
Repairs and servicing—of both returned products and those in the field
Warranty claims—failed products that are replaced or services that are re-performed under a
guarantee
Complaints—all work and costs associated with handling and servicing customers’ complaints
Returns—handling and investigation of rejected or recalled products, including transport costs
Cost of quality and organizational objectives
The costs of doing a quality job, conducting quality improvements, and achieving goals must be
carefully managed so that the long-term effect of quality on the organization is a desirable one.
These costs must be a true measure of the quality effort, and they are best determined from an analysis
of the costs of quality. Such an analysis provides a method of assessing the effectiveness of the
management of quality and a means of determining problem areas, opportunities, savings, and action
priorities.
Cost of quality is also an important communication tool. Philip Crosby demonstrated what a powerful
tool it could be to raise awareness of the importance of quality. He referred to the measure as the
“price of non-conformance” and argued that organizations choose to pay for poor quality.
Many organizations will have true quality-related costs as high as 15 to 20 percent of sales revenue,
some going as high as 40 percent of total operations. A general rule of thumb is that costs of poor
quality in a thriving company will be about 10 to 15 percent of operations. Effective quality
improvement programs can reduce this substantially, thus making a direct contribution to profits.
The quality cost system, once established, should become dynamic and have a positive impact on the
achievement of the organization’s mission, goals, and objectives.
Statistical quality control (SQC)
The application of statistical techniques to measure and evaluate the quality of a product, service, or
process.
Two basic categories:
I. Statistical process control (SPC):
- the application of statistical techniques to determine whether a process is functioning as desired
II. Acceptance Sampling:
- the application of statistical techniques to determine whether a population of items should be
accepted or rejected based on inspection of a sample of those items.
Quality Measurement: Attributes vs Variables
Attributes:
Characteristics that are measured as either "acceptable" or "not acceptable", thus have only discrete,
binary, or integer values.
Variables:
Characteristics that are measured on a continuous scale.
Statistical Process Control (SPC) Methods
Statistical process control (SPC) monitors specified quality characteristics of a product or service so
as:
To detect whether the process has changed in a way that will affect product quality and
To measure the current quality of products or services.
Control is maintained through the use of control charts. The charts have upper and lower control
limits and the process is in
control if sample measurements are between the limits.
Control Charts for Attributes
P Charts - measures proportion defective.
C Charts - measures the number of defects/unit.
Control Charts for Variables
X bar and R charts are used together - control a process by ensuring that the sample average and
range remain within
limits for both.
Basic Procedure
1. An upper control limit (UCL) and a lower control limit (LCL) are set for the process.
2. A random sample of the product or service is taken, and the specified quality characteristic is
measured.
3. If the average of the sample of the quality characteristic is higher than the upper control limit or
lower than the lower control limit, the process is considered to be "out of control".
Control Charts for Attributes
p-Charts for Proportion Defective
p-chart: a statistical control chart that plots movement in the sample proportion defective (p) over
time
Procedure:
1. take a random sample and inspect each item
2. determine the sample proportion defective by dividing the number of defective items by the sample
size
3. plot the sample proportion defective on the control chart and compare with UCL and LCL to
determine if process is out of control
The underlying statistical sampling distribution is the binomial distribution, but can be approximated
by the normal distribution with:
mean = u = np (Note - add the bars above the means used in all the equations in this section)
standard deviation of p: sigmap = square root of (p(1 -p ) / n)
where p = historical population proportion defective and n = sample size
Control Limits:
UCL = u + z sigmap
LCL = u - z sigma p
z is the number of standard deviations from the mean. It is set based how certain you wish to be that
when a limit is exceeded it is due to a change in the process proportion defective rather than due to
sample variability. For example:
If z = 1 if p has not changed you will still exceed the limits in 32% of the samples (68% confident that
mean has changed if the limits are exceeded.
z = 2 - limits will be exceeded in 4.5 (95.5 % confidence that mean has changed)
z = 3 - limits will be exceeded in .03 (99.7% confidence)
c-Charts for Number of Defects Per Unit
c-chart: a statistical control chart that plots movement in the number of defects per unit.
Procedure:
1. randomly select one item and count the number of defects in that item
2. plot the number of defects on a control chart
3. compare with UCLand LCLto determine if process is out of control
The underlying sampling distribution is the Poisson distribution, but can be approximated by the
normal distribution with: mean = c
standard deviation = square root of c
where c is the historical average number of defects/unit
Control Limits:
UCL = c + z c
LCL = c - z c
Control Charts for Variables
Two charts are used together: R-chart ("range chart") and X barchart ("average chart")
Both the process variability (measured by the R-chart) and the process average (measured by the X
bar chart) must be in control before the process can be said to be in control.
Process variability must be in control before the X bar chart can be developed because a measure of
process variability is required to determine the -chart control limits.
R-Chart for Process Variability:
UCLR = D4(R)
LCLR = D3(R)
where is the average of past R values, and D3 and D4 are constants based on the sample size
Chart for Process Average:
UCLR = X bar + A2(R)
LCL = X bar - A2(R)
where X bar is the average of several past values, and A2 is a constant based on the sample size
Other Types of Attribute-Sampling Plans
Double-Sampling Plan:
Specifies two sample sizes (n1 and n2) and two acceptance levels (c1 and c2)
1. if the first sample passes (actual defects c1), the lot is accepted
2. if the first sample fails and actual defects > c2, the lot is rejected
3. if first sample fails but c1 < actual defects c2, the second sample is taken and judged on the
combined number of defectives found.
Acceptance Sampling
Goal: To accept or reject a batch of items. Frequently used to test incoming materials from suppliers
or other parts of the organization prior to entry into the production process.
Used to determine whether to accept or reject a batch of products. Measures number of defects in a
sample. Based on the number of defects in the sample the batch is either accepted or rejected. An
acceptance level c is specified. If the number of defects in the sample is c the sample is accepted,
otherwise it is rejected and subjected to 100% inspection.
Acceptance sampling is a major component of quality control and is useful when the cost of testing is
high compared to the cost of passing a defective item or when testing is destructive. It is a
compromise between doing 100% inspection and no inspection at all. Acceptance sampling can be
done on attributes or measurements of the product.
You can use acceptance sampling to develop inspection plans that enable you to accept or reject a
particular lot of incoming material based on the data from a representative sample.
Example of an attribute acceptance sampling plan
For example, you receive a shipment of 10,000 microchips. You either cannot or do not want to
inspect the entire shipment. An attribute sampling plan can help you determine how many microchips
you need to examine (sample size) and how many defects are allowed in that sample (acceptance
number).
In this case, suppose your acceptable quality level (AQL) is 1.5% and the rejectable quality level
(RQL) is 5.0%, and you assume alpha = 0.05 and beta = 0.1. Minitab generates a sampling plan that
indicates that you need to inspect 206 chips. If 6 or less of the 206 inspected microchips are
defective, you can accept the entire shipment. If 7 or more chips are defective, you must reject the
entire shipment.
Example of a variables acceptance sampling plan
For example, you receive shipments of 2500 plastic pipe segments each week and you need to verify
that the wall thickness measurements meet specifications. You either cannot or do not want to inspect
the entire shipment. A variables sampling plan can help you determine how many pipes you need to
measure (sample size) and the criteria for accepting or rejecting an entire lot (critical distance).
In this case, the lower specification for the wall thickness of the piping is 0.09". You and the supplier
agree that the acceptable quality level (AQL) is 100 defectives per million and the rejectable quality
level (RQL) is 300 defectives per million, and you assume alpha = 0.05 and beta = 0.1. Minitab
generates a sampling plan that indicates that you need to measure 104 pipes and indicates that the
critical distance is 3.5570. You can use the accept/reject tool in Minitab to indicate whether a
shipment should be accepted or rejected.
Types of maintenance
Traditionally, 5 types of maintenance have been distinguished, which are differentiated by the nature
of the tasks that they include:
Corrective maintenance
The set of tasks is destined to correct the defects to be found in the different equipment and that are
communicated to the maintenance department by users of the same equipment.
Preventive Maintenance
Its mission is to maintain a level of certain service on equipment, programming the interventions of
their vulnerabilities in the most opportune time. It is used to be a systematic character, that is, the
equipment is inspected even if it has not given any symptoms of having a problem.
Predictive Maintenance
It pursues constantly know and report the status and operational capacity of the installations by
knowing the values of certain variables, which represent such state and operational ability. To apply
this maintenance, it is necessary to identify physical variables (temperature, vibration, power
consumption, etc.). Which variation is indicative of problems that may be appearing on the
equipment. This maintenance it is the most technical, since it requires advanced technical resources,
and at times of strong mathematical, physical and / or technical knowledge.
Zero Hours Maintenance (Overhaul)
The set of tasks whose goal is to review the equipment at scheduled intervals before appearing any
failure, either when the reliability of the equipment has decreased considerably so it is risky to make
forecasts of production capacity. This review is based on leaving the equipment to zero hours of
operation, that is, as if the equipment were new. These reviews will replace or repair all items
subject to wear. The aim is to ensure, with high probability, a good working time fixed in advance.
Periodic maintenance (Time Based Maintenance TBM)
The basic maintenance of equipment made by the users of it. It consists of a series of elementary tasks
(data collections, visual inspections, cleaning, lubrication, retightening screws) for which no
extensive training is necessary, but perhaps only a brief training. This type of maintenance is the
based on TPM (Total Productive Maintenance).
Operational Management in service
Though the primary function of both manufacturers and service providers is to satisfy customer needs,
there are several important differences between the two types of operations. Let’s focus on three of
them:
• Intangibility. Manufacturers produce tangible products—things that can be touched or handled, such
as automobiles and appliances. Service companies provide intangible products, such as banking,
entertainment, or education.
• Customization. Manufactured goods are generally standardized; one twelve-ounce bottle of Pepsi is
the same as any other twelve-ounce bottle of Pepsi. Services, by contrast, are often customized to
satisfy the specific needs of a customer. When you go to the barber or the hairdresser, you ask for a
haircut that looks good on you because of the shape of your face and the texture of your hair. When
you go to the dentist, you ask him or her to fill or pull the tooth that’s bothering you.
• Customer contact. You could spend your entire working life assembling cars in Detroit and never
meet a customer who bought a car that you helped to make. But if you were a waitress, you’d interact
with customers every day. In fact, their satisfaction with your product would be determined in part by
the service that you provided. Unlike manufactured goods, many services are bought and consumed at
the same time.
Operations Planning
When starting or expanding operations, businesses in the service sector must make a number of
decisions quite similar to those made by manufacturers:
• What services (and perhaps what goods) should they offer?
• How will they provide these services?
• Where will they locate their business, and what will their facilities look like?
• How will they forecast demand for their services?
Operations Processes
Service organizations succeed by providing services that satisfy customers’ needs. Companies that
provide transportation, such as airlines, have to get customers to their destinations as quickly and
safely as possible. Companies that deliver packages, such as FedEx, must pick up, sort, and deliver
packages in a timely manner. Colleges must provide quality educations. Companies that provide both
services and goods, such as Domino’s Pizza, have a dual challenge: they must produce a quality good
and deliver it satisfactorily.
Service providers that produce goods can, like manufacturers, adopt either a make-to-order or
a make-to-stock approach to manufacturing them. BK, which encourages patrons to customize burgers
and other menu items, uses a make-to-order approach. BK can customize products because it builds
sandwiches one at a time rather than batch-process them. Meat patties, for example, go from the grill
to a steamer for holding until an order comes in. Then the patty is pulled from the steamer and
requested condiments are added. Finally, the completed sandwich chutes to a counter worker, who
gives it to the customer. In contrast, many of BK’s competitors, including McDonald’s, rely on a
make-to-stock approach in which a number of sandwiches are made at the same time with the same
condiments. If a customer wants, say, a hamburger without onions, he or she has to wait for a new
batch of patties to be grilled. The procedure could take up to five minutes, whereas BK can process a
special order in thirty seconds.
Facilities
When starting or expanding a service business, owners and managers must invest a lot of time in
selecting a location, determining its size and layout, and forecasting demand. A poor location or a
badly designed facility can cost customers, and inaccurate estimates of demand for products can
result in poor service, excessive costs, or both.
Site Selection
People in the real estate industry often say that the three most important factors to consider when
you’re buying a home are location, location, location. The same principle applies when you’re trying
to locate a service business. To be successful in a service industry, you need to be accessible to your
customers. Some service businesses, such as cable-TV providers, package-delivery services, and e-
retailers, go to their customers. Many others, however—hotels, restaurants, stores, hospitals, and
airports—have to attract customers to their facilities. These businesses must locate where there’s a
high volume of available customers.
Size and Layout
Because manufacturers do business out of plants rarely visited by customers, they base the size and
layout of their facilities solely on production needs. In the service sector, however, most businesses
must design their facilities with the customer in mind: they must accommodate the needs of their
customers while keeping costs as low as possible. Performing this twofold task isn’t easy.
Capacity Planning
Estimating capacity needs for a service business isn’t the same thing as estimating those of a
manufacturer. A manufacturer can predict overall demand, produce the product, store it in inventory,
and ship it to a customer when it’s ordered. Service providers, however, can’t store their products for
later use: hairdressers can’t “inventory” haircuts, hospitals can’t “inventory” operations, and
amusement parks can’t “inventory” roller-coaster rides. Service firms have to build sufficient
capacity to satisfy customers’ needs on an “as-demanded” basis. Like manufacturers, service
providers must consider many variables when estimating demand and capacity:
• How many customers will I have?
• When will they want my services (which days of the week, which times of the day)?
• How long will it take to serve each customer?
• How will external factors, such as weather or holidays, affect the demand for my services?
Managing Operations
Overseeing a service organization puts special demands on managers, especially those running firms,
such as hotels, retail stores, and restaurants, that have a high degree of contact with customers.
Service firms provide customers with personal attention and must satisfy their needs in a timely
manner. This task is complicated by the fact that demand can vary greatly over the course of any given
day. Managers, therefore, must pay particular attention to employee work schedules and (in some
cases) inventory management.
Scheduling
In manufacturing, managers focus on scheduling the activities needed to transform raw materials into
finished goods. In service organizations, they focus on scheduling workers so that they’re available to
handle fluctuating customer demand. Each week, therefore, every BK store manager schedules
employees to cover not only the peak periods of breakfast, lunch, and dinner, but also the slower
periods in between. If he or she staffs too many people, labor cost per sales dollar will be too high. If
there aren’t enough employees, customers have to wait in lines. Some get discouraged, and even
leave, and many may never come back.
Inventory Control
Businesses that provide both goods and services, such as retail stores and auto-repair shops, have the
same inventory-control problems as manufacturers: keeping levels too high costs money, while
running out of inventory costs sales. System tracks everything sold during a given time and lets each
store manager know how much of everything should be kept in inventory. It also makes it possible to
count the number of burgers and buns, bags and racks of fries, and boxes of beverage mixes at the
beginning or end of each shift. Because there are fixed numbers of supplies—say, beef patties or bags
of fries—in each box, employees simply count boxes and multiply. In just a few minutes, the manager
knows whether the inventory is correct (and should be able to see if any theft has occurred on the
shift).
Contemporary issues in Production Management
Computer-Aided Design
That’s when Montgomery turned to computer technology for help and began using a computer-aided
design (CAD) software package to design not only the engine but also the board itself and many of its
components. The CAD program enabled Montgomery and his team of engineers to test the product
digitally and work out design problems before moving to the prototype stage.
The sophisticated CAD software allowed Montgomery and his team to put their design paper in a
drawer and to start building both the board and the engine on a computer screen. By rotating the image
on the screen, they could even view the design from every angle. Having used their CAD program to
make more than four hundred design changes, they were ready to test the Jetboard in the water. During
the tests, onboard sensors transmitted data to portable computers, allowing the team to make
adjustments from the shore while the prototype was still in the water. Nowadays, PowerSki
uses collaboration software to transmit design changes to the suppliers of the 340 components that
make up the Jetboard.
Computer-Aided Manufacturing
For many companies, the next step is to link CAD to the manufacturing process. A computer-aided
manufacturing (CAM) software system determines the steps needed to produce the component and
instructs the machines that do the work. Because CAD and CAM programs can “talk” with each other,
companies can build components that satisfy exactly the requirements set by the computer-generated
model. CAD/CAM systems permit companies to design and manufacture goods faster, more
efficiently, and at a lower cost, and they’re also effective in helping firms monitor and improve
quality. CAD/CAM technology is used in many industries, including the auto industry, electronics, and
clothing.
Computer-Integrated Manufacturing
By automating and integrating all aspects of a company’s operations, computer-integrated
manufacturing (CIM) systems have taken the integration of computer-aided design and manufacturing
to a higher level—and are in fact revolutionizing the production process. CIM systems expand the
capabilities of CAD/CAM. In addition to design and production applications, they handle such
functions as order entry, inventory control, warehousing, and shipping. In the manufacturing plant, the
CIM system controls the functions of industrial robots—computer-controlled machines used to
perform repetitive tasks that are also hard or dangerous for human workers to perform.
Flexible Manufacturing Systems
Finally, a CIM system is a common element in flexible manufacturing systems (FMS), in which
computer-controlled equipment can easily be adapted to produce a variety of goods. An FMS has
immense advantages over traditional production lines in which machines are set up to produce only
one type of good. When the firm needs to switch a production line to manufacture a new product,
substantial time and money are often spent in modifying equipment. An FMS makes it possible to
change equipment setups merely by reprogramming computer-controlled machines. Such flexibility is
particularly valuable to companies that produce customized products.
Operations management is the process in which resources/inputs are converted into more useful
products. In the light of global competition many recent trends in operations management have
evolved that have impact on manufacturing firms.
Some other Contemporary Issues are:
1. Flexibility: The ability to adapt quickly to changes in volumes of demand, in the product mix
demanded, and in product design or delivery schedules, has become a major competitive strategy and
a competitive advantage to the firms. This is sometimes called as agile manufacturing.
2. Total Quality Management: TQM approach has been adopted by many firms to achieve customer
satisfaction by a never ending quest for improving the quality of goods and services.
3. Time Reduction: Reduction of manufacturing cycle time and speed to marker for a new product
provide a competitive edge to a firm over other firms. When companies can provide products at the
same price and quality, quicker delivery (short lead time) provide one firm competitive edge over the
other.
4. Worker Involvement: The recent trends are to assign responsibility for decision making and
problem solving to the lower levels in the organization. This is known as employee involvement and
empowerment. Examples of employee’s empowerment are quality circle and use of work teams or
quality improvement teams.
5. Business Process Re-engineering: BPR involves drastic measures or break-through improvements
to improve the performance of a firm. It involves the concept of clean-state approach or starting from
a scratch in redesigning in business processes.
6. Global Market Place: Globalization of business has compelled many manufacturing firms to give
operations in many countries where they have certain economic advantage. This has resulted in a
steep increase in the level of competition among manufacturing firms throughout the world.
7. Operations Strategy: More and more firms are recognizing the importance of operations strategy
for the overall success of their business and the necessity for relating it to their overall business
strategy.
8. Lean production: Production system have become lean production systems which have minimal
amount of resources to produce a high volume of high quality goods with some variety. These systems
use flexible manufacturing systems and multi-skilled workforce to have advantages of both mass
production and job production.
9. Just in time production: JIT is a ‘pull’ system of production, so actual orders provide a signal for
when a product should be manufactured. Demand-pull enables a firm to produce only what is
required, in the correct quantity and at the correct time. This means that stock levels of raw materials,
components, work in progress and finished goods can be kept to a minimum. This requires a carefully
planned scheduling and flow of resources through the production process. For example, a car
manufacturing plant might receive exactly the right number and type of tyres for one day’s production,
and the supplier would be expected to deliver them to the correct loading bay on the production line
within a very narrow time slot.
10. E-Supply Chain Management: Supply chain management is the management of supply chain from
suppliers to final customers reduces the cost of transportation, warehousing and distribution
throughout the supply chain. But SCM was a traditional concept which is now being replaced by E-
SCM. E-Supply chain management is a series of Internet enabled value-adding activities to guarantee
products created by a manufacturing process can eventually meet customer requirements and realize
returns on investment. Supply chains have advanced in the last two decades with improved efficiency,
agility and accuracy. The recent advancement of Internet technology has brought more powerful
support to improving supply chain performance. In this context, e-supply chain management becomes
a new term that distinguishes itself by net-centric and real-time features from traditional supply chain
management.
11. Enterprise Resource Planning: Enterprise resource planning (ERP) is an enterprise-wide
information system designed to coordinate all the resources, information, and activities needed to
complete business processes such as order fulfilment or billing.
12. Environmental Issues: Today’s production managers are concerned more and more with pollution
control and waste disposal which are key issues in protection of environment and social
responsibility. There is increasing emphasis on reducing waste, recycling waste, using less-toxic
chemicals and using biodegradable materials for packaging.

production operation management

  • 2.
    POM BBA MGSU ByManish Tanwar
  • 3.
    This Book ismeant for students who are pursuing BBA course from MGS University, Bikaner. The book covers various theoretical topics in the subject of Production and Operation Management. It is recommended that the students use this book in consultation with their Guides for the numerical portion of the syllabus.
  • 4.
    Table of Contents Productionand Operation Management Types of Production/Manufacturing Systems Forecasting Capacity Planning Plant Location Plant Layout Production Planning and Control (PPC) Aggregate Planning Line Balancing PERT and CPM: Techniques of Project Management Inventory Management Material Requirements Planning Quality Basic Quality Concepts Fundamental Principles of Quality Cost of Quality Statistical quality control (SQC) Statistical Process Control (SPC) Methods Acceptance Sampling Types of maintenance Operational Management in service Contemporary issues in Production Management
  • 5.
    Production and OperationManagement Functions of Production and Operations Management Production and operations management concerns not only with the production of goods and services but also all the activities connected with the production. When the word ‘production’ is mentioned, it brings in the things like factories, machines, equipment, assembly lines. This is nothing but things related to manufacturing. In the past, emphasis was on manufacturing management, which subsequently got changed into production management. Production concepts and techniques are being applied to a wide range of activities and situations which have little or nothing to do with factories or manufacturing. These activities resulted not in the realization of goods but in services like banking, hotel management, health services, educations, transportation, recreating, government operations. Due to the widening of the scope, the name was changed from production management into operations management, where the concepts, tools and techniques are applied on diverse nature of activities. First let us define production. This is a process or a set of procedures to be executed in order to convert or transform a set of inputs into a pre-determined set of outputs in accordance with the objectives assigned to the production system. Generally, a system consists of a transformation or conversion process for a given input to be converted into the required output with a feedback mechanism, so that any deviation or irregularities can be identified and corrected, In the production environment the input may be labour, energy, capital, information and technology, the transformation process is the production processes and the output may take the form of products or services or processed information. Operations management, with its widened scope, is responsible for the management of productive systems, that is, it is responsible for systems which either create goods or private service or both. The operations management personnel have the ultimate responsibility for the creating of goods or services. The variety of jobs which the operations group will oversee will differ from one organization to another. But the basic task of coordinating the use of resources through the management process, which involves planning, organizing, staffing, directing and controlling. Planning involved determining a future course of action. The planning process begins by deciding what is desired and then designing the way for accomplishing that objective. Organizing refers to the administrative structure of the organization. It involves putting the parts of the system together in such a way that desired results can be achieved. Staffing involves selection and training of personnel who will operate the system. Directing refers to the release of commands or orders, making suggestions or otherwise motivating subordinates to perform their assigned duties in a timely and efficient manner. Controlling involves measuring the results of operations, deciding if they are acceptable and instituting corrective action if need be. Relationship between POM and other functions There are three primary functions, which exist in most of the organizations and they are Operations, Marketing and Finance. These three cannot be mutually exclusive and the functional overlap is unavoidable. The level of overlapping varies from one organisation to another. In addition to these three major functions of business organizations, the operation management function has to interact with many supporting functions. The supporting functions are research and development, product design, industrial engineering, maintenance, personnel, accounting, costing, materials, etc. The level of interaction and presence of some departments may be Exchange of
  • 6.
    information on currentand future decided based on the size of the organization, product line and type of management. The operations management personnel and the other major of support functional personnel have to necessarily interact with each other in the activities identified below: Finance • Economic analysis of investment products • Budgeting and timing of funds • Provision and release of funds Marketing • Developing and maintaining the market • Advertisement and sales promotion • Sales forecast • Production improvement / new product development. Research and Development • Idea generation • Product formulations • Prototype Development • Test Marketing Product Design • Preliminary and final design • Detailed Drawings • Assembly and parts manufacturing drawings • Quality standards • Exchange of information on current and future capabilities Maintenance • Evolution of maintenance policy • Implementation for general upkeep of equipment Industrial Engineering • Scheduling • Setting up of standards • Work methods: time study • Quality audit and contact • Material handling Materials • Procurement of materials and equipment • Inventory control • Economic order quantity and timing of purchase • Inspection and clearance • Vendor evaluation and rating Personnel • Recruitment and training • Labour relations • Wage and Salary administration
  • 7.
    • Manpower Projections Accountingand Costing • Preparation of financial statements • Cost data on labour, materials and overhead • Report on scrap, downtime and inventories • Payables, receivables management • Insurance
  • 8.
    Scope of POMaccording to time horizon Priority One of the primary responsibilities of the production and operations management is the productive use of resources. Productivity is a measure of the relative amount of input needed to secure a given amount of ailed and Feederick W. Taylor brought in the concept output. It is commonly expressed as the ratio of quantity of scientific management. The important events in this of output to quantity of input Productivity = Output / Input The enhancement of productivity is the need of the organisation and it can be made possible by either increasing the output and keeping the input at the same level or reducing the input and maintaining the output. The rate of increase in productivity will be very high if output is increased with simultaneous reduction of inputs. Manufacturing Operations Versus Service Operations Manufacturing implies production of a tangible output, such as an automobile, a refrigerator, or something similar that we can see or touch and feel. Service on the other hand, generally implies an act rather than a physical product. A doctor’s examination, TV and audio repair, entertainment like film shows are examples of services. The difference between manufacturing and service are in Table below:
  • 9.
    Types of Production/ManufacturingSystems A. Intermittent Production Intermittent means something that starts (initiates) and stops (halts) at irregular (unfixed) intervals (time gaps). In the intermittent production system, goods are produced based on customer's orders. These goods are produced on a small scale. The flow of production is intermittent (irregular). In other words, the flow of production is not continuous. In this system, large varieties of products are produced. These products are of different sizes. The design of these products goes on changing. It keeps changing according to the design and size of the product. Therefore, this system is very flexible. Intermittent production system the marketing efforts are directed towards meeting the individual orders for various products while in continuous productions the marketing efforts are directed towards developing distribution channels for the large volume of output. The design of a production system starts with the firm and re-occurs intermittently when redesign is necessary. The major decision in the design of production system is the location of plant. Once the location, has been decided the next decision relates to layout of facilities. Another problem which concerns the decision of production system is how products are designed and manufactured. Following are examples on the intermittent production system. 1. The work of a goldsmith is purely based on the frequency of his customer's orders. The goldsmith makes goods (ornaments) on a small-scale basis as per his customer's requirements. Here, ornaments are not done on a continuous basis. 2. Similarly, the work of a tailor is also based on the number of orders he gets from his customers. The clothes are stitched for every customer independently by the tailor as per one's measurement and size. Goods (stitched clothes) are made on a limited scale and is proportional to the number of orders received from customers. Here, stitching is not done on a continuous basis. The features/characteristics of an intermittent production system are listed as follows: 1. The flow of production is not continuous. It is intermittent. 2. Wide varieties of products are produced. 3. The volume of production is small. 4. General purpose machines are used. These machines can be used to produce different types of
  • 10.
    products. 5. The sequenceof operation goes on changing as per the design of the product. 6. The quantity, size, shape, design, etc. of the product depends on the customer's orders. The types of intermittent production system include: 1. Project production flows, 2. Jobbing production flows, and 3. Batch production flows. A.1 Project production system The first type of production system is the project, or one-shot system. For a single, one-of-a-kind product, for example, a building, a ship, or the prototype of a product such as an airplane or a large computer, resources are brought together only once. Because of the singular nature of project systems, special methods of management have been developed to contain the costs of production within reasonable levels, which are a mix of other four techniques viz. job shop, batch, mass and process production. A.2 Job Production/ Job Shop Production/ Jobbing production flow Under this method peculiar, special or non-standardized products are produced in accordance with the orders received from the customers. As each product is non- standardized varying in size and nature, it requires separate job for production. The machines and equipment’s are adjusted in such a manner so as to suit the requirements of a particular job. Job production involves intermittent process as the work is carried as and when the order is received. It consists of bringing together of material, parts and components in order to assemble and commission a single piece of equipment or product. Ship building, dam construction, bridge building, book printing are some of the examples of job production. Third method of plant layout viz., Stationery Material Layout is suitable for job production. Characteristics of job production possesses 1. A large number of general purpose machines are required. 2. A large number of workers conversant with different jobs will have to be employed. 3. There can be some variations in production. 4. Some flexibility in financing is required because of variations in work load. 5. A large inventory of materials, parts and tools will be required. 6. The machines and equipment setting will have to be adjusted and re​adjusted to the manufacturing requirements. 7. The movement of materials through the process is intermittent. Limitations of the job production process 1. The economies of large scale production may not be attained because production is done in short- runs. 2. The demand is irregular for some products. 3. The use of labour and equipment may be an inefficient. 4. The scientific assessment of costs is difficult. A.3 Batch production Batch production pertains to repetitive production. It refers to the production of goods, the quantity of which is known in advance. It is that form of production where identical products are produced in
  • 11.
    batches on thebasis of demand of customers’ or of expected demand for products. This method is generally similar to job production except the quantity of production. Instead of making one single product as in case of job production, a batch or group of products are produced at one time. It should be remembered here that one batch of products may not resemble with the next batch. Under batch system of production, the work is divided into operations and one operation is done at a time. After completing the work on one operation it is passed on to the second operation and so on till the product is completed. Batch production can be explained with the help of an illustration. An enterprise wants to manufacture 20 electric motors. The work will be divided into different operations. The first operation on all the motors will be completed in the first batch and then it will pass on to the next operation. The second group of operators will complete the second operation before the next and so on. Under job production the same operators will manufacture full machine and not one operation only. Batch production can fetch the benefits of repetitive production to a large extent, if the batch is of a sufficient quantity. Thus batch production may be defined as the manufacture of a product in small or large batches or lots by series of operations, each operation being carried on the whole batch before any subsequent operation is operated. This method is generally adopted in case of biscuit and confectionery and motor manufacturing, medicines, tinned food and hardware’s like nuts and bolts etc. Characteristics of batch production method 1. The work is of repetitive nature. 2. There is a functional layout of various manufacturing processes. 3. One operation is carried out on whole batch and then is passed on to the next operation and so on. 4. Same type of machines is arranged at one place. 5. It is generally chosen where trade is seasonal or there is a need to produce great variety of goods. B. Continuous Production Continuous means something that operates constantly without any irregularities or frequent halts. In the continuous production system, goods are produced constantly as per demand forecast. Goods are produced on a large scale for stocking and selling. They are not produced on customer's orders. Here, the inputs and outputs are standardized along with the production process and sequence. In continuous production system, the most common material handling equipment are belt conveyors, roller conveyors, chutes, rails etc. It is because in continuous production systems one or a few standard products are manufactured with pre-determined sequence of operations with inflexible material handling devices. In intermittent production system portable material handling equipment are used and various products are produced with greater flexibility in the systems. Continuous production system requires a larger investment than intermittent production system because of fixed path material handling equipment, costly control mechanism and special purpose machines for various operations. Even the marketing techniques also differ for continuous production system and intermittent production system. Following are examples on the continuous production system 1. The production system of a food industry is purely based on the demand forecast. Here, a large- scale production of food takes place. It is also a continuous production. 2. Similarly, the production and processing system of a fuel industry is also purely based on, demand forecast. Crude oil and other raw sources are processed continuously on a large scale to yield usable
  • 12.
    form of fueland compensate global energy demand. The features/characteristics of a continuous production system are listed as follows: 1. The flow of production is continuous. It is not intermittent. 2. The products are standardized. 3. The products are produced on predetermined quality standards. 4. The products are produced in anticipation of demand. 5. Standardized routing sheets and schedules are prepared. The types of continuous production system include: 1. Mass/Assembly line production, and 2. Process production B.1 Mass/Assembly line production This method involves a continuous production of standardized products on a large scale. Under this method, production remains continuous in anticipation of future demand. Standardization is the basis of mass production. Standardized products are produced under this method by using standardized materials and equipment. There is a continuous or uninterrupted flow of production obtained by arranging the machines in a proper sequence of operations. Process layout is best suited method for mass production units. Flow production is the manufacture of a product by a series of operations, each article going on to a succeeding operation as soon as possible. The manufacturing process is broken into separate operations. The product completed at one operation is automatically passed on to the next till its completion. There is no time gap between the work done at one process and the starting at the next. The flow of production is continuous and progressive. Characteristics of mass or flow production 1. The units flow from one operation point to another throughout the whole process. 2. There will be one type of machine for each process. 3. The products, tools, materials and methods are standardised. 4. Production is done in anticipation of demand. 5. Production volume is usually high. 6. Machine set ups remain unchanged for a considerable long period. 7. Any fault in flow of production is immediately corrected otherwise it will stop the whole production process. Suitability of flow/mass production 1. There must be continuity in demand for the product. 2. The products, materials and equipment must be standardised because the flow of line is inflexible. 3. The operations should be well defined. 4. It should be possible to maintain certain quality standards. 5. It should be possible to find time taken at each operation so that flow of work is standardised. 6. The process of stages of production should be continuous. Advantages of mass production 1. The product is standardised and any deviation in quality etc. is detected at the spot. 2. There will be accuracy in product design and quality. 3. It will help in reducing direct labour cost.
  • 13.
    4. There willbe no need of work-in-progress because products will automatically pass on from operation to operation. 5. Since flow of work is simplified there will be lesser need for control. 6. A weakness in any operation comes to the notice immediately. 7. There may not be any need of keeping work-in-progress, hence storage cost is reduced. B.2 Process Production A production process, that runs for very long periods without the start-and-stop behaviour associated with intermittent production such as those used by chemical plants or refineries. High capital investments are required for highly automated facilities that use special-purpose equipment designed for high volumes of production and little or no variation in the type of outputs. Characteristics of Process Production 1. Extended form of mass production system 2. More automatic machines 3. One basic raw material is transferred into several products at several stages. 4. Less highly skilled workers required 5. More human problems foreseen 6. Highly standardized system Comparison of the production techniques/processes
  • 14.
    Forecasting a) Forecasting meansestimation of type, quantity and quality of future work e.g. sales etc. b) The survival of a manufacturing enterprise depends on its ability to assess, with reasonable accuracy, the market trends several years ahead. c) Forecasters will be able to make use of sales trends, but these must be considered in the light of expected introduction of new materials, fashion changes, policies of competitors, unseasonable weather, threat of war and the general economic situation expected in the country and foreign markets. These circumstances and others necessitate changes in sales forecast from time to time during the forecast period. d) Forecast represents a commitment on the part of the sales department and each of is divisions of expected sales. It becomes a goal against which the effectiveness of the sales department will be measured. e) Forecasting plays a crucial role in the development of plans for the future. f) Sales budget (estimate) forms the basis for manufacturing budget. It is the sales forecast which enables to determine production quantities, labour, equipment and raw material requirement (Refer to Chapter no. 28) g) A sales forecast should be: a. Accurate b. Simple and easy to understand and c. Economical Purpose of Sales Forecasting Sales forecasting is essential because, (i) It determines the volume of production and the production rate. (ii) It forms basis for production budget, labour budget, material budget, etc. (iii) It suggests the need for plant expansion (iv) It emphasizes the need for product research development (v) It suggests the need for changes in production methods (vi) It helps establishing pricing policies (vii) It helps deciding the extent of advertising, product distribution, etc. Basic Elements of Forecasting • Forecasting means predicting future events by the best possible means • In any sales forecasting analysis, there are four basic elements of economic data that should be used 1. Trends 2. Cycles 3. Seasonal variations 4. Irregular variations • Trends are the long term, long range movements of a series of economic data. They have little relationship to the month-to-month changes that take place, and they manifest their direction slowly. • Cycles are of shorter duration and they are usually featured by alternate periods of expansion and contraction. • Seasonal variations occur within a certain period of year and recur at about the same time and to approximately the same extent from year to year. • Irregular variations are the result of unforeseen or non-recurring events that have an economic
  • 15.
    influence. A strikein a key industry might cause an irregular variation.
  • 16.
    Forecasting Techniques Forecasting isthe formal process of predicting future events that will significantly affect the functioning of the enterprise. Sales forecasting techniques may be categorized as follows: (a) Historic estimate (b) Sales force estimate (c) Trend line (or Time series analysis) technique (d) Market survey (e) Delphi method (f) Judgmental techniques (g) Prior knowledge (h) Forecasting by past average (i) Forecasting from last period’s sales (j) Forecasting by Moving average (k) Forecasting by Weighted Moving average (l) Forecasting by Exponential Smoothing (m) Correlation analysis (n) Linear Regression Analysis The details of the forecasting techniques are given below: (a) Historic estimate • This technique makes use of the assumption that what happened in past will happen in future. For example, L. a concern has sold 5000 blankets in winter last year, it will be able to sell the same quantity in winter this year also. • Historic estimate is useful if the activity is affected by pattern of seasonality. • It is useful for determining model, size and colours distribution. • It is successful only when pattern of events remains unchanged, i.e., if economy is static. This is rarely true except for short period of time. • Historic estimate is not scientifically valid and thus it is not an accurate method, the total sales forecast provided by this method should be modified by other techniques. (b) Sales force estimate • This technique is based upon the principle – that the persons in contact with the market know best about the future market tends. • Individual salesmen make sales estimates of their territories and submit it with the District Sales Manager who analysis it, modified it and sends the same to Factory Sales Manager. Factory Sales Manager in consultation with other related factory executive formulates the final estimate of sales. • This technique is useful when an industry is making a limited number of products (e.g., commercial power generating equipment) and there are a few large customers. (c) Trend line technique • Trent line technique is employed when there is an appreciable amount of historical data. • This technique involves plotting historical data, i.e., a diagram (Fig. 7.3) between activity indicator, e.g. tons of material (say past sales) on Y – axis and time on X – axis. • A single best fitting line (using statistical technique) is drawn and projected to show sales estimate for future.
  • 17.
    • This techniqueis more accurate as it makes use of a large past data and possesses scientific validity. • However, it is time-consuming, involves long mathematical calculations and assumes an infinite population of relatively small customers so that the decision of an individual customer cannot have an appreciable effect on total product demand. (d) Market Survey, i.e. Market Research Technique • This technique finds application when a concern introduces a new product in the market and is interested to estimate its sales forecast. For a new product, naturally, no historic or past data regarding sales will be available. • This technique may be very informal, utilizing the sales force to feel out the potential customers in order to establish the extent of the market or it may be a systematically conducted survey using special mathematical tools. • Generally, the new product is introduced in a relatively small critical trial area, market reaction is noted and the total sale (country wide) is projected from these results. (e) Delphi Method • A panel of experts is interrogated by a sequence of questionnaires in which the response to one questionnaire is used to produce the next questionnaire. Any set of information available to some experts and not others is thus passes on to the others, enabling all the experts to have access to all he information for forecasting. The method solicits and collates from experts to arrive at a reliable consensus. This technique eliminates the bandwagon effect of majority opinion. • Delphi method has fair to very good accuracy for short and long term forecasts. • The method is applicable to forecasts of long-range and new-product sales. (f) Judgmental techniques • Opinions of consumers and customers. Questionnaires related to buying the product may be sent to a selected group of consumers and to the customers who have already purchased the product. The information thus received can be very useful in estimating product performance and its probable demand in future. • Retail and wholesale dealers can provide some insight into the pace of current and future sales. • The opinion of area sales manager can also be quite useful. (g) Prior knowledge • This is used by ancillary units which are more or less a part of the large organisation. The large organisation informs each ancillary unit how many components parts to make. • The forecast estimate is needed only to establish the material and tool requirements, etc. (h) Forecasting by Past average • If our objectives are to forecast or predict the sales of an item for the next sale period, then this method is used. (i) Forecasting from last period’s sales • The method eliminates the influence of past (old) data and bases the forecast only upon the sales of the previous period. (j) Forecasting by Moving Average • This method represents a compromise between the two above explained methods, in that the forecast is neither influenced by very old data nor does it solely reflect the figure of the previous period.
  • 18.
    (k) Weighted MovingAverage Method for Forecasting • Whereas the simple moving average gave equal effects to each components of the moving average database, a weighted moving average allows any weights to be placed on each element, providing, of course, that the sum of all weights equals one. The weighted moving average method has a defined advantage in being able to remove the effects of past data, but it also has the disadvantage of remembering the total history for the time period. (l) Forecasting by Exponential Smoothing The main disadvantages of the moving average method are: • The lengthy calculations involved • The need to keep quantities of historical data. • The fact that the normal (or simple) moving average method places equal weight on each of the historical figures used. • The age of the data, which increase with the number of periods used. All of these disadvantages are overcome by the exponential smoothing technique. Using this technique, it is necessary only to retain the previous forecast figure and to know the latest actual sales figure. The technique works by modifying the old forecast in the light of new sales figure.
  • 19.
    Capacity Planning Capacity isdefined as the ceiling on the maximum load a production unit can handle at a given point of time. In other words, capacity is defined as an upper limit on the rate of output. The capacity question does not arise alone. It comes in conjunction with: 1. New facility planning 2. Leasing or buying the equipment required to maintain the output. 3. Expansion of the existing facilities 4. While introducing new product or services 5. While finalizing the fund and energy requirements The above mentioned situations, if come across alone, are easy to tackle. It becomes complicated when more than one situation is encountered at the same time. A facility’s Capacity is the rate of productive capability of a facility. Capacity is usually expressed as maximum productive volume of output per time period. Operations managers are concerned with capacity for capability, usually several reasons. First, they want sufficient capacity to meet customer demand in a expressed as volume of output per period of timely manner. Second, capacity affects the cost efficiency of operations, the case or time. Difficulty of scheduling output, and the costs of maintaining the facility. Finally, capacity requires an investment. Since managers seek a good return on investment, both the costs and revenues of a capacity planning decision must be carefully evaluated. Definition of Production Capacity Facility planning includes, determination of how much long-range production capacity is needed, when additional capacity is needed, where production facilities should be located and the layout and characteristics of the facilities. Capacity in general is the maximum production rate of a facility or a firm. It is usually expressed as volume of output per period of time. Capacity indicates the ability of a firm to meant market demand. Operations managers are concerned with capacity because. (a) They want sufficient capacity to meet customer demand in time (b) Capacity affects cost efficiency of operations, the case or difficulty of scheduling output and the costs of maintaining the facility. (c) Capacity requires an investment of capital. Capacity planning Capacity planning design is the first level planning for the inputs, conversion activities and outputs of a production operation. Design decisions are very important because they’re often associated with significant investment of funds. The initial outlay and operating expenses are established based on design decisions, and these in turn affect productivity of the concern in future. So they affect fixed cost and variable cost. Design Capacity: preliminary estimate of capacity is done based on long-range forecast extending 5 to 10 years into the future. The design capacity of a system is the rate of output of goods or services under full scale operating conditions. For example, a cement factory may be designed to produce 200 tons per day. The projected demand for period anywhere from 5 to 10 years is taken as the estimate for the design capacity, since frequent expansion will lead to productivity loss. System Capacity: In practice, it may not be possible to achieve production to the extent of design capacity mainly because of mismatch between required resources and available resources. The
  • 20.
    maximum output ofa specific product or product mix that the system of workers and equipment is capable of producing as an integrated whole is called system capacity. This may be less than that of the design capacity. The actual output may be even less than the system capacity since it is affected by short-range factors such as actual demand, equipment breakdowns, and personal absenteeism or productivity. Need for Capacity Planning Capacity planning is necessary when an organization decides to increase its production or introduce new products into the market. Once capacity is evaluated and a need for new or expanded facilities is determined, decisions regarding the facility location and process technology selection are taken. Capacity planning is the first step when an organization decides to produce more or a new product. Once capacity is evaluated and a need for new or expanded facilities is determined, facility location and process technology activities occur. Too much capacity would require exploring ways to reduce capacity, such as temporarily closing, selling, or consolidating facilities. Consolidation might involve relocation, a combining of technologies, or a rearrangement of equipment and process.
  • 21.
    Importance of CapacityPlanning The importance of capacity planning lies in the fact that it is more fundamental. Every organization looks at the future with its’ own focus and develop and adjusts ‘its’ strategies to reach the goal. Capacity planning relates to the organization potential impact on the ability of the organization to meet the future demands for it’s product / service. This is because of the fact that the possible rate of output is limited by the capacity. a. There is also link between the capacity and the operating cost. Every managers wants to minimize the operating cost of the final product. Also they are interested in utilizing the established capacity to the fullest possible extent. This trade – off puts the whole process, into a vicious circle. b. Minimizing the operating cost is not possible always, as the demand is a variable factor. The demand variation is due to: • Increased competition (through the entry of new players; (or) due to the change in the strategies of the existing players). • Technological changes (through some inventions (or) entry of MNC’s through joint ventures) • User’s perception (which changes from time to time) • Nature of the product (accordingly the demand will be seasonal or cyclical) Possible demand patterns are: • Growth • Decline • Cyclical • Stable a. The Initial Investment involved. This is due to the fact that, the capacity is a major determinant of the cost of a product, which will decide about the organization’s position in the market. b. Long term commitment of resources. Once a capacity is created, it is very difficult – not impossible – to modify. In future, if modification is needed, it calls for heavy investment.
  • 22.
    Capacity Planning Decisions Capacityplanning involves activities such as: (a) Assessing existing capacity (b) Forecasting future capacity needs (c) Identifying alternative ways to modify capacity (d) Evaluating financial, economic and technological capacity alternatives (e) Selecting a capacity alternative most suited to achieve the strategic mission of the firm. Capacity planning involves capacity decisions that must merge consumer demands with human, material and financial resources of the organization. Often decisions about capacity are inseparable from decisions about locations: Capacity depends upon demand and demand often depends on location. Commercial banks, for example, simultaneously expand capacity and demand by building branch banks. Decisions about the size and location of the branch are made according to projections about neighbourhood population densities and growth, geographic locations of market segments, transportation (traffic) flows, and the locations of competitors. Adding a new branch offers greater convenience to some existing customers and, management hopes, attracts new customers as well. Obviously this decision affects the revenues, operating costs and capital costs of the organisation. In the public sector, the capacity decision involves similar considerations. Municipalities face ever- increasing demands for public services, strong public sentiment for tightening budgets, and greater performance accountability. Consequently, officials have increased their efforts to rearrange public resources so that service capacity is increased but the cost of operating is not. Municipal emergency services, for example, are periodically expanded by adding to show population growth and shifts. Next, municipal officials plan where to locate new stations, taking into consideration both areas of greatest need and costs of operation and facilities. Although the capacity may not involve direct revenues, cost savings for citizens can be considered a form of indirect revenues. These cost savings can result in reduced tax burdens of lower insurance rates in areas with improved emergency services. Modelling techniques, are playing a central role in these planning processes. One study, for example, explain how mathematical programming is used for greater ambulance effectiveness considering time- to-scene, time-to-hospital, a distance-to-hospital factors, thereby increasing effective service system capacity. Another study shows how mathematical modelling can determine optimal fleet sizes and vehicle routes for a commercial common carrier. Yet another study demonstrates the value of queuing models in a computer-based information system for the St. Louis County Police Department. The system gives a way to allocate police patrols, thereby using existing capacity more efficiently or reducing the size of operations without diminishing existing service levels. All these examples show how systematic analysis and planning can lead to effective use and improvement of capacity.
  • 23.
    Capacity Planning Strategies Capacityis a measure of the ability to produce goods or services or, it may be called as the rate of output. Capacity planning is the task of determining the long – and short – term capacity needs of an organization and then determining how these needs will be satisfied. Long-term capacity strategies: Top management may have the following strategies to cope up with major changes in products and services that it can provide to customers in the long run which will have significant impact on the capacity. The major changes will altogether revise the demand and resource requirements. There are: • develop new product lines • expand existing facilities • construct or phase out production plants Technological obsolescence may force some industries to use phase-in strategy for introducing the next model of the same product or service to retain and/or improve its market segment. The phase – in strategy is nothing but het planning for the next model even when the present model is moving well. Especially, in electronics industry, any company should do continuous research and development to improve the operational features of the product through advanced technology so that the company will be in a position to bring out products into the market with the latest technology without any time lag. At the same time, all the products will not have continued demand for ever. Moreover, continuing the production of some products will be uneconomical over a period of time. This will force a company to diversify and/or phase out some of the existing products. Phasing out of a product should be done over a period of time properly by taking the re-employment features into account. Short – term capacity strategies: In short-term planning, horizon, capacity decisions are taken by considering the fluctuations in demand caused by seasonal and economic factors. The purpose of short-term capacity planning is to respond to variations in demand during the short-term planning horizon. Strategies like, overtime, subcontracting, hiring firing, etc. can be used to cope up with the fluctuations in demand.
  • 24.
    Factors Affecting CapacityPlanning The capacity variables are: (a) Controllable Factor’s such as amount of labour employed, facilities installed, machines, tooting, shifts worked per day, days worked per week, overtime work, sub-contracting, alternative routing of work, preventive maintenance and number of production set-ups. (b) Less Controllable Factors are absenteeism, labour-performance, machine break-down, material shortage, scrap and rework and unexpected problems such as strike, lockout, fire accidents etc. Types of Capacity 1. Fixed Capacity: The capital asset (buildings and equipment) the company will have at a particular time is known as the fixed capacity. They cannot be easily changed within the intermediate time range. Capacity represents an upper limit to the internal capacity, that the company concentrates can use in its efforts to meet demand 2. Adjustable Capacity: It is on and the size of the workforce, the number of hours per week they work, the number of shifts and the extent of sub-contracting. 3. Design Capacity: it is the planned rate of output of goods or services under normal full-scale operating conditions. It is also known as installed capacity. It sets the maximum limit to capacity and serves to judge the actual utilization of capacity. 4. System Capacity: It is the maximum output of a specific product or product-mix that the system of workers and machines i.e., the productive system is capable of producing as an integral whole. It is less than or equal to the design capacity of the individual components because the system may be limited by: (a) The product mix (b) Quality specifications and (c) The current balance of equipment and labour 5. Potential Capacity: It is that, which can be made available within the decision horizon of the top management. 6. Immediate Capacity: It is that, which can be made available within the current budgeted period. 7. Effective Capacity: is the capacity, which is used within the current budget period. It is also known as practical capacity or operating capacity. No plant can work up to the maximum or the theoretical capacity (installed or design capacity) because of the loss of capacity due to scheduling delays, machine break-down and preventive maintenance. This result in the plant working at an efficiency of loss than 100%. Also, the actual output will be less than the designed output due to rejections and scrap. 8. Normal Capacity or Rated Capacity: This is the estimated quantity of output or production, that should be usually achieved as per the estimation done by the Industrial Engineering department. Actual capacity is usually expressed as a percentage of rated capacity. For example, the rated capacity of a steel plant may be expressed as 1 lakh ton of steel per month. This is also sometimes called as average capacity of the plant. 9. Actual or Utilized Capacity: This is the actual output achieved during a particular time period. The actual output may be less than the rated output because of short-range factors such as actual demand, employed absenteeism, labour inefficiency and low productivity levels. Long-range effect: Product-mix, long range market conditions, tight quality specifications, inherent imbalance between equipment and labour.
  • 25.
    Short-range effect: Actualdemand, management performance vis scheduling, staffing, strategy and control, labour inefficiencies, wear scrap loss machine breakdown etc. Capacity Decisions Major considerations in capacity decisions are: (a) What size of plant? How much capacity to install? (b) When capacity is needed? When to phase-in capacity or phase-out capacity? (c) At what cost? How to budget for the cost? Factors Affecting Determination of Plant Capacity • Market demand for a product service • The amount of capital that can be invested • Degree of automation desired • Level of integration (i.e. vertical integration) • Type of technology selected • Dynamic nature of all factors affecting determination of plant capacity, viz., changes in the product design, process technology, market conditions and product life cycle, etc. • Difficulty in forecasting future demand and future technology • Obsolescence of product and technology over a period of time • Present demand and future demand both over short-range, intermediate-range and long-range time horizons. • Flexibility for capacity additions.
  • 26.
    Classification of CapacityPlanning • Long-term capacity planning • Short-term capacity planning • Finite capacity planning • Infinite capacity planning Long-term or long-range capacity planning is concerned with accommodating major changes that affect the overall level of output in the longer run. Major changes could be decisions to develop new product lines expand existing facilities and construct or phase out production plants. Short-term or short-range capacity planning is concerned with responding to relatively intermediate variations in demand. In the short-term planning horizon, capacity concerns involve the fluctuations in demand caused by seasonal or economic factors. Ways of adjusting the capacity to the varying demands in the short-term time horizon are: (i) Use of overtime or idle time (ii) Increasing the number of shifts per day to meet a temporary strong demand. (iii) Sub-contracting to other firms. Service industries use flexible work hours, part-time employees and overtime work scheduling to meet peaks in demands. In operations planning, two conflicting constraints are time and capacity. If time is fixed by the customer’s required delivery date or processing cycle. It is possible to accept time as the primary constraint and plan backwards to accommodate these times. In such cases, planning backwards to infinite capacity offers a potential solution to the problem. On the other hand, if the processing time is not a constraint in cases where products are produced to stock and sell, it is simpler to use a forward plan based on finite capacity i.e., based on available resources.
  • 27.
    Constraints On CapacityPlanning Immediate capacity is limited by: • The plant/equipment size; • Availability of equipment; • Availability of manpower; • Availability of cash; • Financial policies; • Purchasing policy; • Sub-contracting policy; • The technical demands of the tasks; • The number of different tasks being undertaken. • Technical abilities in the pre-operations stages; • Organizational skills in the planning stages; • Purchasing skills; • Sub-contracting skills; • Maintenance policies and abilities; • Versatility of workforce; • Efficiency of workforce. Capacity Planning in Service Organisation Service organizations, for the capacity measurement, can be divided into the companies offering: • Homogenous Services • Heterogeneous Services In the case of Insurance companies, the service offered is homogenous i.e. it is based on the number of policies serviced per year. Banks and Transport companies offer heterogeneous services. Their offer is restricted by the availability of limited resources under their possession. For example, in banks, it is measured by the man hours available per week; and in case of transport companies, it is tonnage per kilo-meter. Difficulty in Capacity Planning in Service Organizations • The nature of service itself, i.e. the output cannot be stored. • Average demand for the service will be far less than the peak demand. This will lead to lower capacity utilization during the off-peak demands. This results in low productivity. (Example: Electricity Production and Consumption) • Demand fluctuation during the course of time. (Example: Placement of funds by the Financial Institutions) Capacity Planning Process in Service Organizations i) Predict future demands ii) Determine the available capacity iii) Translate prediction into physical capacity requirement. iv) Develop alternate capacity plans for matching required and available capacities. v) Analyse the economic effects of alternate capacity plans. vi) Analyse the risk and other Strategic consequences of alternate plans vii) Recommend a course of action viii) Implementation of the selected course of action.
  • 29.
    Plant Location An importantdecision which has a bearing on efficiency of production management relates to the suitable location of plant. The chief object of an industrial concern is to maximize profit through the minimization of cost of production. this is possible when the firm is of the right (i.e. optimum) size and is located at a place which provides economies of all kinds in production. In other words, optimum size has to be combined with optimum location if profit is to be maximized. It must be clearly understood at this stage that optimum location does not necessarily imply the most favourable location where labour costs are lowest, transportation cost is minimum, and the water is the best, “but rather where the entire group of considerations is the optimum size. Just as the optimum size is determined through a reconciliation of the various relevant forces, the optimum location is also the outcome of proper reconciliation of various considerations relevant to the question. It is responsibility of the promoter or entrepreneur to search for a location which yields maximum advantage to the business enterprise in terms of raw materials, labour, market, transportation and communication, power and fuel, storage, climate, security, and the like. It is important for the entrepreneur to choose a location which meets not only the present requirements of an enterprise, but also the changes likely to occur in the foreseeable future. Consideration of this factor is important for an enterprise which proposes to undertake expansion and growth programmes without the botheration of searching for alternative locations. The problem of location has several technical, economic, managerial, social and strategic implications. These various aspects vary in their importance and direction at various places. So that all the relevant consideration is fully take into account, it is imperative for the promoter or entrepreneur to be extra careful in choosing a location. In medium and large-sized enterprises, the location study is usually conducted by a special committee consisting of members having a thorough understanding of the technical, managerial, social, and political aspects of location. When the location problem is very complex, it is expedient to use an outside consulting firm that specializes in location studies. Importance of Plant Location 1. Influence on the Cost of Production and Effectiveness of Marketing: The location chosen for a business enterprise has a direct influence on the cost of production as well as on the effectiveness of marketing. It is one location that the ability of a business at a minimum cost, to maintain a sufficient labour force, and to serve satisfactorily its customers. 2. Effect on the Life of the Business: The factor of location assumes greater importance because once a plant location is chosen, the enterprise is compelled to remain in that location for many years. Any decision to change the location later on may mean a substantial loss in the value of the assets and additional cost in resetting the business. Thus, errors in decision-making in the realm of plant location often lead to long-term problem which are very difficult to overcome. Objectives Achieved Through Location 1. Holding Capital Investment and Operating Costs to Minimum: The foremost objective in selecting an ideal location should be to ensure a minimum amount of investment in capital assets and also lowest possible operating costs. 2. Ensuring Smooth Operation of the Business: Another objective that an entrepreneur can hope to achieve through ideal location is the smooth running of the business enterprise. For smooth operation, a business enterprise needs the efficient services of transportation, communication, banking, repairs
  • 30.
    and maintenance andregular supply of raw materials, labour, power and fuel, and the like. An ideal location by making these services and facilities available with regularity and in sufficient quantities helps a business enterprise in conducting its operations smoothly and economically. 3. Promoting Employee Welfare and Public Needs: an ideal location, by making available various facilities and resources, helps achieving employees’ welfare and public needs. For instance, if the enterprise is located where educational, recreational, medical, religious and security needs of employees are met, they will certainly feel attached to the enterprise and would develop their loyalty and commitment for it. 4. Coordinating with Government Policies: Another objective that may guide an entrepreneur’s decision to select a particular location may be that of coordination with government policies. The government’s policy on location veers around one important consideration, that is, a balanced regional development. This policy is sought to be accomplished through various positive and negative measures. While selecting a location for enterprise, the entrepreneur must ensure that his decision does not conflict with the government’s policy. Factors of Location Decision regarding location requires a careful balancing of several factors. Some of these are more important than the rest and are usually called, ‘primary factors’, while the less important ones are referred to as ‘secondary factors’. It is, however, possible that the secondary factors may exert a greater degree of influence on the location of an industry than any of the primary factors. The distinction is, therefore, not clear-cut. Further, considerations of broader national interest must also be given due regard. The various factors which usually determine the location of industries may be described as under: (A) Primary Factors 1. Raw Material From the point of view of minimization of transport costs, the nature of raw material is of great importance. Certain raw materials are of weight-losing character, say sugarcane. Such materials lose much of their weight while passing through the process of production. As a result, the finished product is lighter than the raw materials used in its manufacture. It is well known that ten tons of sugarcane are needed to manufacture one tone of sugar. Therefore, a good deal of economy in transport costs can be achieved if industries which use weight-losing materials are located near the source materials. In such cases, the weight of finished product includes a very small part of the weight of the raw material used and therefore, transport will be needed only for the greatly reduce volume of the finished product. There are some raw materials which are common and are found everywhere. Such materials, are called ‘ubiquities’ and do not affect the location of industries. Examples of such materials are clay, sand and water. Apart from these considerations, the promoter of an industrial venture must view the supply of raw materials from other different angles also viz., • Whether the raw materials are home produced or imported – in the latter case the unit must be established near ports. • If there is financial linkage with raw material suppliers so that the raw materials may be available below market prices at some specific points. • Reliability and continuity of the source of supply, and • The security of means of transport.
  • 31.
    Further, as betweentwo equally suitable locations, the promoter is well advised to consider a location which has auxiliary raw materials also or has market for the by – products of the industry. 2. Market The industries which use ‘pure’ raw materials, i.e. materials which do not lose much of their weight while being converted into finished goods, are generally located near the markets. Cotton is a good example. Upto ginning, cotton is a weight-losing material, therefore, ginning factories are generally found near cotton markets. After ginning cotton becomes non-weight-losing, because out of a hundred pounds of cotton about 95 pounds of cloth can be obtained. This is the chief reason why the cotton textile industry is located near markets. The advantage of proximity to market is not only in the transport cost but also in the personal touch between the producers and consumers. In addition, the increased demand for rapid and regular delivery of small consignments and the practice of offering after-sale services made it imperative for the producers to be near the consumers or at least to open branches in those centres”. Thus, the choice between the point where materials are produced and the point where finished goods are sold is generally made on the basis of the weight-loosing character of the materials. 3. Fuel and Power The problem of fuel and power can also be solved with reference to the nature of raw materials. The industries which use very large quantities of coal are generally located near the coal mines. The chief reason why steel mills are generally found near coal mines rather than iron-ore mines is that the coal loses its weight completely. The development of electric and diesel power has reduced the importance of coal. 4. Transport The facilities for transport available in a particular region and the policy of freight rates are also of great importance. For instance, previously the Indian railways had preferential freight rates for raw materials moving towards the ports and for finished goods moving from the ports to inland centres. This encouraged starting of industries in port tows like Bombay or Calcutta. Availability of cheap transport (water transport) is, however, one of the chief reasons why the jute industry is localized on the two banks of the Hooghly. 5. Labour Another important factor influencing the location of industries is labour industry can be started only at a place where the right type of labour is abundantly available at reasonable wages. For example, tea industry depends not only on the right soil and climate, but also because abundant cheap labour was available. The wage levels in an area, the influence of trade unions and the character of labour unions are some aspects of labour force which influence the decision of the entrepreneur to locate the plant in a particular region or even at a particular place. (B) Secondary Factors 1. Momentum of an Early Start Another factor of some importance has been the momentum of an early start. There are a number of places where, to begin with, only one or two factories are started. With the passage of time these places gained importance and attracted industries. As a place gains in industries, certain facilities usually begin to develop. For example: • Transport facilities are developed because railways and other agencies find it economical to serve the centre.
  • 32.
    • Facilities forrepairs and maintenance begin to be provided by specialist firms. • Banking facilities become available. • Labour possessing various skills is attracted towards it. These are important facilities and will automatically attract more industries. 2. Industrial Atmosphere The industrial atmosphere of a place cannot be measured in tangible terms, but it has a very important advantage. Industrial atmosphere may be said to exist where people living at a place think instinctively of industry and learn the intricacies of machines without much effort. This helps the growth of even new industries. 3. Special Advantage of a Place The special advantages offered by a place also have some importance. For example, previously some of the princely States charged little or no income-tax and also offered some advantages in the matter of labour. 4. Soil and Climate The question of soil and climate is important particularly for agricultural products like tea, coffee and rubber, but due to scientific inventions and developments it is becoming less important for most of the manufactured goods. Previously the cotton textile industry had to be started in a place where the climate was damp but with artificial humidification, cotton textile mills can be started also in completely dry places provided other factors justify the starting of the industry there. 5. Personal Factors The initial location of an industry may, in may cases, be promoted more by the personal likes and dislikes than purely economic considerations. It must, however be recognized that such locations cannot endure unless they prove to be economical enough in the long run. 6. Historical Factors Factors like personal fancies of entrepreneurs or historical accidents may lead to the development of a place as the centre of an industry. Dr. Om Prakash cites the instance of Kanpur which has developed as the ‘premier textile centre of northern India’ but has hardly any advantage. It grew as such largely because some pioneers especially Europeans chose Kanpur as the centre of their cotton activity. 7. Political Stability The lack of political stability in a State makes for uncertainty in the attitude of State Governments to industry. In locating plant, it must be seen as to whether the State has a record of political and economic stability. It is common knowledge that many industrialists have moved out and many more are planning to move out of West Bengal because of adverse political and law and order situation there. 8. Special Concession and Benefits Each State Government has been trying to promote industrial development in relatively backward regions by offering various concessions and incentives in the form of financial assistance, cheap land, tax-subsidy etc. to new enterprises. In many cases the location of the plat may be influenced by this factor. (C) National and Strategic Considerations Balanced Regional Development of Industry The consideration given above are mostly economic in character. These considerations, however, ignore the broader national interest and, as pointed out earlier, lead to concentration of industries in a
  • 33.
    few places. Thisis clearly undesirable from the point of view of national defence. From the point of view of equity, too, it is unfair, because it means that people living in a few places will enjoy the benefits of industry in the form of employment. It is necessary that the distribution of industries over the various region of the country should be equitable.
  • 34.
    Plant Layout Plant layoutdeals with the arrangement of physical facilities and manpower required to manufacture a product. Plant layout, in a more specific sense, covers the planning of space requirements for all activities in an industrial enterprise – offices, rest rooms, warehouses and all other facilities associated with the total manufacturing plant – with a view to enabling the plant to function most effectively. The over-all objective is to plan the arrangement of facilities and personnel so that the manufacturing process is carried out in an effective manner. This objective involves a minimum of movement on the part of both materials and men in the organisation. Plant layout is very complex in nature as it involves concepts relating to such fields as engineering, architecture, economics and business administration. Since a plant layout, when properly designed, encompasses all production and service facilities and provides for the most effective utilization of men, materials, and machines constituting the process, it is a master blueprint for coordinating all operations.
  • 35.
    Objectives of PlantLayout • Plant layout facilitate the manufacturing process by maintaining balance in the process. • Efficient and economic material handling • Smooth flow of factory operations • Promote effective utilization of manpower and other physical facilities • Minimize interference from machines • Reduce hazards affecting employees • Increase employee morale • Hold down investment in equipment and other services; and • Built-in-provision for future expansion.
  • 36.
    Factors Affecting PlantLayout 1. Nature of Product In this category, two factors are quite important – products to be manufactured and volume of production. The type of product affects plant layout in many ways. Small and light products can be easily removed from one machine to another and from one man to another, and therefore, for such products more attention can be given to machine locations and the handling of materials. Similarly, the volume or rate of production has a significant bearing on the plant layout. In plant layout it is reflected in the total size of the operation to be planned as well as being the principal factor in the type of manufacture to be employed. 2. Nature of Process Factors relating to the process may be, type of process, sequence of operations, number of machines and equipment, and space requirements of machines and equipment. Variations among the kinds of processes to be carried on in different industries necessitate considerable difference in plant layout for the respective types of manufacturing. 3. Materials Materials – storage and materials-handling are probably then most important factors to be considered in planning a layout. For materials storage, factors such as rate of use of the material; space, volume and weight of materials; flour loan capacity, ceiling height; method of storing should be given special consideration. This will affect the space as well as the efficiency of the production process in the plant. 4. Personnel While laying out a plant, safety and comfort of the personnel must be given a special consideration. Layout should provide for the provision of rest rooms, drinking water, an d other services, as is also provided in the Factories Act, 1948, people working on machines should be provided with safety devices. A proper layout should take these factors into consideration. 5. Layout The type of layout – process layout, product layout and layout by fixed position – will affect the plant layout. 6. Miscellaneous Factors Plant layout is also affected by factors such as plant site, building, flexibility, working conditions, supervisory requirement and the like. The plant site is the connecting link between the factory and the surrounding community. The building itself, either existing or as proposed, will often have a bearing on the layout. Working conditions such as illumination, ventilation, heating, noise and vibration, temperature, employee facility etc. affect the layout. Each and every one of the above factors presents a problem to the plant layout engineer. One must realize that a solution that is completely favourable in all ways is seldom reached. In fact, some of them are rather in opposition to each other. Nevertheless, each represents an important problem which the plant layout engineer has to consider. As in most design solutions, a compromise must be made to attain an optimum solution.
  • 37.
    Types of PlantLayout There are three basic types of plant layout – product, process and fixed position layout. It is rare to find that only one type is present in a single factory, usually they exist side by side. Selection of the basic plan to be used depends upon many factors; however, of these, the type of product and type of manufacture are of significant importance.
  • 38.
    Process or FunctionalLayout In the process layout, all facilities for performing the same or similar functions are grouped together, i.e. lathes, milling machines, drill presses etc. are found in separate areas. a part being worked on them travels from one area to another according to the established sequence of operations through which it must be put, and where the proper machines are located for each operation.
  • 39.
    Characteristics of ProcessLayout Layout by process is associated with jobbing in small batch production and has the following characteristics: • Allows specialized supervision; • Facilitates provision of services; • Failure of machines or absence of workers does not disrupt production excessively; • Good machine utilization; • Operations may be missed and ‘bad’ jobs delayed because of the necessary flexibility of control, • High work-in-progress.
  • 40.
    Advantages of ProcessLayout 1. Flexibility: Process layouts are noted for flexibility which is possible in terms of products which can be manufactured and the jobs that can be done. 2. Financial Investment: Process layout puts much less strain on the scarce financial resources of the organisation. Under it, general-purpose machines with usually less cost are used. It require typically lower set-up and maintenance costs. this layout requires less duplication of machines and supporting equipment. Besides, general-purpose machines do not depreciate or become obsolete as rapidly as specialized machines used in product layout. All these result in usually a lower financial investment in machines and other equipments. 3. Working Conditions: Process layout facilitates installation of machines in separate areas without any dependence on other sequences. Process layout makes it easy to isolate machines which produce excessive noise, vibration, fume or heat thereby resulting in heavy working conditions in the work place. The effect of such working conditions is reflected in terms of enhanced employee morale. 4. Output Rate: Process layouts are less vulnerable to break-downs. Machine breakdowns in a process layout situation only tie up production on broken machines. This reduces the productive capacity of succeeding operations in the ratio of one to the total number of machines on the labour operation on which a single machine breaks down. Besides, it is easier to handle breakdown of equipment by transferring work to other equipment or work station. 5. Supervision: under process layout better and efficient supervision is possible through specialization.
  • 41.
    Disadvantages of ProcessLayout 1. Inefficient Materials-handling: Efficient materials – handling is difficult to practice in process layouts. Back-tracking and side-tracking materials become common and are costly and it eliminates the savings which result form the use of conveyors, chutes and other fixed-path equipment. 2. Unbalanced Line of Production: Process layout do not lend themselves to the maintenance of balance line of production and they make it difficult to carry out ‘routing’ and ‘scheduling’ function for they require special routing for different jobs. Therefore, execution of orders is usually delayed and production rate is hampered. 3. High Inventory Investment: Compared to product layout, inventory investments are usually larger in case of process layout. This ties up more working capital in ‘work-in-progress’ inventory. 4. High Cost of Supervision: Under process layout, the number of employees for supervision per supervisor is less and results in reduced supervisory span of control and increased cost of supervision. 5. Less Mechanization: Less mechanization of handling is the characteristic of process-laid-out plants, so handling efficiency is less and cost is high. Because of this, the chances of accidents and fatigue hazards are greater resulting in high insurance rates and lows employee morale.
  • 42.
    Suitability of ProcessLayout Process layout is suitable where (1) Non-repetitive items are manufactured. In other words, emphasis is on special orders. (2) It is difficult to achieve good labour and equipment balance. (3) Production is not carried on large scale. (4) It is difficult to undertake adequate time and motion studies. (5) It is frequently necessary to use the same machine or work station for two or more operations. (6) During the sequence of operation many inspections are required.
  • 43.
    Product Layout Product layout(or flow, sequential, or line layout) is another basic type of plant layout. In it, all the machines of each kind needed for balanced operations on a given production or assembly line are located adjacent to it in labour operation sequence. In product layout, all plant facilities – machines, men and materials – are arranged according to the sequence of operations required to produce a specific product. A continuous production system usually utilizes a product layout.
  • 44.
    Characteristics of ProductLayout Layout by product is associated with mass and large batch production and has the following characteristics: • Little material-handling necessary; • Good machine utilization; • Low work-in-progress; • Production control facilitated • Minimum floor space required; • Machine breakdown disrupts production; • Effective use of labour, i.e. minimum training, job specialization, etc. Evaluation of Product Layout The evaluation of product layout is simple to make because the advantages of product layout are essentially the same as the disadvantages of the process layout and vice versa.
  • 45.
    Advantages of ProductLayout 1. Lower total materials – handling cost. 2. Less total production time. 3. Less work-in-process 4. Greater simplicity of production control, fewer controls and records needed, and lower accounting cost, and 5. Less supervision
  • 46.
    Disadvantages of ProductLayout (1) Decreased flexibility (2) Increased investment in equipment and machines (3) Frequently greater difficulty in expanding production beyond the capacities of the lines in layout by product, and (4) Greater difficulty in securing specialization in supervision.
  • 47.
    Stability of ProductLayout The product layout is suitable: 1. Where one or a few standardized products are manufactured. 2. Where large volume of production of each item has to travel the production process over a considerable period of time. 3. Where time and motion studies can be made to determine the rate of work 4. Where a possibility of good labour and equipment balance exists. 5. Where minimum of inspection during sequence of operation is required. 6. Where materials and products permit bulk or continuous handling by mechanical means. 7. Where minimum of set-ups are required.
  • 48.
    Layout by FixedPosition Besides process and product layouts, a less common but basic type of layout exists and is known as a fixed-position layout. In a fixed-position layout, the material or principal component is fixed or must remain in fixed position and facilities move to and from the product. Examples of this type of layout can be found in the building of aircraft, ship-building, ship-yards, and civil engineering works like bridge construction cases etc. A fixed – position layout has several advantages and disadvantages. For example, this type of layout can accommodate variety in product, changes in design etc. Also breakdowns on one part of the project do not necessarily stop the entire production operation. The main disadvantage of this layout is, poor facility utilization, particularly on remote work, such as civil engineering.
  • 49.
    Criteria for AGood Layout The process of plant layout is a creative one in so far as it helps minimize movement of machines and personnel, facilitate the manufacturing process, and reduce the cost of production. while the techniques employed in making a layout are normal work-study techniques; however, it cannot be set down with any finality, and, as a matter of fact, in this, experience plays an important role. Furthermore, it is not possible to define a good layout with any precision. However, there are certain criteria which should be satisfied by a good layout, which are: 1. Maximum Flexibility: A good layout will be one which can be rapidly modified to meet changing circumstances. 2. Maximum Coordination: Layout requires to be considered as a whole and not in parts. It should be a master blueprint for coordinating all operations. It should clearly state the interrelationships between different machines, departments, and personnel and should provide for coordinated efforts. For example, entry into, and disposal from any department should be in such a manner that it is more convenient to the issuing or receiving departments. 3. Maximum use of Volume: Maximum use should be made of the volume available: conveyors can be run above head height and equipment can be suspended from the ceiling. This principle is particularly true in stores, where goods can be stacked at considerable heights without inconvenience, especially if lift-trucks are used. 4. Maximum Visibility: All men and materials should be readily observable at all times, there should be not ‘hiding places’ into which goods can be mislaid. This criterion is sometimes difficult to fulfil particularly when an existing plant is taken over. It is also a principle that may be resisted if such, ‘places’ add to the face lifting of the plant. 5. Maximum Accessibility: All servicing and maintenance points should be readily accessible. For instance, a piece of plant placed in front of a fuse box will impede the work of the electricians and may cause an unnecessary stoppage of the machine when the fuse box is opened. 6. Minimum Distance: All movements should be both necessary and direct. Handling materials adds to the cost of the product but does not increase its value, consequently any unnecessary or circuitous movements should be avoided. 7. Minimum Discomfort: Poor lighting, excessive sunlight, heat, noise, vibrations, and smells should be minimized and if possible counteracted. 8. Minimum Handling: The best handling is ‘no handling’, but where handling is unavoidable it should be reduced to a minimum by the use of conveyors, lifts, chutes, hoists and trucks. Materials being worked on should be kept at working height, and never placed on the floor if it is to be lifted later. 9. Inherent Safety, Maximum Security, Visible Routes: All layouts should be inherently safe, and no person should be exposed to danger. Care must be taken not only of the persons operating the equipment but also of the passers-by, who may be required to go behind a machine, the back of which is unguarded. Similarly, safeguards against fire, moisture, theft, and general deterioration should be provided, as far as possible, in the original layout. Definite liens of travel should be provided and, if possible, clearly marked, no gangways should ever be used for storage purposes, even temporarily. Procedure for Designing a Plant Layout The steps which are logically necessary in order to prepare a satisfactory plant layout are: 1. Obtain basic production data, starting with a list of operations to make a product, the machines to
  • 50.
    be used orprocesses to be employed, and the sequence or route to be followed. 2. Prepare an assembly chart, obtaining and analysing and coordinating the basic production data, so that a flow process chart can be derived showing the path taken by materials and labour/machine requirements. 3. Calculate equipment requirements needed to produce the particular production rate, making allowance for machine capacity, machine utilization etc. 4. Materials-handling plan containing decisions on whether the movement of materials between machines, work stations, or process plant is to be by means of conveyors, cranes, hoists etc. materials-handling is a very significant cost factor in production and this aspect of production should receive very serious considerations at this stage. 5. Space allocation study: Since site considerations chiefly relate to the case of transfer of materials between the various operations, factors related to materials-handling dominate at this stage. 6. Prepare first draft layout plan. This will involve using the site plan and incorporating on it the various machines and materials-handling equipment needed as a result of the initial assembly chart and flow process chart. 7. Prepare first draft flow diagram. This will show whether the flow diagram is good and free from complex movements. 8. Revise layout and prepare revised flow diagram as necessary until the best arrangement is obtained. 9. Plan individual machines, work stations, or plant in relation to access for work in process, for repair and maintenance of plant and for services such as electricity, gas, high-pressure air, etc. it is also necessary to ensure that there is adequate illumination. 10. Plan materials-handling equipment in detail, as related to the individual machines, work stations, or process plant. 11. Plan and locate all service supplies to each part of the layout. 12. Prepare master plan
  • 51.
    Production Planning andControl (PPC) The main functions of PPC are the coordination of all the activities, which exist during production or manufacturing. Materials: This function is concerned with ensuring that the Raw material, standard finished parts, finished parts of products must be available while starting the operation within the time. Methods: This function is concerned with the analysis of all methods of manufacturing and selecting the best appropriate method according to the given set of circumstances and facilities. Machines and Equipment: It is important that methods of manufacturing should to be related to the available production facilities coupled with a detail study of equipment replacement policy. This function is concerned with the detailed analysis of the production facilities, maintenance procedures and equipment policy. Routing: It refers to the flow of sequence of operation and processes to be followed in producing a particular finish product. It determines manufacturing operation and their sequence. Estimating: This function is concerned with estimation of operations time. The operation time can be worked Out once the overall method and sequence of operation is fixed and process sheet for each operation is available. Loading & Scheduling: It is important that machine should be loaded according to their capabilities performance the given and according to the capacity. It is concerned with preparation of machine loads and fixation of starting and completion dates for a particular operation. Dispatching: It means the assignment of work to different machines or work places which involve authorities to start of production activities in order of their priority as determined by scheduling. Expediting: It is also called Follow Up or Progress. Follow up which regulates the progress of materials and parts through the production process. It is closely interrelated with activities of dispatching. Inspection: It is an important control tool. Its assessment is important in the execution of current program and planning stage of undertaking when the limitations of the processor, method and manpower are known. It forms a basis for future investigations with respect to method, process etc. which is useful for evaluation phase. Evaluating: This is the integral part of control function. The evaluating function is concerned with providing a feedback mechanism on the long term basis so that the past experience can be evaluated with the aim of improving utilization of method and facilities.
  • 52.
    Aggregate Planning Aggregate planningis the process of developing, analysing, and maintaining a preliminary, approximate schedule of the overall operations of an organization. The aggregate plan generally contains targeted sales forecasts, production levels, inventory levels, and customer backlogs. This schedule is intended to satisfy the demand forecast at a minimum cost. Properly done, aggregate planning should minimize the effects of short-sighted, day-to-day scheduling, in which small amounts of material may be ordered one week, with an accompanying layoff of workers, followed by ordering larger amounts and rehiring workers the next week. This longer-term perspective on resource use can help minimize short-term requirements changes with a resulting cost savings. In simple terms, aggregate planning is an attempt to balance capacity and demand in such a way that costs are minimized. The term "aggregate" is used because planning at this level includes all resources "in the aggregate;" for example, as a product line or family. Aggregate resources could be total number of workers, hours of machine time, or tons of raw materials. Aggregate units of output could include gallons, feet, pounds of output, as well as aggregate units appearing in service industries such as hours of service delivered, number of patients seen, etc. Aggregate planning does not distinguish among sizes, colours, features, and so forth. For example, with automobile manufacturing, aggregate planning would consider the total number of cars planned for not the individual models, colours, or options. When units of aggregation are difficult to determine (for example, when the variation in output is extreme) equivalent units are usually determined. These equivalent units could be based on value, cost, worker hours, or some similar measure. Aggregate planning is considered to be intermediate-term (as opposed to long- or short-term) in nature. Hence, most aggregate plans cover a period of three to 18 months. Aggregate plans serve as a foundation for future short-range type planning, such as production scheduling, sequencing, and loading. The master production schedule (MPS) used in material requirements planning (MRP) has been described as the aggregate plan "disaggregated." Steps taken to produce an aggregate plan begin with the determination of demand and the determination of current capacity. Capacity is expressed as total number of units per time period that can be produced (this requires that an average number of units be computed since the total may include a product mix utilizing distinctly different production times). Demand is expressed as total number of units needed. If the two are not in balance (equal), the firm must decide whether to increase or decrease capacity to meet demand or increase or decrease demand to meet capacity. In order to accomplish this, a number of options are available. Options for situations in which demand needs to be increased in order to match capacity include: 1. Pricing. Varying pricing to increase demand in periods when demand is less than peak. For example, matinee prices for movie theatres, off-season rates for hotels, weekend rates for telephone service, and pricing for items that experience seasonal demand. 2. Promotion. Advertising, direct marketing, and other forms of promotion are used to shift demand. 3. Back ordering. By postponing delivery on current orders demand is shifted to period when capacity is not fully utilized. This is really just a form of smoothing demand. Service industries are able to smooth demand by taking reservations or by making appointments in an attempt to avoid walk- in customers. Some refer to this as "partitioning" demand. 4. New demand creation. A new, but complementary demand is created for a product or service. When restaurant customers have to wait, they are frequently diverted into a complementary (but not
  • 53.
    complimentary) service, thebar. Other examples include the addition of video arcades within movie theatres, and the expansion of services at convenience stores. Options which can be used to increase or decrease capacity to match current demand include: 1. Hire/lay off. By hiring additional workers as needed or by laying off workers not currently required to meet demand, firms can maintain a balance between capacity and demand. 2. Overtime. By asking or requiring workers to work extra hours a day or an extra day per week, firms can create a temporary increase in capacity without the added expense of hiring additional workers. 3. Part-time or casual labour. By utilizing temporary workers or casual labour (workers who are considered permanent but only work when needed, on an on-call basis, and typically without the benefits given to full-time workers). 4. Inventory. Finished-goods inventory can be built up in periods of slack demand and then used to fill demand during periods of high demand. In this way no new workers have to be hired, no temporary or casual labour is needed, and no overtime is incurred. 5. Subcontracting. Frequently firms choose to allow another manufacturer or service provider to provide the product or service to the subcontracting firm's customers. By subcontracting work to an alternative source, additional capacity is temporarily obtained. 6. Cross-training. Cross-trained employees may be able to perform tasks in several operations, creating some flexibility when scheduling capacity. 7. Other methods. While varying workforce size and utilization, inventory build-up/backlogging, and subcontracting are well-known alternatives, there are other, more novel ways that find use in industry. Among these options are sharing employees with counter-cyclical companies and attempting to find interesting and meaningful projects for employees to do during slack times.
  • 54.
    Aggregate Planning Strategies Thereare two pure planning strategies available to the aggregate planner: a level strategy and a chase strategy. Firms may choose to utilize one of the pure strategies in isolation, or they may opt for a strategy that combines the two.
  • 55.
    Level Strategy A levelstrategy seeks to produce an aggregate plan that maintains a steady production rate and/or a steady employment level. In order to satisfy changes in customer demand, the firm must raise or lower inventory levels in anticipation of increased or decreased levels of forecast demand. The firm maintains a level workforce and a steady rate of output when demand is somewhat low. This allows the firm to establish higher inventory levels than are currently needed. As demand increases, the firm is able to continue a steady production rate/steady employment level, while allowing the inventory surplus to absorb the increased demand. A second alternative would be to use a backlog or backorder. A backorder is simply a promise to deliver the product at a later date when it is more readily available, usually when capacity begins to catch up with diminishing demand. In essence, the backorder is a device for moving demand from one period to another, preferably one in which demand is lower, thereby smoothing demand requirements over time. A level strategy allows a firm to maintain a constant level of output and still meet demand. This is desirable from an employee relations standpoint. Negative results of the level strategy would include the cost of excess inventory, subcontracting or overtime costs, and backorder costs, which typically are the cost of expediting orders and the loss of customer goodwill.
  • 56.
    Chase Strategy A chasestrategy implies matching demand and capacity period by period. This could result in a considerable amount of hiring, firing or laying off of employees; insecure and unhappy employees; increased inventory carrying costs; problems with labour unions; and erratic utilization of plant and equipment. It also implies a great deal of flexibility on the firm's part. The major advantage of a chase strategy is that it allows inventory to be held to the lowest level possible, and for some firms this is a considerable savings. Most firms embracing the just-in-time production concept utilize a chase strategy approach to aggregate planning. Most firms find it advantageous to utilize a combination of the level and chase strategy. A combination strategy (sometimes called a hybrid or mixed strategy) can be found to better meet organizational goals and policies and achieve lower costs than either of the pure strategies used independently.
  • 57.
    Techniques for AggregatePlanning Techniques for aggregate planning range from informal trial-and-error approaches, which usually utilize simple tables or graphs, to more formalized and advanced mathematical techniques. William Stevenson's textbook Production/Operations Management contains an informal but useful trial-and- error process for aggregate planning presented in outline form. This general procedure consists of the following steps: 1. Determine demand for each period. 2. Determine capacity for each period. This capacity should match demand, which means it may require the inclusion of overtime or subcontracting. 3. Identify company, departmental, or union policies that are pertinent. For example, maintaining a certain safety stock level, maintaining a reasonably stable workforce, backorder policies, overtime policies, inventory level policies, and other less explicit rules such as the nature of employment with the individual industry, the possibility of a bad image, and the loss of goodwill. 4. Determine unit costs for units produced. These costs typically include the basic production costs (fixed and variable costs as well as direct and indirect labor costs). Also included are the costs associated with making changes in capacity. Inventory holding costs must also be considered, as should storage, insurance, taxes, spoilage, and obsolescence costs. Finally, backorder costs must be computed. While difficult to measure, this generally includes expediting costs, loss of customer goodwill, and revenue loss from cancelled orders. 5. Develop alternative plans and compute the cost for each. 6. If satisfactory plans emerge, select the one that best satisfies objectives. Frequently, this is the plan with the least cost. Otherwise, return to step 5.
  • 58.
    Line Balancing Many differencesexist in the management of production activities in make-to-order and make-to- stock firms. In make-to-order situations, due dates are important, and hence the sequencing of customer orders at various machine centres is an essential function. This involves both planning and control of activities. Make-to-stock products are generally high-volume consumer goods, such as telephones, automobiles, wrist watches, etc. The manufacture of standardized, high-volume items, which involves flow shops requires control for effective production. A flow shop consists of a set of facilities through which work flows in a serial fashion. The same operations are performed repeatedly in every work station, thus require lower-level skilled workers. The flow shop generally represents a mass production situation and hence the operations are carried out very efficiently e.g. when an operator has to install a gear box on an automotive assembly or assembling cooling system on a washing machine. In flow shops, items enter the finished goods inventory one after another, often in the same order of the inputs for these goods, leaving very low in-process inventories. Since the items are mostly make- to-stock, forecasting is a difficult job, and hence the finished goods levels in terms of anticipation inventories are very high. For the same reason, raw materials are carried at higher inventory levels. Machines in flow shop tend to have a special purpose design, and hence the initial investment level is generally high for heavy automated plants. The production control system of continuous production is called flow control. Specialization, high volume, division of labour and efficiency are built into the design of assembly lines. The main objective of flow control in flow shops it to balance the assembly line. The assembly line is represented in the form of a precedence diagram.
  • 59.
    Objective of AssemblyLine Balancing The objective of assembly line balancing is to subdivide the network into several sub networks (stations) without violating the precedence relationships and allocating operations to each station without exceeding the cycle time, i.e. the sum of the times of operations allocated to each station should not exceed the cycle time. While allocating operations to each station, the precedence relationships must be maintained. If these are followed, then we can ensure production of the specific volume of products ore items using the assembly line. At an interval equal to the cycle time, a completed assembly will be related from the assembly line.
  • 60.
    PERT and CPM:Techniques of Project Management PERT and CPM are techniques of project management useful in the basic managerial functions of planning, scheduling and control. PERT stands for “Programme Evaluation & Review Technique” and CPM are the abbreviation for “Critical Path Method”. These days the projects undertaken by business houses are very large and take a number of years before commercial production can start. The techniques of PERT and CPM help greatly in completing the various jobs on schedule. They minimise production delays, interruptions and conflicts. These techniques are very helpful in coordinating various jobs of the total project and thereby expedite and achieve completion of project on time. PERT is a sophisticated tool used in planning, scheduling and controlling large projects consisting of a number of activities independent of one another and with uncertain completion times. It is commonly used in research and development projects.
  • 61.
    The following stepsare required for using CPM and PERT for planning and scheduling: (i) Each project consists of several independent jobs or activities. All these jobs or activities must be separately listed. It is important to identify and distinguish the various activities required for the completion of the project and list them separately. (ii) Once the list of various activities is ready the order of precedence for these jobs has to be determined. We must see which jobs have to be completed before others can be started. Obviously, certain jobs will have to be done first. Many jobs may be done simultaneously and certain jobs will be dependent upon the successful completion of the earlier jobs. All these relationships between the various jobs have to be clearly laid down. (iii) The next step is to draw a picture or a graph which portrays each of these jobs and shows the predecessor and successor relations among them. It shows which job comes first and which next. It also shows the time required for completion of various jobs. This is known as the project graph or the arrow diagram. The three steps given above can be understood with the help of an example. Suppose, we want to construct a project graph of the simple project of preparing a budget for a large manufacturing firm. The managing director of this company wants his operating budget for the next year prepared as soon as possible. To accomplish this project, the company salesmen must provide sales estimates in units for the period to the sales manager. The sales manager would consolidate this data and give it to the production manager. He would also estimate market prices of the sales and give the total value of sales schedules of the units to be produced and assign machines for their manufacture. He would also plan the requirements of labour and other inputs and give all these schedules together with the number of units to be produced to the accounts manager who would provide cost of production data to the budget officer. Using the information provided by the sales, production and accounting departments, and the budget officer would make the necessary arrangements for internal financing and prepare the budget. We have seen that the project of preparing the budget involves a number of activities.
  • 62.
    Advantages of PERT Thefollowing advantages are derived from the pert: 1. It compels managers to plan their projects critically and analyse all factors affecting the progress of the plan. The process of the network analysis requires that the project planning be conducted on considerable detail from the start to the finish. 2. It provides the management a tool for forecasting the impact of schedule changes and be prepared to correct such situations. The likely trouble spots are located early enough so as to apply some preventive measures or corrective actions. 3. a lot of data can be presented in a highly ordered fashion. The task relationships are graphically represented for easier evaluation and individuals in different locations can easily determine their role in the total task requirements. 4. The PERT time (Te) is based upon 3-way estimate and hence is the most objective time in the light of uncertainties and results in greater degree of accuracy in time forecasting. 5. It results in improved communication; the network provides a common ground for various parties such as designers, contractors, project managers etc. and they must all understand each other’s role and contributions. The network will highlight areas that require attention of higher priority so that concentration can be applied to the key jobs without ignoring the lower priority tasks. This gives the management an opportunity to shift attention to any critical task so that the entire project is completed in time.
  • 63.
    Limitations of Pert Someof the limitations and problems that arise are: 1. Uncertainly about the estimate of time and resources. These must be assumed and the results can only be as good as the assumptions. 2. The costs may be higher than the conventional methods of planning and control. Because of the nature of net working and net work analysis, it needs a high degree of planning skill and greater amount of details which would increase the cost in time and manpower resources, 3. It is not suitable for relatively simple and repetitive processes such as assembly line work which are fixed-sequence jobs. Hence PERT is not very effective in manufacturing operations, since it deals in the time domain only and does not deal with the quality information which is necessary in manufacturing processes. These activities listed in the order of precedence are given below: In this graph jobs are shown as arrows leading from one circle on the graph to another. Thus, the arrow connecting the two circles represents a job. Circle one and two represent job a i.e. forecasting of units sale which would take 14 days. Circles 2 and 4 represent job b which will take ten days and so on. It would be seen that job c is not dependent upon job b and therefore, the two jobs can be done simultaneously. Once we reduce the project to network of activities and events and we estimate activity durations, we are in a position to determine the minimum time required for completion of the whole project. To do so, we must find the longest path or sequence connecting the activities through the network. This is called the ‘critical path’ of the project. The longest path is the critical path. In our example, there are two paths. One is connecting circle numbers 1, 2, 4 and 5. This path will take 14+10 + 10 = 34 days. The other path, is connecting circles 1,2,3,4 and 5, this path will takes 14 + 7 + 4+ 10 = 35 days. Obviously the 2nd path is the critical path and the project of budget presentation will take this much of time. The students will however notice that this time is shorter than the total time listed under Table 1 which will be 45 days. This is because jobs b and c can be done simultaneously. What we have basically described above is the very careful technique of CPM and PERT which
  • 64.
    consists of decomposingproject into activities and then ordering activities according to their relationships to find out the shortest time required to carry on an activity. This technique is very useful in case of projects which involve a large number of activities. It makes the project manager list out all the possible activities, their relationships, find out which activities can be performed first, which next and which can be performed simultaneously so as to find out the best possible manner of completing the project. A good project network goes a long way in reducing costs. Many companies work out the cost estimate of each activity and show Advantages of PERT: The following advantages are derived from the pert: 1. It compels managers to plan their projects critically and analyse all factors affecting the progress of the plan. The process of the network analysis requires that the project planning be conducted on considerable detail from the start to the finish. 2. It provides the management a tool for forecasting the impact of schedule changes and be prepared to correct such situations. The likely trouble spots are located early enough so as to apply some preventive measures or corrective actions. 3. a lot of data can be presented in a highly ordered fashion. The task relationships are graphically represented for easier evaluation and individuals in different locations can easily determine their role in the total task requirements. 4. The PERT time (Te) is based upon 3-way estimate and hence is the most objective time in the light of uncertainties and results in greater degree of accuracy in time forecasting. 5. It results in improved communication; the network provides a common ground for various parties such as designers, contractors, project managers etc. and they must all understand each other’s role and contributions. The network will highlight areas that require attention of higher priority so that concentration can be applied to the key jobs without ignoring the lower priority tasks. This gives the management an opportunity to shift attention to any critical task so that the entire project is completed in time. Limitations of Pert: Some of the limitations and problems that arise are: 1. Uncertainly about the estimate of time and resources. These must be assumed and the results can only be as good as the assumptions.
  • 65.
    2. The costsmay be higher than the conventional methods of planning and control. Because of the nature of net working and net work analysis, it needs a high degree of planning skill and greater amount of details which would increase the cost in time and manpower resources, 3. It is not suitable for relatively simple and repetitive processes such as assembly line work which are fixed-sequence jobs. Hence PERT is not very effective in manufacturing operations, since it deals in the time domain only and does not deal with the quality information which is necessary in manufacturing processes.
  • 66.
    Inventory Management In financialparlance, inventory is defined as the sum of the value of raw materials, fuels and lubricants, spare parts, maintenance consumables, semi-processed materials and finished goods stock at any given point of time. The operational definition of inventory would be. The amount of raw materials, fuel and lubricants, spare parts and semi-processed materials to be stocked for the smooth running of the plant. Since these resources are idle when kept in the stores, inventory is defined as an idle resource of any kind having an economic value. Inventories are maintained basically for the operational smoothness which they can effect by uncoupling successive stages of production, whereas the monetary value of inventory serves as a guide to indicate the size of the investment made to achieve this operations conveniences. The materials management department is expected to provide this operational convenience with a minimum possible investment in inventories. The objectives of inventory, operational and financial, needless to say, are conflicting. The materials department is accused of both stockouts as well as large investment in inventories. The solution lies in exercising a selective inventory control and applications of inventory control techniques. Types of Inventories Inventories may be classified as under: 1. Raw materials and production inventories: These are raw materials, parts and components which enter into the product direct during the production process and generally form part of the product. 2. In process inventories: Semi-finished parts, work-in-process and partly finished products formed at various stages of production. 3. M.R.O. Inventories: Maintenance, repairs and operating supplies which are consumed during the production process and generally do not form part of the product itself (e.g. Petroleum products – petrol, kerosene, diesel, various oils and lubricants, machinery and plant spares, tools, jibs and fixtures etc.) 4. Finished goods inventories: Complete finished products ready for sale. Inventories may also be classified according to the function they serve, such as: a) Movement and transit inventories: This arises because of the time necessary to move stocks from one place to another. The average amount can be determined mathematically thus – I = S x T Where, S represents the average rate of sales (say, weekly or monthly average) and T, the transit time required to move from one place to another, and I the movement inventory needed. As for example, if it takes three weeks to move materials to a warehouse from the plant and if the warehouse sells 110 per week, then the average inventory needed will be 110 units x 3 weeks – 330 units. In fact, when a unit of finished product is manufactured and ready for sale, it must remain idle for three weeks for movement to warehouse. Therefore, the plant stock on an average must be equal to three weeks’ sale in transit. b) Lot-size inventories: In order to keep costs of buying, receipt, inspection and transport and handling charges low, larger quantities are bought than are necessary for immediate use. It is common practice to buy some raw materials in large quantities in order to avail of quantity discounts. c) Fluctuation inventories: In order to cushion against unpredictable demands these are maintained, but they are not absolutely essential in the sense that such stocks are always uneconomical. Rather than taking what they can get, general practice of serving the customer better is the reason for holding
  • 67.
    such type ofinventories. d) Anticipation inventories: Such inventories are carried out to meet predictable changes in demand. In case of seasonable variations in the availability of some raw materials, it is convenient and also to some extent economical to build up stocks where consumption pattern may be reasonably uniform and predictable. Of the types of inventories discussed above, the Lot – size. Fluctuation and Anticipation Inventories may be said to be ‘Organisatoin Inventories’ As more and more of these basic types of inventories are carried into stock, less coordination and planning are required. Also less clerical and administrative efforts are needed and greater economies can be obtained in handling, manufacturing and dispatching. But the difficulty is that gains are not directly proportional to the size of inventories maintained. As the size increases, even if they are efficiently maintained, handled and properly located, gains form additional stock become less and less prominent. The cost of warehousing, obsolescence and capital costs associated with maintenance of large quantities grow at a faster quantities grow at a faster rate than the inventories themselves. As such, the basic problem is to strike a balance between the increase in costs and the decline in return from holding additional inventories. Striking a balance in a complex business situation through intuition alone is not easy. Costs, and to be sure, the balancing of opposite costs, like at the heart of all inventory control problems, for which cost analysis are necessary. As has already been said that even a typically medium size industrial organisation may use 10,000 to 15,000 different items which are carried in inventory. Initial planning and subsequent control of such inventories can only be accomplished on the basis of knowledge about them. Consequently, the starting point in inventory management and control is the development of a stores catalogue, which is more or less comprehensive and complete in all respects. All inventories should be fully and carefully described and a code number should be allotted. Similar items should be grouped together and standard codification should be adopted.
  • 68.
    Inventory Control Inventory controlmay be said to be a planned method whereby investments in inventories held in stock is maintained in such a manner that it ensures proper and smooth flow of materials needed for production operations as well as sales while at the same time, the total costs of investment in inventories is kept at a minimum. From the above definition it follows that a comprehensive inventory control system must be closely coordinated with other planning and control activities, such as, cash planning, capital budgeting, sales forecasting, including production planning, production scheduling and control. This impinges on a wide range of operations, operating decisions and policies for production, sales and finance. The finance controller of a company regards inventory as a necessary evil, since it drains off cash which could be used elsewhere to earn some profits. The marketing manner always wants enough of ready stock of finished goods inventories in order to give better customer service to ensure the company’s goodwill and would not like to see a sales opportunity lost for want of saleable ready stock. The production manager does not want an out of stock condition for which production might be held up. It will, therefore, be seen that everyone has some objectives which are conflicting in nature. The basic problem is, therefore, to strike a balance between operating efficiency and the costs of investment and other associated costs with large, inventories, with the object to keep the basic conflicts at the minimum while optimizing the inventory holding. Objective of Inventory Control 1. To reduce to the minimum idle time due to shortage of materials and spare parts. Neither man nor machine should have idle time due to lack of materials. 2. Similarly, to offer maximum service and satisfaction to the customers with regard to fulfilling the due dates strictly as per orders. The sole aim of a business is to create and retain customers. 3. At the same time, to minimize capital investment and cost of storage. Importance of Efficient Inventory Control System 1) An efficient inventory control system minimizes the possibility of delay in production. there is no danger of closure of plant, unemployment, lower dividend and replacement of management – a dark picture resulting out of poor inventory control. 2) It helps a company to secure many economies. For instance, no duplication in ordering, better use of available materials by inter department transfers, economies due to bulk purchases such as low freight, higher discount, lower price, less clerical work etc. 3) It is necessary for efficient accounting system, particularly for material aspect of cost accounting. 4) It discourages dishonesty, e.g. stealing material from the plant. 5) It expedites preparation of financial statements. 6) Losses, damages, deterioration of materials can be minimized and enables careful material- handling. Functions of Inventory Control (1) Keeping the stock of goods at the most appropriate level at all times so that the requirements of sales department can be always fulfilled. (2) Maintaining capital investment in stocks at a minimum desirable level, without sacrificing the main interest of trading. (3) Protecting the stocks from losses and damages due to improper handling, pilferage or unauthorized removal from the store.
  • 69.
    (4) Receiving andrecording of all goods routed in the store and keeping up-to-date trace of every outgoing item. (5) Indexing of all items of stock for their quick location. This is done through identifying marks, labels and Bin Cards. (6) Up-to-date inventory records must show the quantity and value of all goods in the warehouse, all receipts and deliveries made from the warehouse and the points at which replenishment of stocks become necessary by ordering new stocks. Standards in Inventory Control There are four important quantity standards in inventory control. 1. The Maximum Level It indicates the upper limit of the level of stocks or inventory. It points out the largest quantity to be normally kept in the store in the interest of economy. 2. The Minimum Level It indicates the lower limit of the level of stocks of inventory which is really a maximum reserve or margin of safety. This level of safety may be used only in an emergency. It is the level acting as a safety value. it is the minimum level of stocks which must be always on hand. It is the minimum reserve of the dealer. 3. The Standard Order It is quantity of stocks to be requisitioned for purchase at any one time. A repeat order for a commodity is always of the same quantity until conditions change, necessitating a revision of the standard order. The purchase requisition given the quantity for replenishment of stocks. 4. The Ordering Point It is the quantity of stock necessary to protect against the exhaustion of the stock during the gap between the date of order and the date of actual receipt. When the level of stocks or the balance on hand reaches this level, it is an indication that a new order must be placed at once. The time necessary to secure the stock of required articles after requisitioning must be carefully calculated and sufficient margin must be provided for contingent delays or bottlenecks in transport. The following factors are to be considered for establishing the stock level to be maintained in a business for effectiveness of the system of control. 1. On the basis of the previous records pertaining to sales and production, the demand for the inventory should be determined. It is essential to make allowance for fluctuations. In the case of business with seasonal sales, a change in the inventory level is necessary by periodical review of the inventory, the restored level should be maintained. 2. Present position regarding supplies of materials and labour and their availability 3. The next factor is the time that elapses between the time of requisitioning of the items and the time of the receipt of the same. This is called ‘lead time’. Due allowance should be made for the variability in the lead time. 4. Quantities of stocks on hand and required at the end of the period. 5. The effectiveness of the system depends upon the storage facilities available. Inventory level will be affected if there is lack of storage facilities. 6. In carrying stocks at higher levels there is the danger of expenses of storage involved. 7. The most important is the price factor. Low value items may be purchased in large quantities to take advantage of the price position while higher value items may be purchased frequently in small
  • 70.
    quantities. 8. Capital tobe invested in stock. 9. If higher levels of inventories are maintained, stock level will be affected by obsolescence, change in fashion and improvements in technicalities.
  • 71.
    Inventory Control Techniques (1)Perpetual Inventory and Continuous Stock Taking (2) A. B. C Analysis (3) Input-Output Ratio Analysis (4) Inventory Turnover Ratio (5) Economic Order Quantity 1. Perpetual Inventory System According to the Institute of Costs and Management Accountants, England, it is defined as “a system of records maintained by the controlling department which reflects the physical movements of stocks and their current balance”. It is a method of ascertaining balance after every receipt and issue of materials through stock records to facilitate and issue of materials through stock records to facilitate regular checking and to avoid closing down for stock-taking. In order to ensure accuracy of perpetual inventory record, it is desirable to check the physical stocks by a programme of continuous stock-taking. Any discrepancy noted between physical stock and stock records can be investigated and rectified, then and there. 2. A B C Control Method This method is useful in business organisations which are dealing in a number of items of goods. Under this method, inventories are grouped under three categories A, B and C “A” is allotted for the high value items, “B” for medium value items and “C” for low value items. Values of the items are converted into percentages; each item being stated at a percent of the total value of all the items. Usually items which account for 70% to 80% of the values are grouped under item ‘A’. Those which account for 10% to 20% of the values are grouped under item ‘B’. The remaining items are grouped under category ‘C’. High value items should be reviewed frequently and accurately and low value items may be reviewed at long periods. In the case of medium value items, the control should be more than the low value items, the control should be more than the low value items and less than the high value items. Moreover, in this case review need not be made as frequently as in the case of high value items. 3. Input-Output Ratio Analysis This ratio is the ratio of the raw-materials put into manufacturing and the standards raw materials content of the actual output. A standard ratio of input of material and output of material should be determined and the actual ratio is higher than the standard ratio, the performance will be considered to be below the standard ratio and vice-versa. In process industries it is a valuable report to show the percentage of losses that have occurred at each stage. It also measures the productivity of capital. this method is also useful to ascertain the raw material cost of finished output by multiplying the raw material cost per unit by this ratio. 4. Inventory Turnover Ratio This ratio is another method of exercising control. It is essential to compare the turnover of different kinds of materials to find out the items: which are slow moving, thus helping the management to avoid keeping capital locked up in such item. A low ratio is an indicator of slow moving stock, accumulation of obsolete stock, carrying of too much stock. It will lead to the disadvantages arising out of over-stocking. But a high turnover ratio is an indication of fast moving stock and investment in stock. If this ratio for a particular item is zero, it means that the item had not been used at all during the period and should be immediately disposed of; otherwise the quality of the item may get
  • 72.
    deteriorated. 5. Economic OrderQuantity (EOQ) The economy order quantity represents that quantum of products which should be ordered at a time so that the overall inventory cost is the lowest and stockout situations may be prevented. When the EOQ is determined, it helps management to order such a desirable quantity, that the erratic ordering to manufacturing plant is avoided to a large extent. When the ordering cost and the cost of carrying an additional unit in inventory are constant and the demand is known, the following formula, also called ‘square root law’, may be applied to arrive at the EOQ. EOQ = under root(2AO/C) EOQ = the most economical order quantity in units O = the preparation cost of one order in rupees A = the total number of units of products required per year, and C = the carrying cost per unit per year. Limitation of EOQ Formula However, the very restrictive nature of the assumptions made in the EOQ formula restrict the use of the formula in many cases of practical inventory situations. The cost-analyses on the basis of which the formulas have been developed are merely national rather than actual in some cases. In practice, unit cost of purchase of an item varies, lead times are uncertain and also requirements or demands of inventory items are not perfectly predictable in advance. Rate of consumption varies greatly in many cases. As such, the application of the formula often becomes difficult and a complicated matter.
  • 73.
    Inventory costs While thereare a lot of common grounds in the literature, the categories and subcategories of inventory costs fluctuate and overlap, or are designated under different names. Inventory costs fall into 3 main categories: • Ordering costs (also called Setup costs) • Carrying costs (also called Holding costs) • Stock-out costs (also called Shortage costs) Ordering costs The ordering cost (also called setup costs, especially when producers are concerned), or cost of replenishing inventory, covers the friction created by orders themselves, that is, the costs incurred every time you place an order. These costs can be split in two parts: • The cost of the ordering process itself: it can be considered as a fixed cost, independent of the number of units ordered. It typically includes fees for placing the order, and all kinds of clerical costs related to invoice processing, accounting, or communication. For large businesses, particularly for retailers, this might mainly boil down to the amortized cost of the EDI (electronic data interchange) system which allows the ordering process costs to be significantly reduced (sometimes by several orders of magnitude). • The inbound logistics costs, related to transportation and reception (unloading and inspecting). Those costs are variable. Then, the supplier’s shipping cost is dependent on the total volume ordered, thus producing sometimes strong variations on the cost per unit of order. It is not easy to produce even a rough estimate of the ordering cost, since it includes elements that are very business specific and even item specific: suppliers can be local or overseas, they can adopt rules to deliver only per palette instead of per unit, or only when a certain number of items is ordered; then of course, suppliers can provide volume discounts, etc. There are ways to try to minimize those costs, more precisely to determine the right trade-off of carrying costs vs. volume discounts, thus essentially balancing the cost of ordering too much and the cost of ordering too less (basically, a smaller inventory typically leads to more orders, which means higher ordering costs, but is also implies lower carrying costs). This is usually achieved through the calculation of the Economic Order Quantity (EOQ). Without going into details here, let’s just add the following reminder: though a classical way often appears in the literature to compute the EOQ with the Wilson formula, this particular formula - going back to 1913 - is a poor fit for retailers, mainly because it assumes that the ordering cost is a flat. Nevertheless, it is possible to determine optimal order quantities by devising a cost function taking into account volume discounts, as detailed in our article. Carrying costs Carrying costs are central for a “static” viewpoint on inventory, that is, when focusing on the impact of having more or less inventory, independently of the inventory flow. Again the typology varies in the literature; the categorization we propose is the following: • Capital costs (or financing charges) • Storage space costs • Inventory services costs • Inventory risk costs Capital costs
  • 74.
    It is thelargest component among the carrying inventory costs. It includes everything related to the investment, the interests on working capital and the opportunity cost of the money invested in the inventory. Storage space costs They include the cost of building and facility maintenance (lighting, air conditioning, heating, etc.), the cost of purchase, depreciation, or the lease, and the property taxes. These costs are obviously vastly dependent on the kind of storage chosen, whether the warehouses are company owned or rented, for instance. For smaller businesses, when the same building is used for different purposes, the portion of the building associated with receiving and storing inventory must be determined. Inventory services costs They include insurance, IT hardware and applications, but also physical handling with the corresponding human resources, management, etc. We can also put in this category the expenses related to inventory control and cycle counting. Finally, although they are kind of a category on their own, taxes can also be added here. Inventory risk costs They cover essentially the risk that the items might fall in value over the period they are stored. This is especially relevant in the retail industry and with perishable goods. Risks first include shrinkage, which is basically the loss of products between the purchase from the suppliers (i.e. recorded inventory) and the point of sale (i.e. actual inventory), caused by administrative errors (shipping errors, misplaced goods, …), vendor fraud, pilferage and theft (including employee theft), damage in transit or during the period of storage (because of incorrect storage, water or heat damage, …). For the reasons mentioned previously, it is hard to give more precise estimates. Let’s simply say that for the categories mentioned above, the following estimates can be found in the literature: • Capital costs: 15% approximately • Storage space costs: 2% approximately • Inventory service costs: 2% approximately • Inventory risks costs: 6% approximately Stock out costs Finally, to get a complete vision of the inventory costs, we should also add the stock out costs (or shortage costs), that is, the costs incurred when stock outs take place. For retailers, it can include the costs of emergency shipments, change of suppliers with faster deliveries, substitution to less profitable items, etc. While this kind of costs can be determined quite precisely, others are not so easy to pinpoint, such as the cost in terms of customer loss of loyalty or the general reputation of the company. Modelling the cost of stock outs is in itself a vast topic that goes beyond the scope of this article. Let’s simply mention that basically the cost of inventory is counter-balanced by the opportunity cost of stock-outs. Balancing the cost of inventory with cost of stock-outs is typically achieved through the tuning of service levels.
  • 75.
    Selective Inventory Control ABCAnalysis This is one of the basic analytical management tool which enables top management to place the effort where the results will be greatest. This technique tries to analyze the distribution of an characteristic by money value of importance in order to determine its priority. The annual materials consumption analysis of an organisation would indicate that a handful of high value items-less than 10 percent of the total number will account for a substantial portion of about 70-75 percent of the total consumption value, and these few vital items are called ‘A’ items which needs careful attention of the materials manager. Similarly, large number of bottom’ items over 70 percent of the total number called the trivial many – account for about 10 percent of the total consumption value, and are known as the ‘C’ class. The items that lie between the top and bottom are called the ‘B’ category items. Procedural Steps of ‘ABC’ Analysis a) Identify all the items used by a company b) List all the items as per their money value in the descending order. i.e. The high valued items will be listed first followed by the next valued item. c) Count the number of high valued, medium valued and low valued items d) Calculate the individual values of the high, medium and low valued items. This is arrived at first by multiplying the number of items as in step and (d) Their values as in step (b) and adding all the items in different categories high, medium and low. e) Find the percentage of high, medium and low valued items. High valued items normally contribute for 70 percent or so of the total inventory cost and medium and low valued items 20 and 10 percent respectively. f) A graph can be plotted between percent of items and percent of total inventory cost. Purpose of ABC Analysis The object of carrying out ABC analysis is to develop policy guidelines for selective control. After the analysis, broad policy guidelines can be established. A. Items: High Consumption Value B. Items: Moderate Value C. Items: Low Consumption Value Advantages and Disadvantages of ABC Analysis This approach helps the materials manager to exercise selective control and focus his attention only on a few items when he is confronted with lakhs of stores items. By concentrating on high valued ‘A’ items, the manager will be able to effectively control inventories and show the ‘visible’, results in a short spen of time by reducing the overall working capital requirement and increasing the profit of the company. By this analysis obsolete stocks are automatically pin pointed. This results in better planning and improved inventory turnover. The major limitation of the ABC analysis is that it takes into account the total consumption value of items but not their vitality. Some items, though negligible in monitory value, may be vital for running the plant or machines. For example, the connecting belts in case of motors, foundation bolts etc. the results of ABC analysis have to be reviewed periodically and updated. Low valued item in ‘C’ category, like diesel oil to ruin the generator, may become B for A category item during the power crises.
  • 76.
    VED analysis This analysisattempts to classify items into many categories depending upon the consequences of materials stock out when demanded. The cost of storage may vary depending upon the seriousness of such a situation. The items are classified into V (Vital), E (Essential) and D (Desirable) categories. Vital items are the most critical having extremely high opportunity cost of shortage and must be available in stock when demanded. Essential items are quite critical with substantial cost associated with shortage and should be available in stock and by and large. Desirable group of items do not have very serious consequences if not available when demanded but can be stocked items. Hence, the percentage risk of shortage with the ‘vital’ items has to be quite small, thus calling for high level of stock. With ‘Essential category we can take a relatively high risk of shortage and for ‘Desirable’ category even higher. So, depending upon the seriousness of the requirement of the item they are classified. FSN Analysis The items that are being used in a company are not required to be purchased at the same frequency. Some materials are quite regularly required, yet some others are required very occasionally and some materials may have become absolute and might not have been demanded for years together. This FSN analysis groups then into three categories as fast moving. Slow-moving and Non-moving items. Inventory policies and models for he three categories have to be different. Most spare parts come under the slow moving category which has to be managed on a different basis. For non-moving dead stock, we have to determine optimal stock disposal procedures and rules rather than inventory provisioning rules. Categorization of materials into three types on values, critically and usage enables us to adopt the right type of inventory policy to suit a particular situation.
  • 77.
    Material Requirements Planning Materialrequirements planning (MRP) is a computer-based inventory management system designed to assist production managers in scheduling and placing orders for items of dependent demand. Dependent demand items are components of finished goods—such as raw materials, component parts, and subassemblies—for which the amount of inventory needed depends on the level of production of the final product. For example, in a plant that manufactured bicycles, dependent demand inventory items might include aluminium, tires, seats, and bike chains. The first MRP systems of inventory management evolved in the 1940s and 1950s. They used mainframe computers to explode information from a bill of materials for a certain finished product into a production and purchasing plan for components. Before long, MRP was expanded to include information feedback loops so that production personnel could change and update the inputs into the system as needed. The next generation of MRP, known as manufacturing resources planning or MRP II, also incorporated marketing, finance, accounting, engineering, and human resources aspects into the planning process. A related concept that expands on MRP is enterprise resources planning (ERP), which uses computer technology to link the various functional areas across an entire business enterprise. MRP works backward from a production plan for finished goods to develop requirements for components and raw materials. MRP begins with a schedule for finished goods that is converted into a schedule of requirements for the subassemblies, the component parts, and the raw materials needed to produce the final product within the established schedule. MRP is designed to answer three questions: what is needed? how much is needed? and when is it needed?" MRP breaks down inventory requirements into planning periods so that production can be completed in a timely manner while inventory levels—and related carrying costs—are kept to a minimum. Implemented and used properly, it can help production managers plan for capacity needs and allocate production time. But MRP systems can be time consuming and costly to implement, which may put them out of range for some small businesses. In addition, the information that comes out of an MRP system is only as good as the information that goes into it. Companies must maintain current and accurate bills of materials, part numbers, and inventory records if they are to realize the potential benefits of MRP.
  • 78.
    MRP Inputs The informationinput into MRP systems comes from three main sources: a bill of materials, a master schedule, and an inventory records file. The bill of materials is a listing of all the raw materials, component parts, subassemblies, and assemblies required to produce one unit of a specific finished product. Each different product made by a given manufacturer will have its own separate bill of materials. The bill of materials is arranged in a hierarchy, so that managers can see what materials are needed to complete each level of production. MRP uses the bill of materials to determine the quantity of each component that is needed to produce a certain number of finished products. From this quantity, the system subtracts the quantity of that item already in inventory to determine order requirements. The master schedule outlines the anticipated production activities of the plant. Developed using both internal forecasts and external orders, it states the quantity of each product that will be manufactured and the time frame in which they will be needed. The master schedule separates the planning horizon into time "buckets," which are usually calendar weeks. The schedule must cover a time frame long enough to produce the final product. This total production time is equal to the sum of the lead times of all the related fabrication and assembly operations. It is important to note that master schedules are often generated according to demand and without regard to capacity. An MRP system cannot tell in advance if a schedule is not feasible, so managers may have to run several possibilities through the system before they find one that works. The inventory records file provides an accounting of how much inventory is already on hand or on order, and thus should be subtracted from the material requirements. The inventory records file is used to track information on the status of each item by time period. This includes gross requirements, scheduled receipts, and the expected amount on hand. It includes other details for each item as well, like the supplier, the lead-time, and the lot size.
  • 79.
    MRP Processing Using informationculled from the bill of materials, master schedule, and inventory records file, an MRP system determines the net requirements for raw materials, component parts, and subassemblies for each period on the planning horizon. MRP processing first determines gross material requirements, then subtracts out the inventory on hand and adds back in the safety stock in order to compute the net requirements. The main outputs from MRP include three primary reports and three secondary reports. The primary reports consist of: planned order schedules, which outline the quantity and timing of future material orders; order releases, which authorize orders to be made; and changes to planned orders, which might include cancellations or revisions of the quantity or time frame. The secondary reports generated by MRP include: performance control reports, which are used to track problems like missed delivery dates and stock outs in order to evaluate system performance; planning reports, which can be used in forecasting future inventory requirements; and exception reports, which call managers' attention to major problems like late orders or excessive scrap rates. Although working backward from the production plan for a finished product to determine the requirements for components may seem like a simple process, it can actually be extremely complicated, especially when some raw materials or parts are used in a number of different products. Frequent changes in product design, order quantities, or production schedule also complicate matters. The importance of computer power is evident when one considers the number of materials schedules that must be tracked.
  • 80.
    Benefits and Drawbacksof MRP MRP systems offer a number of potential benefits to manufacturing firms. Some of the main benefits include helping production managers to minimize inventory levels and the associated carrying costs, track material requirements, determine the most economical lot sizes for orders, compute quantities needed as safety stock, allocate production time among various products, and plan for future capacity needs. The information generated by MRP systems is useful in other areas as well. There is a large range of people in a manufacturing company that may find the use of information provided by an MRP system very helpful. Production planners are obvious users of MRP, as are production managers, who must balance workloads across departments and make decisions about scheduling work. Plant foremen, responsible for issuing work orders and maintaining production schedules, also rely heavily on MRP output. Other users include customer service representatives, who need to be able to provide projected delivery dates, purchasing managers, and inventory managers. MRP systems also have several potential drawbacks. First, MRP relies upon accurate input information. If a small business has not maintained good inventory records or has not updated its bills of materials with all relevant changes, it may encounter serious problems with the outputs of its MRP system. The problems could range from missing parts and excessive order quantities to schedule delays and missed delivery dates. At a minimum, an MRP system must have an accurate master production schedule, good lead-time estimates, and current inventory records in order to function effectively and produce useful information. Another potential drawback associated with MRP is that the systems can be difficult, time consuming, and costly to implement. Many businesses encounter resistance from employees when they try to implement MRP. For example, employees who once got by with sloppy record keeping may resent the discipline MRP requires. Or departments that became accustomed to hoarding parts in case of inventory shortages might find it difficult to trust the system and let go of that habit. The key to making MRP implementation work is to provide training and education for all affected employees. It is important early on to identify the key personnel whose power base will be affected by a new MRP system. These people must be among the first to be convinced of the merits of the new system so that they may buy into the plan. Key personnel must be convinced that they personally will be better served by the new system than by any alternate system. One way to improve employee acceptance of MRP systems is to adjust reward systems to reflect production and inventory management goals.
  • 81.
    MRP II In the1980s, MRP technology was expanded to create a new approach called manufacturing resources planning, or MRP II. "The techniques developed in MRP to provide valid production schedules proved so successful that organizations became aware that with valid schedules other resources could be better planned and controlled," Gordon Minty noted in his book Production Planning and Controlling. "The areas of marketing, finance, and personnel were affected by the improvement in customer delivery commitments, cash flow projections, and personnel management projections." Minty went on to explain that MRP II "has not replaced MRP, nor is it an improved version of it. Rather, it represents an effort to expand the scope of production resource planning and to involve other functional areas of the firm in the planning process," such as marketing, finance, engineering, purchasing, and human resources. MRP II differs from MRP in that all of these functional areas have input into the master production schedule. From that point, MRP is used to generate material requirements and help production managers plan capacity. MRP II systems often include simulation capabilities so managers can evaluate various options. Implementing or improving Material Requirements Planning can provide the following benefits for your company: • Reduced Inventory Levels • Reduced Component Shortages • Improved Shipping Performance • Improved Customer Service • Improved Productivity • Simplified and Accurate Scheduling • Reduced Purchasing Cost • Improve Production Schedules • Reduced Manufacturing Cost • Reduced Lead Times • Less Scrap and Rework • Higher Production Quality • Improved Communication • Improved Plant Efficiency • Reduced Freight Cost • Reduction in Excess Inventory • Reduced Overtime • Improved Supply Schedules • Improved Calculation of Material Requirements • Improved Competitive Position
  • 82.
    Quality The word qualityis often used indiscriminately for many different meanings. Quality can be defined as “fitness for use,” “customer satisfaction,” “doing things right the first time,” or “zero defects.” These definitions are acceptable because quality can refer to degrees of excellence. Webster’s dictionary defines quality as “an inherent characteristic, property or attribute.” Quality is a characteristic of a product or process that can be measured. Quality control is the science of keeping these characteristics or qualities within certain bounds. In a manufacturing or service environment, there are two major categories of quality: quality of design and quality of conformance. A poorly designed product will not function properly regardless of how well it meets its specifications. Conversely, a product that does not conform to excellent design specifications will not properly perform its intended function.
  • 83.
    Basic Quality Concepts ABrief History of Quality 1550 BC - Egyptian royal cubit was standardized. It was about 20.63'' ± .02''. 1654 - Blaise Pascal with Pierre de Fermat developed the theory of probability. They were prompted by the inquiries of gamblers seeking inside information to help them win at cards and dice. Early 1800's - Concepts of tolerances and gauging were developed in American armories. 1861-1865, Civil War - Tolerance and gauging concepts were used to mass produce arms with interchangeability of parts. After the Civil War - Tolerance and gauging concepts were used and improved by companies such as Singer and McCormick. 1916 - Ford Motor Company developed systematic material handling, machine tool design, factory layout and final inspection. Automobile production went from ten thousand cars in 1909 to sixty thousand in 1916. The price decreased from $850 to $350 per car. 1917 - The first published use of the term Control of Quality appeared in Industrial Management in an article by G. S. Radford. 1922 - G. S. Radford published the first book on Quality Control: The Control of Quality of Manufacturing. 1924 - Dr. Walter A. Shewhart of AT&T developed the concept of control charts. Dr. Shewhart is referred to as the father of statistical quality control. 1925 - Harold F. Dodge of AT&T developed sampling concepts and terminology used in acceptance sampling. 1931 - Dr. Walter A. Shewhart published Economic Control of Manufactured Product. This was the first in-depth book on statistical quality control. 1941-1945 - The United States was involved in World War II. The war generated the first extensive use of statistical concepts. U.S. Government suppliers were required to use statistical quality control. The government sponsored many statistics and quality control training classes. 1941 - Harold F. Dodge and Harry G. Romig published a unique book on sampling procedures. Single and Double Sampling Inspection Tables. These tables were the forerunners of the military standard sampling tables. 1944 - The Dodge-Romig Sampling Tables were published. OC curves, lot sizes and sample sizes are given by AOQL. The tables include single and double sampling plans. 1946 - The ASQC was organized and George Edwards of AT&T became the first president. 1947 - ASQC created the Shewhart medal to recognize outstanding contributors to the quality profession. 1950 - Joseph M. Juran and W. Edwards Deming taught statistical methods and statistical quality control to the Japanese. 1950 - Military Standard for Sampling by Attributes was published as Mil-Std 105A. 1951 - Joseph M. Juran published the first edition of Quality Control Handbook. 1968 - ASQC administers the first examination for Certified Quality Engineer. There were 147 successful candidates. 1970's - The focus was on continuous improvement and employee involvement. 1980's - The emphasis was on quality of design and design for manufacturability. Computers were used extensively in all aspects of quality.
  • 84.
    1987 - TheInternational Organization for Standardization (ISO) establishes ISO 9000 Series Quality System Standards. 1987 - Congress established the Malcolm Baldrige National Quality Award to promote quality awareness, to recognize significant quality achievements of U.S.companies, and to call public attention to successful quality strategies. The award is not for specific products or services. 1988 - The first Baldrige award winners were announced. They were Globe Metallurgical Inc. (small business), Motorola Inc. (manufacturing) and Westinghouse Electric Corporation’s Commercial Nuclear Fuel Division (manufacturing). 1989 - Military Standard for Sampling by Attributes is reissued as Mil-Std 105E. 1990's - Quality Concepts were extended to service industries. Emphasis is on total quality management (TQM) and customer satisfaction. 1993 - ANSI/ASQC Z1.4 Sampling Tables and Procedures replaced Mil-Std 105E. 1994 - ISO 9000 Standards were revised (for clarification?). ANSI/ASQC series standards renamed from Q90 series to Q9000 series. 1996 - Eight thousand U.S. companies have achieved ISO registration since its inception. Eight percent of all companies that are ISO registered are located in North America. Forty six percent are located in the United Kingdom. 1996 - Since the ASQC certification program began, more than 55,000 people have become certified in one or more of the certification areas. 1997 - The American Society for Quality Control (ASQC) officially changed its name to the American Society for Quality (ASQ).
  • 85.
    The Nature ofVariation While standing on a street corner observing the passing traffic, two cars of the same make and model stop at a traffic light. Both cars are the same color, have Goodyear tires and have a luggage rack on the trunk. At first glance, the cars seem identical. Upon closer observation, differences are detected. Both cars have Goodyear tires, but are the tires the same size? Are the radios the same? Is the upholstery the same? There are many characteristics for comparison. The closer an item is examined; the more differences are found. No two objects are exactly alike. All things differ by some degree. Some variation may be obvious, but other variation may require precise measuring equipment to detect. All manufactured parts exhibit variation. It is the concept of variation that forms the basis of probability, statistics and quality control. Consider a part that is produced by a punch press. As raw material is fed into the press, the machine punches out the parts. Eventually the press will produce a large number of similar parts. A visual check of the diameters may reveal no differences among the parts. If the diameter is measured with a scale, some differences will be found. If the measurements are made with a micrometre, a greater number of differences will be detected. Each level of comparison or method of measurement reveals a greater amount of variation. As the measurements increase in precision, the differences among the parts become greater and greater until ultimately none of the parts would be the same. As the level of comparison becomes more precise, the concept that no two objects are exactly alike is realized. Design Quality Design quality refers to the level of characteristics that the designers specify for a product. High- grade materials, tight tolerances, special features and high performance are characteristics associated with the term, high quality product. An example of design quality may be shown by the comparison between an expensive automobile and an economy model. A Ferrari and a Ford Escort are compared. Both cars will perform the same basic function of getting from point A to point B. Each will generally conform to its design specification. The owners in both cases may be satisfied with the way their cars are put together. However, that is where the similarity ends. The Escort owner does not expect his car to go 150 mph, have leather seats and have twelve coats of paint, or be highly responsive. The Ferrari owner expects these characteristics or qualities. The cost of making a product will usually rise as more characteristics are specified to increase product performance, improve comfort, improve ease of use and make the product look better. High- grade materials usually command a premium price. However, in many cases, increased competition creates an atmosphere of finding ways to make better and less expensive designs. This is true for products such as computers, VCRs and televisions. The reliability of a product must be considered in the design stage. Reliability is the probability that a product will perform its intended function, without failure, for a specified length of time. Reliability is dependent on the basic design, the quality of materials and the quality of components that go into the final product. To achieve the required reliability, designers may need to specify higher priced components. This may translate to higher prices but also higher value for the consumer. Many products command a premium price because they provide value to the consumer. Others may be expensive because of their role as status symbols. Expensive products do not always contribute to better product performance or customer satisfaction. This is particularly true in the software industry.
  • 86.
    Many low pricedapplications work just as well and sometimes better than expensive ones. The designer may receive input from various sources when determining the level of design quality. In addition to the designer’s own ideas, input concerning product performance, materials to be used and various product characteristics may be received from management, marketing, sales, other engineering organizations or directly from customers. The final design specification may or may not be what the designer had in mind. Although some quality engineers and other quality professionals get involved with product design, their time and effort is usually spent in designing and maintaining systems to measure and control process and product characteristics after the design is complete. A challenge to quality engineers is to implement the statistical techniques used in manufacturing during the design stage. The goals would be to enhance product design by eliminating problems early in the design process to ensure the ease of manufacturing. Conformance Quality After the level of design quality has been determined, the product characteristics are formed into drawings and specifications. The manufacturing engineers will use the drawings and specifications to develop manufacturing specifications and design the operations necessary to produce the product. This includes the floor layout, machinery, test sets, tools and other equipment. A plan for the number of employees required may also be included. The quality engineer works with the manufacturing engineer to make the quality system and maintenance of conformance quality an integral part of the manufacturing process. Any product checks, process checks or quality improvement activities should be an inherent part of the process. Conformance quality may be defined as the degree of adherence of the product characteristics to the design drawings and specifications. The objective of a quality program is to have a system that will measure and control the degree of product and process conformance in the most economical way. The quality engineer will determine what product or process characteristics are to be checked. The quality engineer will also determine the type of data to be collected, the corrective actions required, and the statistical tools or other techniques to be used.
  • 87.
    Quality Systems A qualitysystem is a mechanism that coordinates and maintains the activities needed to ensure that the characteristics of products, processes or services are within certain bounds. A quality system involves every part of an organization that directly or indirectly affects these activities. Typically, the quality system is documented in a quality manual and in the associated documents that specify procedures and standards.
  • 88.
    Basic Elements ina Quality System There are three basic elements in a quality system: Quality Management, Quality Control, and Quality Assurance. Quality Management: Quality management is the means of implementing and carrying out quality policy. They perform goal planning and manage quality control and quality assurance activities. Quality management is responsible for seeing that all quality goals and objectives are implemented and that corrective actions have been achieved. They periodically review the quality system to ensure effectiveness and to identify and review any deficiencies. Quality Control: The term quality control describes a variety of activities. It encompasses all techniques and activities of an organization that continuously monitor and improve the conformance of products, processes or services to specifications. Quality control may also include the review of processes and specifications and make recommendations for their improvement. Quality control aims to eliminate causes of unsatisfactory performance by identifying and helping to eliminate or at least narrow the sources of variation. Quality control has the same meaning as variation control of product characteristics. The objective of a quality control program is to define a system in which products meet design requirements and checks and feedback for corrective actions and process improvements. Quality control activities should also include the selecting and rating of suppliers to ensure that purchased products meet quality requirements. Quality Assurance: The term quality assurance describes all the planned and systematic actions necessary to assure that a product or service will satisfy the specified requirements. Usually this takes the form of an independent final inspection. The distinction between quality control and quality assurance is stated in an ANSI/ASQ standard: “Quality control has to do with making quality what it should be, and quality assurance has to do with making sure quality is what it should be.” The quality assurance function should represent the customer and be independent of the quality control function, which is an integral part of the manufacturing operation.
  • 89.
    Fundamental Principles ofQuality Statistical Quality Control and Statistical Process Control Statistical quality control (SQC) and statistical process control (SPC) are scientific methods for analyzing data and keeping the process within certain boundaries. Many statistical tools, such as control charts, Pareto analysis, design of experiments, regression analysis and acceptance sampling may be used. SQC methods can be applied to anything that is possible to express in the form of numbers. SQC is concerned with product characteristics and SPC is concerned with process characteristics. The word statistical means having to do with numbers, or more specifically, with drawing conclusions from numbers. The word quality means much more than the goodness or defectiveness of the product. It refers to the qualities or characteristics of the product or process being studied. The word control means to keep something within boundaries or to regulate it so that its outcome may be predicted with some degree of accuracy. In a manufacturing operation, conformance quality characteristics are to be kept within certain bounds. Taken together, the words Statistical Quality Control or Statistical Process Control mean: Statistical - With the help of numbers or data, Quality or Process - The characteristics of a product or process are studied, Control - To make them behave the way they are intended to behave. The most important element in statistical quality control is the feedback loop between the quality control function and the make operation. In statistical process control, the feedback loop is between the process control function and the device that regulates the process or the person responsible for adjustments. Continuous feedback and the appropriate corrective action drive statistical quality control and statistical process control to achieve the desired results. Both SQC and SPC seem to work best when the checks and feedback loops are automated and human intervention is minimized. The Law of Large Numbers The law of large numbers is a mathematical concept that says: Individual occurrences are unpredictable and group occurrences are predictable. The number of marriages, births and deaths in the United States next year can be predicted with some degree of accuracy, but exactly who will get married, who will be born or who will die cannot be predicted. This concept can be applied to a manufacturing process. For example, a statistical study can determine that products from a certain process are on average two percent defective. However, in any sample, the specific parts that will be defective cannot be predicted. Central Limit Theorem The central limit theorem states that a group of averages of sample size 4, 5 or 6 units always tends to follow the pattern of a normal distribution. If the population distribution leans to one side or the other, the distribution of sample averages from that population will tend to be symmetrical and have normal variation. The central limit theorem is what legitimizes the use of variables control charts regardless of the actual population distribution. The normal distribution and control charts will be reviewed in a subsequent chapter. Data Webster's dictionary defines the word data as a plural noun portraying factual information such as measurements or statistics used as a basis for reasoning, discussion, or calculation. Data are categorized in two ways: attribute data and variables data. Data classified as good/bad, pass/fail,
  • 90.
    go/no-go, etc., arecalled attribute or discrete data. When actual measurements are taken and recorded, the data are called variables or continuous data. In many cases (but not all cases), variables data will be distributed in a symmetrical bell-shaped curve called the normal curve. The known areas under the curve allow for inferences to be made about the process with relatively small amounts of information. By using the known areas under the curve, the fraction of measurements that will lie between, above, or below certain values can be predicted with a high degree of accuracy. Distributions Because of variation between measurements of individual parts, data when plotted will form a distribution. A distribution model describes how the data are dispersed. A plot of the distribution will show a center value and the range of measurements. The variation between data values will usually be quite small and follow a natural pattern. Large variation indicates that the pattern is unnatural. This may be attributed to external or assignable causes. When a pattern is unnatural, the cause should be investigated and eliminated. Statistical techniques such as control charts are used to identify the unnatural patterns. A plot of the actual data showing the data values versus the number of occurrences is called a histogram. A mathematical estimate of the shape of the histogram is called a frequency distribution. Distributions are formed because everything in the world that can be measured exhibits variation. If the measuring instrument is very precise, it will be discovered that like the snowflake, no two measurements are exactly the same. Precision and Accuracy In addition to the objects that are measured, the measuring instrument itself has variability. Two different instruments may measure the same parts and yield different results. In many cases, measuring parts a second time with the same instruments will give a different result. A low value of the instrument’s standard deviation indicates greater precision. When an instrument is accurate but not precise, the measurements are distributed about the true value within the acceptable range. When an instrument is precise but not accurate, the measurements are clustered close together but at a distance from the true value. When an instrument is both accurate and precise, the data are clustered close together around the true value. Statistical Techniques Many statistical techniques are used in quality control and inspection. Listed below are the most widely used statistical methods. • Histograms • Acceptance Sampling • Statistical Inference • Process Capability Analysis • Hypothesis Testing • Reliability • Decision Errors • Regression & Correlation • Statistical Process Control • Design of Experiments • Control Charts • Pareto Analysis
  • 91.
    Cost of Quality Costof poor quality (COPQ) The costs associated with providing poor quality products or services. There are four categories: internal failure costs (costs associated with defects found before the customer receives the product or service), external failure costs (costs associated with defects found after the customer receives the product or service), appraisal costs (costs incurred to determine the degree of conformance to quality requirements) and prevention costs (costs incurred to keep failure and appraisal costs to a minimum). Cost of quality is a methodology that allows an organization to determine the extent to which its resources are used for activities that prevent poor quality, that appraise the quality of the organization’s products or services, and that result from internal and external failures. Having such information allows an organization to determine the potential savings to be gained by implementing process improvements. Quality-related activities that incur costs may be divided into prevention costs, appraisal costs, and internal and external failure costs.
  • 92.
    Prevention costs Prevention costsare incurred to prevent or avoid quality problems. These costs are associated with the design, implementation, and maintenance of the quality management system. They are planned and incurred before actual operation, and they could include: Product or service requirements—establishment of specifications for incoming materials, processes, finished products, and services Quality planning—creation of plans for quality, reliability, operations, production, and inspection Quality assurance—creation and maintenance of the quality system Training—development, preparation, and maintenance of programs
  • 93.
    Appraisal costs Appraisal costsare associated with measuring and monitoring activities related to quality. These costs are associated with the suppliers’ and customers’ evaluation of purchased materials, processes, products, and services to ensure that they conform to specifications. They could include: Verification—checking of incoming material, process setup, and products against agreed specifications Quality audits—confirmation that the quality system is functioning correctly Supplier rating—assessment and approval of suppliers of products and services
  • 94.
    Internal failure costs Internalfailure costs are incurred to remedy defects discovered before the product or service is delivered to the customer. These costs occur when the results of work fail to reach design quality standards and are detected before they are transferred to the customer. They could include: Waste—performance of unnecessary work or holding of stock as a result of errors, poor organization, or communication Scrap—defective product or material that cannot be repaired, used, or sold Rework or rectification—correction of defective material or errors Failure analysis—activity required to establish the causes of internal product or service failure
  • 95.
    External failure costs Externalfailure costs are incurred to remedy defects discovered by customers. These costs occur when products or services that fail to reach design quality standards are not detected until after transfer to the customer. They could include: Repairs and servicing—of both returned products and those in the field Warranty claims—failed products that are replaced or services that are re-performed under a guarantee Complaints—all work and costs associated with handling and servicing customers’ complaints Returns—handling and investigation of rejected or recalled products, including transport costs
  • 96.
    Cost of qualityand organizational objectives The costs of doing a quality job, conducting quality improvements, and achieving goals must be carefully managed so that the long-term effect of quality on the organization is a desirable one. These costs must be a true measure of the quality effort, and they are best determined from an analysis of the costs of quality. Such an analysis provides a method of assessing the effectiveness of the management of quality and a means of determining problem areas, opportunities, savings, and action priorities. Cost of quality is also an important communication tool. Philip Crosby demonstrated what a powerful tool it could be to raise awareness of the importance of quality. He referred to the measure as the “price of non-conformance” and argued that organizations choose to pay for poor quality. Many organizations will have true quality-related costs as high as 15 to 20 percent of sales revenue, some going as high as 40 percent of total operations. A general rule of thumb is that costs of poor quality in a thriving company will be about 10 to 15 percent of operations. Effective quality improvement programs can reduce this substantially, thus making a direct contribution to profits. The quality cost system, once established, should become dynamic and have a positive impact on the achievement of the organization’s mission, goals, and objectives.
  • 97.
    Statistical quality control(SQC) The application of statistical techniques to measure and evaluate the quality of a product, service, or process. Two basic categories: I. Statistical process control (SPC): - the application of statistical techniques to determine whether a process is functioning as desired II. Acceptance Sampling: - the application of statistical techniques to determine whether a population of items should be accepted or rejected based on inspection of a sample of those items. Quality Measurement: Attributes vs Variables Attributes: Characteristics that are measured as either "acceptable" or "not acceptable", thus have only discrete, binary, or integer values. Variables: Characteristics that are measured on a continuous scale.
  • 98.
    Statistical Process Control(SPC) Methods Statistical process control (SPC) monitors specified quality characteristics of a product or service so as: To detect whether the process has changed in a way that will affect product quality and To measure the current quality of products or services. Control is maintained through the use of control charts. The charts have upper and lower control limits and the process is in control if sample measurements are between the limits. Control Charts for Attributes P Charts - measures proportion defective. C Charts - measures the number of defects/unit. Control Charts for Variables X bar and R charts are used together - control a process by ensuring that the sample average and range remain within limits for both. Basic Procedure 1. An upper control limit (UCL) and a lower control limit (LCL) are set for the process. 2. A random sample of the product or service is taken, and the specified quality characteristic is measured. 3. If the average of the sample of the quality characteristic is higher than the upper control limit or lower than the lower control limit, the process is considered to be "out of control". Control Charts for Attributes p-Charts for Proportion Defective p-chart: a statistical control chart that plots movement in the sample proportion defective (p) over time Procedure: 1. take a random sample and inspect each item 2. determine the sample proportion defective by dividing the number of defective items by the sample size 3. plot the sample proportion defective on the control chart and compare with UCL and LCL to determine if process is out of control The underlying statistical sampling distribution is the binomial distribution, but can be approximated by the normal distribution with: mean = u = np (Note - add the bars above the means used in all the equations in this section) standard deviation of p: sigmap = square root of (p(1 -p ) / n) where p = historical population proportion defective and n = sample size Control Limits: UCL = u + z sigmap LCL = u - z sigma p z is the number of standard deviations from the mean. It is set based how certain you wish to be that when a limit is exceeded it is due to a change in the process proportion defective rather than due to sample variability. For example: If z = 1 if p has not changed you will still exceed the limits in 32% of the samples (68% confident that
  • 99.
    mean has changedif the limits are exceeded. z = 2 - limits will be exceeded in 4.5 (95.5 % confidence that mean has changed) z = 3 - limits will be exceeded in .03 (99.7% confidence) c-Charts for Number of Defects Per Unit c-chart: a statistical control chart that plots movement in the number of defects per unit. Procedure: 1. randomly select one item and count the number of defects in that item 2. plot the number of defects on a control chart 3. compare with UCLand LCLto determine if process is out of control The underlying sampling distribution is the Poisson distribution, but can be approximated by the normal distribution with: mean = c standard deviation = square root of c where c is the historical average number of defects/unit Control Limits: UCL = c + z c LCL = c - z c Control Charts for Variables Two charts are used together: R-chart ("range chart") and X barchart ("average chart") Both the process variability (measured by the R-chart) and the process average (measured by the X bar chart) must be in control before the process can be said to be in control. Process variability must be in control before the X bar chart can be developed because a measure of process variability is required to determine the -chart control limits. R-Chart for Process Variability: UCLR = D4(R) LCLR = D3(R) where is the average of past R values, and D3 and D4 are constants based on the sample size Chart for Process Average: UCLR = X bar + A2(R) LCL = X bar - A2(R) where X bar is the average of several past values, and A2 is a constant based on the sample size Other Types of Attribute-Sampling Plans Double-Sampling Plan: Specifies two sample sizes (n1 and n2) and two acceptance levels (c1 and c2) 1. if the first sample passes (actual defects c1), the lot is accepted 2. if the first sample fails and actual defects > c2, the lot is rejected 3. if first sample fails but c1 < actual defects c2, the second sample is taken and judged on the combined number of defectives found.
  • 100.
    Acceptance Sampling Goal: Toaccept or reject a batch of items. Frequently used to test incoming materials from suppliers or other parts of the organization prior to entry into the production process. Used to determine whether to accept or reject a batch of products. Measures number of defects in a sample. Based on the number of defects in the sample the batch is either accepted or rejected. An acceptance level c is specified. If the number of defects in the sample is c the sample is accepted, otherwise it is rejected and subjected to 100% inspection. Acceptance sampling is a major component of quality control and is useful when the cost of testing is high compared to the cost of passing a defective item or when testing is destructive. It is a compromise between doing 100% inspection and no inspection at all. Acceptance sampling can be done on attributes or measurements of the product. You can use acceptance sampling to develop inspection plans that enable you to accept or reject a particular lot of incoming material based on the data from a representative sample.
  • 101.
    Example of anattribute acceptance sampling plan For example, you receive a shipment of 10,000 microchips. You either cannot or do not want to inspect the entire shipment. An attribute sampling plan can help you determine how many microchips you need to examine (sample size) and how many defects are allowed in that sample (acceptance number). In this case, suppose your acceptable quality level (AQL) is 1.5% and the rejectable quality level (RQL) is 5.0%, and you assume alpha = 0.05 and beta = 0.1. Minitab generates a sampling plan that indicates that you need to inspect 206 chips. If 6 or less of the 206 inspected microchips are defective, you can accept the entire shipment. If 7 or more chips are defective, you must reject the entire shipment. Example of a variables acceptance sampling plan For example, you receive shipments of 2500 plastic pipe segments each week and you need to verify that the wall thickness measurements meet specifications. You either cannot or do not want to inspect the entire shipment. A variables sampling plan can help you determine how many pipes you need to measure (sample size) and the criteria for accepting or rejecting an entire lot (critical distance). In this case, the lower specification for the wall thickness of the piping is 0.09". You and the supplier agree that the acceptable quality level (AQL) is 100 defectives per million and the rejectable quality level (RQL) is 300 defectives per million, and you assume alpha = 0.05 and beta = 0.1. Minitab generates a sampling plan that indicates that you need to measure 104 pipes and indicates that the critical distance is 3.5570. You can use the accept/reject tool in Minitab to indicate whether a shipment should be accepted or rejected.
  • 102.
    Types of maintenance Traditionally,5 types of maintenance have been distinguished, which are differentiated by the nature of the tasks that they include:
  • 103.
    Corrective maintenance The setof tasks is destined to correct the defects to be found in the different equipment and that are communicated to the maintenance department by users of the same equipment.
  • 104.
    Preventive Maintenance Its missionis to maintain a level of certain service on equipment, programming the interventions of their vulnerabilities in the most opportune time. It is used to be a systematic character, that is, the equipment is inspected even if it has not given any symptoms of having a problem.
  • 105.
    Predictive Maintenance It pursuesconstantly know and report the status and operational capacity of the installations by knowing the values of certain variables, which represent such state and operational ability. To apply this maintenance, it is necessary to identify physical variables (temperature, vibration, power consumption, etc.). Which variation is indicative of problems that may be appearing on the equipment. This maintenance it is the most technical, since it requires advanced technical resources, and at times of strong mathematical, physical and / or technical knowledge.
  • 106.
    Zero Hours Maintenance(Overhaul) The set of tasks whose goal is to review the equipment at scheduled intervals before appearing any failure, either when the reliability of the equipment has decreased considerably so it is risky to make forecasts of production capacity. This review is based on leaving the equipment to zero hours of operation, that is, as if the equipment were new. These reviews will replace or repair all items subject to wear. The aim is to ensure, with high probability, a good working time fixed in advance.
  • 107.
    Periodic maintenance (TimeBased Maintenance TBM) The basic maintenance of equipment made by the users of it. It consists of a series of elementary tasks (data collections, visual inspections, cleaning, lubrication, retightening screws) for which no extensive training is necessary, but perhaps only a brief training. This type of maintenance is the based on TPM (Total Productive Maintenance).
  • 108.
    Operational Management inservice Though the primary function of both manufacturers and service providers is to satisfy customer needs, there are several important differences between the two types of operations. Let’s focus on three of them: • Intangibility. Manufacturers produce tangible products—things that can be touched or handled, such as automobiles and appliances. Service companies provide intangible products, such as banking, entertainment, or education. • Customization. Manufactured goods are generally standardized; one twelve-ounce bottle of Pepsi is the same as any other twelve-ounce bottle of Pepsi. Services, by contrast, are often customized to satisfy the specific needs of a customer. When you go to the barber or the hairdresser, you ask for a haircut that looks good on you because of the shape of your face and the texture of your hair. When you go to the dentist, you ask him or her to fill or pull the tooth that’s bothering you. • Customer contact. You could spend your entire working life assembling cars in Detroit and never meet a customer who bought a car that you helped to make. But if you were a waitress, you’d interact with customers every day. In fact, their satisfaction with your product would be determined in part by the service that you provided. Unlike manufactured goods, many services are bought and consumed at the same time.
  • 109.
    Operations Planning When startingor expanding operations, businesses in the service sector must make a number of decisions quite similar to those made by manufacturers: • What services (and perhaps what goods) should they offer? • How will they provide these services? • Where will they locate their business, and what will their facilities look like? • How will they forecast demand for their services?
  • 110.
    Operations Processes Service organizationssucceed by providing services that satisfy customers’ needs. Companies that provide transportation, such as airlines, have to get customers to their destinations as quickly and safely as possible. Companies that deliver packages, such as FedEx, must pick up, sort, and deliver packages in a timely manner. Colleges must provide quality educations. Companies that provide both services and goods, such as Domino’s Pizza, have a dual challenge: they must produce a quality good and deliver it satisfactorily. Service providers that produce goods can, like manufacturers, adopt either a make-to-order or a make-to-stock approach to manufacturing them. BK, which encourages patrons to customize burgers and other menu items, uses a make-to-order approach. BK can customize products because it builds sandwiches one at a time rather than batch-process them. Meat patties, for example, go from the grill to a steamer for holding until an order comes in. Then the patty is pulled from the steamer and requested condiments are added. Finally, the completed sandwich chutes to a counter worker, who gives it to the customer. In contrast, many of BK’s competitors, including McDonald’s, rely on a make-to-stock approach in which a number of sandwiches are made at the same time with the same condiments. If a customer wants, say, a hamburger without onions, he or she has to wait for a new batch of patties to be grilled. The procedure could take up to five minutes, whereas BK can process a special order in thirty seconds.
  • 111.
    Facilities When starting orexpanding a service business, owners and managers must invest a lot of time in selecting a location, determining its size and layout, and forecasting demand. A poor location or a badly designed facility can cost customers, and inaccurate estimates of demand for products can result in poor service, excessive costs, or both.
  • 112.
    Site Selection People inthe real estate industry often say that the three most important factors to consider when you’re buying a home are location, location, location. The same principle applies when you’re trying to locate a service business. To be successful in a service industry, you need to be accessible to your customers. Some service businesses, such as cable-TV providers, package-delivery services, and e- retailers, go to their customers. Many others, however—hotels, restaurants, stores, hospitals, and airports—have to attract customers to their facilities. These businesses must locate where there’s a high volume of available customers.
  • 113.
    Size and Layout Becausemanufacturers do business out of plants rarely visited by customers, they base the size and layout of their facilities solely on production needs. In the service sector, however, most businesses must design their facilities with the customer in mind: they must accommodate the needs of their customers while keeping costs as low as possible. Performing this twofold task isn’t easy.
  • 114.
    Capacity Planning Estimating capacityneeds for a service business isn’t the same thing as estimating those of a manufacturer. A manufacturer can predict overall demand, produce the product, store it in inventory, and ship it to a customer when it’s ordered. Service providers, however, can’t store their products for later use: hairdressers can’t “inventory” haircuts, hospitals can’t “inventory” operations, and amusement parks can’t “inventory” roller-coaster rides. Service firms have to build sufficient capacity to satisfy customers’ needs on an “as-demanded” basis. Like manufacturers, service providers must consider many variables when estimating demand and capacity: • How many customers will I have? • When will they want my services (which days of the week, which times of the day)? • How long will it take to serve each customer? • How will external factors, such as weather or holidays, affect the demand for my services?
  • 115.
    Managing Operations Overseeing aservice organization puts special demands on managers, especially those running firms, such as hotels, retail stores, and restaurants, that have a high degree of contact with customers. Service firms provide customers with personal attention and must satisfy their needs in a timely manner. This task is complicated by the fact that demand can vary greatly over the course of any given day. Managers, therefore, must pay particular attention to employee work schedules and (in some cases) inventory management.
  • 116.
    Scheduling In manufacturing, managersfocus on scheduling the activities needed to transform raw materials into finished goods. In service organizations, they focus on scheduling workers so that they’re available to handle fluctuating customer demand. Each week, therefore, every BK store manager schedules employees to cover not only the peak periods of breakfast, lunch, and dinner, but also the slower periods in between. If he or she staffs too many people, labor cost per sales dollar will be too high. If there aren’t enough employees, customers have to wait in lines. Some get discouraged, and even leave, and many may never come back.
  • 117.
    Inventory Control Businesses thatprovide both goods and services, such as retail stores and auto-repair shops, have the same inventory-control problems as manufacturers: keeping levels too high costs money, while running out of inventory costs sales. System tracks everything sold during a given time and lets each store manager know how much of everything should be kept in inventory. It also makes it possible to count the number of burgers and buns, bags and racks of fries, and boxes of beverage mixes at the beginning or end of each shift. Because there are fixed numbers of supplies—say, beef patties or bags of fries—in each box, employees simply count boxes and multiply. In just a few minutes, the manager knows whether the inventory is correct (and should be able to see if any theft has occurred on the shift).
  • 118.
    Contemporary issues inProduction Management Computer-Aided Design That’s when Montgomery turned to computer technology for help and began using a computer-aided design (CAD) software package to design not only the engine but also the board itself and many of its components. The CAD program enabled Montgomery and his team of engineers to test the product digitally and work out design problems before moving to the prototype stage. The sophisticated CAD software allowed Montgomery and his team to put their design paper in a drawer and to start building both the board and the engine on a computer screen. By rotating the image on the screen, they could even view the design from every angle. Having used their CAD program to make more than four hundred design changes, they were ready to test the Jetboard in the water. During the tests, onboard sensors transmitted data to portable computers, allowing the team to make adjustments from the shore while the prototype was still in the water. Nowadays, PowerSki uses collaboration software to transmit design changes to the suppliers of the 340 components that make up the Jetboard.
  • 119.
    Computer-Aided Manufacturing For manycompanies, the next step is to link CAD to the manufacturing process. A computer-aided manufacturing (CAM) software system determines the steps needed to produce the component and instructs the machines that do the work. Because CAD and CAM programs can “talk” with each other, companies can build components that satisfy exactly the requirements set by the computer-generated model. CAD/CAM systems permit companies to design and manufacture goods faster, more efficiently, and at a lower cost, and they’re also effective in helping firms monitor and improve quality. CAD/CAM technology is used in many industries, including the auto industry, electronics, and clothing.
  • 120.
    Computer-Integrated Manufacturing By automatingand integrating all aspects of a company’s operations, computer-integrated manufacturing (CIM) systems have taken the integration of computer-aided design and manufacturing to a higher level—and are in fact revolutionizing the production process. CIM systems expand the capabilities of CAD/CAM. In addition to design and production applications, they handle such functions as order entry, inventory control, warehousing, and shipping. In the manufacturing plant, the CIM system controls the functions of industrial robots—computer-controlled machines used to perform repetitive tasks that are also hard or dangerous for human workers to perform.
  • 121.
    Flexible Manufacturing Systems Finally,a CIM system is a common element in flexible manufacturing systems (FMS), in which computer-controlled equipment can easily be adapted to produce a variety of goods. An FMS has immense advantages over traditional production lines in which machines are set up to produce only one type of good. When the firm needs to switch a production line to manufacture a new product, substantial time and money are often spent in modifying equipment. An FMS makes it possible to change equipment setups merely by reprogramming computer-controlled machines. Such flexibility is particularly valuable to companies that produce customized products. Operations management is the process in which resources/inputs are converted into more useful products. In the light of global competition many recent trends in operations management have evolved that have impact on manufacturing firms.
  • 122.
    Some other ContemporaryIssues are: 1. Flexibility: The ability to adapt quickly to changes in volumes of demand, in the product mix demanded, and in product design or delivery schedules, has become a major competitive strategy and a competitive advantage to the firms. This is sometimes called as agile manufacturing. 2. Total Quality Management: TQM approach has been adopted by many firms to achieve customer satisfaction by a never ending quest for improving the quality of goods and services. 3. Time Reduction: Reduction of manufacturing cycle time and speed to marker for a new product provide a competitive edge to a firm over other firms. When companies can provide products at the same price and quality, quicker delivery (short lead time) provide one firm competitive edge over the other. 4. Worker Involvement: The recent trends are to assign responsibility for decision making and problem solving to the lower levels in the organization. This is known as employee involvement and empowerment. Examples of employee’s empowerment are quality circle and use of work teams or quality improvement teams. 5. Business Process Re-engineering: BPR involves drastic measures or break-through improvements to improve the performance of a firm. It involves the concept of clean-state approach or starting from a scratch in redesigning in business processes. 6. Global Market Place: Globalization of business has compelled many manufacturing firms to give operations in many countries where they have certain economic advantage. This has resulted in a steep increase in the level of competition among manufacturing firms throughout the world. 7. Operations Strategy: More and more firms are recognizing the importance of operations strategy for the overall success of their business and the necessity for relating it to their overall business strategy. 8. Lean production: Production system have become lean production systems which have minimal amount of resources to produce a high volume of high quality goods with some variety. These systems use flexible manufacturing systems and multi-skilled workforce to have advantages of both mass production and job production. 9. Just in time production: JIT is a ‘pull’ system of production, so actual orders provide a signal for when a product should be manufactured. Demand-pull enables a firm to produce only what is required, in the correct quantity and at the correct time. This means that stock levels of raw materials, components, work in progress and finished goods can be kept to a minimum. This requires a carefully planned scheduling and flow of resources through the production process. For example, a car manufacturing plant might receive exactly the right number and type of tyres for one day’s production, and the supplier would be expected to deliver them to the correct loading bay on the production line within a very narrow time slot. 10. E-Supply Chain Management: Supply chain management is the management of supply chain from suppliers to final customers reduces the cost of transportation, warehousing and distribution throughout the supply chain. But SCM was a traditional concept which is now being replaced by E- SCM. E-Supply chain management is a series of Internet enabled value-adding activities to guarantee products created by a manufacturing process can eventually meet customer requirements and realize returns on investment. Supply chains have advanced in the last two decades with improved efficiency, agility and accuracy. The recent advancement of Internet technology has brought more powerful support to improving supply chain performance. In this context, e-supply chain management becomes
  • 123.
    a new termthat distinguishes itself by net-centric and real-time features from traditional supply chain management. 11. Enterprise Resource Planning: Enterprise resource planning (ERP) is an enterprise-wide information system designed to coordinate all the resources, information, and activities needed to complete business processes such as order fulfilment or billing. 12. Environmental Issues: Today’s production managers are concerned more and more with pollution control and waste disposal which are key issues in protection of environment and social responsibility. There is increasing emphasis on reducing waste, recycling waste, using less-toxic chemicals and using biodegradable materials for packaging.