
Downloaded 14 times
![Recently studied demand-led examples
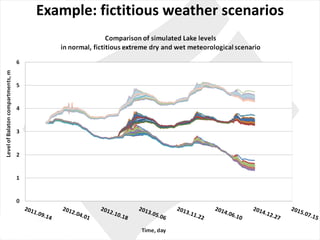
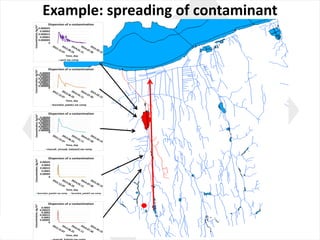
• Complex environmental
process system:
management of a sensitive
watershed [1, 2]
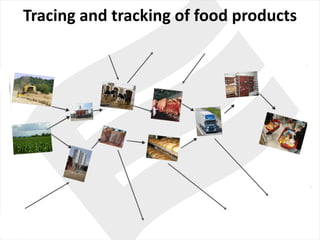
• Trans-sectorial agrifood
process system: quantitative
tracing and tracking
• Process design:
Recirculating Aquaculture
Systems
• Process operation:
scheduling of a multi-
product dairy plant](https://image.slidesharecdn.com/vmv5monikavarga-161215152217/85/Process-model-based-decision-support-for-multi-stakeholder-water-food-energy-ecosystem-network-10-320.jpg)
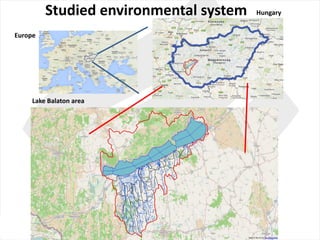
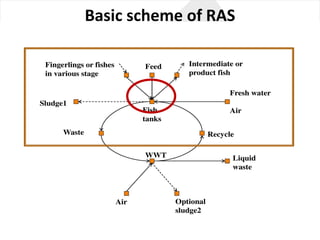
![Recently studied demand-led examples
• Complex environmental
process system: management
of a sensitive watershed
• Trans-sectorial agrifood
process system: quantitative
tracing and tracking [2, 3, 4,
10]
• Process design: Recirculating
Aquaculture Systems
• Process operation: scheduling
of a multi-product dairy plant](https://image.slidesharecdn.com/vmv5monikavarga-161215152217/85/Process-model-based-decision-support-for-multi-stakeholder-water-food-energy-ecosystem-network-17-320.jpg)

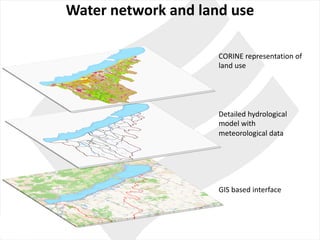
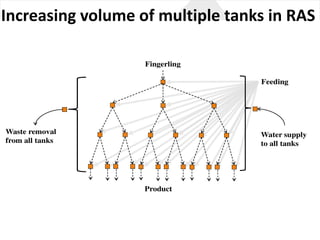
![Recently studied demand-led examples
• Complex environmental
process system:
management of a sensitive
watershed
• Trans-sectorial agrifood
process system: quantitative
tracing and tracking
• Process design:
Recirculating Aquaculture
Systems [5, 6, 8]
• Process operation:
scheduling of a multi-
product dairy plant](https://image.slidesharecdn.com/vmv5monikavarga-161215152217/85/Process-model-based-decision-support-for-multi-stakeholder-water-food-energy-ecosystem-network-24-320.jpg)
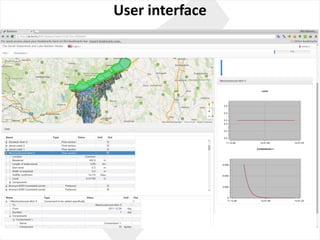
![Recently studied demand-led examples
• Complex environmental
process system:
management of a sensitive
watershed
• Trans-sectorial agrifood
process system: quantitative
tracing and tracking
• Process design:
Recirculating Aquaculture
Systems
• Process operation:
scheduling of a multi-
product dairy plant [7, 9]](https://image.slidesharecdn.com/vmv5monikavarga-161215152217/85/Process-model-based-decision-support-for-multi-stakeholder-water-food-energy-ecosystem-network-33-320.jpg)


The document discusses the integration of water, food, energy, and ecosystem networks through process model-based decision support to harmonize local interests with global sustainability. It emphasizes the use of quantitative decision support methods in process systems engineering to address challenges posed by climate change and infrastructure complexity, highlighting collaborative efforts with various institutions. The approach aims to utilize modeling, simulation, and big data to enhance decision-making and promote sustainable practices across different sectors.


