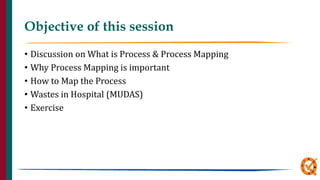
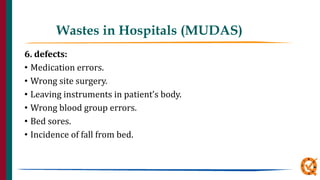
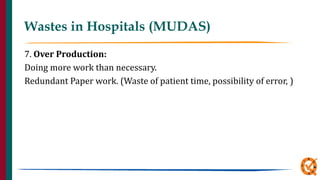
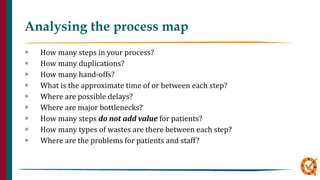
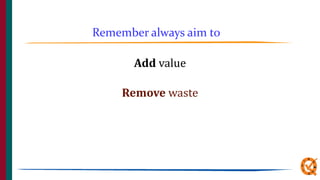
Download to read offline

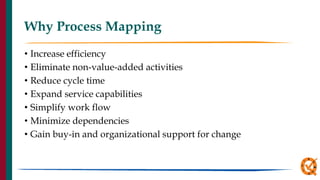
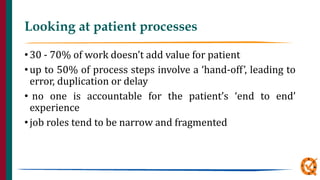
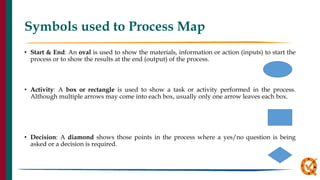
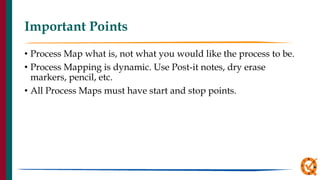
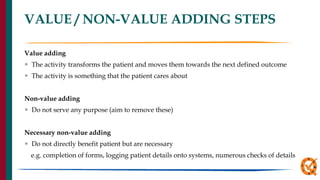
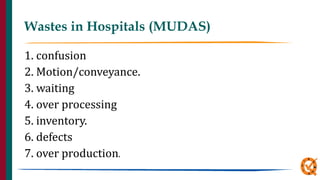


This document discusses process mapping. It defines a process as a series of interrelated activities that transforms inputs into outputs. Process mapping creates a visual representation of the steps in a process. Process mapping is important for understanding a process, identifying problems and opportunities for improvement, and gaining support for changes. Common symbols used in process mapping are also described, such as boxes for activities and diamonds for decisions. The document discusses identifying value-adding versus non-value adding activities and different types of waste, called MUDAs, that can occur in hospital processes. An exercise is provided to have participants map an example process.


