Process instrumentation subject related to Engineering
1.
1. Data AcquisitionSystem (DAS)
Definition
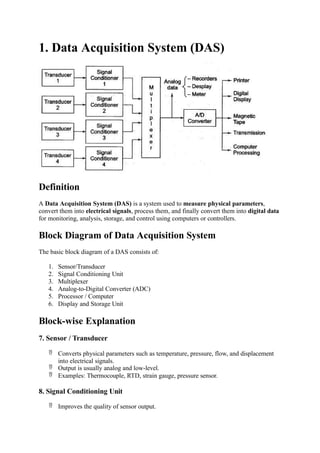
A Data Acquisition System (DAS) is a system used to measure physical parameters,
convert them into electrical signals, process them, and finally convert them into digital data
for monitoring, analysis, storage, and control using computers or controllers.
Block Diagram of Data Acquisition System
The basic block diagram of a DAS consists of:
1. Sensor/Transducer
2. Signal Conditioning Unit
3. Multiplexer
4. Analog-to-Digital Converter (ADC)
5. Processor / Computer
6. Display and Storage Unit
Block-wise Explanation
7. Sensor / Transducer
Converts physical parameters such as temperature, pressure, flow, and displacement
into electrical signals.
Output is usually analog and low-level.
Examples: Thermocouple, RTD, strain gauge, pressure sensor.
8. Signal Conditioning Unit
Improves the quality of sensor output.
2.
Performs:
o Amplification
oFiltering (noise removal)
o Isolation
o Linearization
Ensures compatibility with ADC input.
3. Multiplexer
Selects one input signal at a time from multiple sensors.
Reduces hardware cost by using a single ADC.
Operates under control of the processor.
4. Analog-to-Digital Converter (ADC)
Converts conditioned analog signal into digital form.
Key parameters:
o Resolution
o Sampling rate
o Accuracy
Acts as the heart of digital DAS.
5. Processor / Computer
Controls the entire DAS operation.
Performs data processing, computation, and decision-making.
Interfaces with control systems if required.
6. Display and Storage Unit
Displays data in numerical or graphical form.
Stores data for future analysis and reporting.
Applications of DAS
Industrial process monitoring
Environmental data logging
Biomedical instrumentation
Automotive testing
Research laboratories
A Data Acquisition System provides accurate, fast, and automated data collection,
forming the backbone of modern measurement and control systems.
2. Intelligent Instruments
3.
Definition
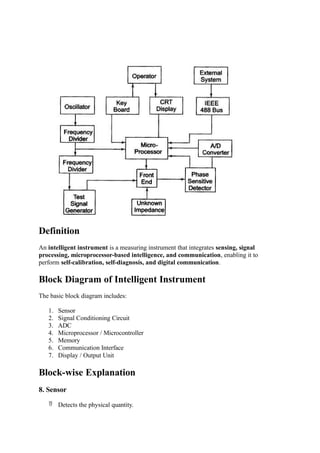
An intelligent instrumentis a measuring instrument that integrates sensing, signal
processing, microprocessor-based intelligence, and communication, enabling it to
perform self-calibration, self-diagnosis, and digital communication.
Block Diagram of Intelligent Instrument
The basic block diagram includes:
1. Sensor
2. Signal Conditioning Circuit
3. ADC
4. Microprocessor / Microcontroller
5. Memory
6. Communication Interface
7. Display / Output Unit
Block-wise Explanation
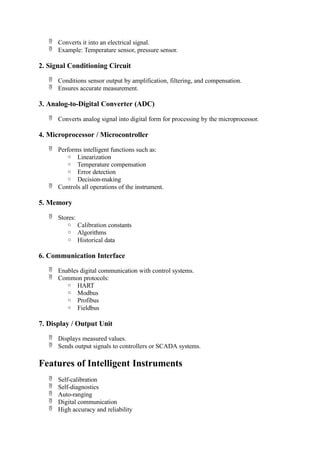
8. Sensor
Detects the physical quantity.
4.
Converts itinto an electrical signal.
Example: Temperature sensor, pressure sensor.
2. Signal Conditioning Circuit
Conditions sensor output by amplification, filtering, and compensation.
Ensures accurate measurement.
3. Analog-to-Digital Converter (ADC)
Converts analog signal into digital form for processing by the microprocessor.
4. Microprocessor / Microcontroller
Performs intelligent functions such as:
o Linearization
o Temperature compensation
o Error detection
o Decision-making
Controls all operations of the instrument.
5. Memory
Stores:
o Calibration constants
o Algorithms
o Historical data
6. Communication Interface
Enables digital communication with control systems.
Common protocols:
o HART
o Modbus
o Profibus
o Fieldbus
7. Display / Output Unit
Displays measured values.
Sends output signals to controllers or SCADA systems.
Features of Intelligent Instruments
Self-calibration
Self-diagnostics
Auto-ranging
Digital communication
High accuracy and reliability
5.
Applications
Industrial automation
Smart sensors and transmitters
Process control systems
Biomedical equipment
Energy management systems
Intelligent instruments enhance traditional measurement systems by integrating processing
power and communication, making them essential for modern automation and smart
industries.
Analog-to-Digital Conversion (ADC)
(10–15 Marks Answer)
Definition
Analog-to-Digital Conversion (ADC)is the process of converting a continuous-time,
continuous-amplitude analog signal into a discrete-time, discrete-amplitude digital
signal that can be processed by digital systems such as computers, microcontrollers, and
digital controllers.
Need for ADC
Real-world signals are analog
Digital systems work only with binary data
ADC enables:
o Data acquisition
o Digital signal processing
o Storage and transmission
o Automation and control
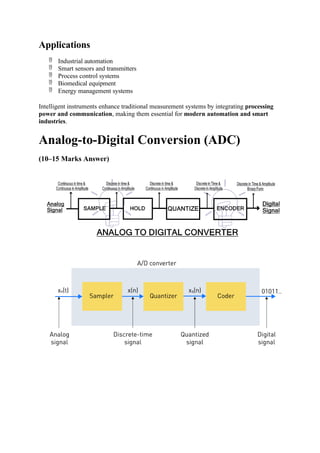
Basic Block Diagram of ADC
An ADC system consists of the following blocks:
1. Anti-aliasing Filter
2. Sample and Hold Circuit
3. Quantizer
4. Encoder
Block-wise Explanation
5. Anti-Aliasing Filter
A low-pass filter placed before ADC
Removes high-frequency noise
Prevents aliasing during sampling
6. Sample and Hold (S/H) Circuit
Samples the analog signal at regular intervals
Holds the sampled value constant during conversion
Ensures accurate quantization
7. Quantizer
Divides the analog amplitude into discrete levels
Each level represents a digital value
Introduces quantization error
8. Encoder
8.
Converts quantizedlevels into binary code
Output is a digital word (e.g., 8-bit, 12-bit)
Steps in Analog-to-Digital Conversion
1. Sampling
Conversion of continuous-time signal into discrete-time signal
Sampling frequency must satisfy Nyquist criterion:
2. Quantization
Assigns sampled values to nearest discrete levels
Resolution depends on number of bits
3. Encoding
Converts quantized levels into binary numbers
Output is suitable for digital processing
Important ADC Parameters
4. Resolution
Smallest change in input that can be detected
Higher resolution → higher accuracy
5. Accuracy
Closeness of digital output to true analog value
6. Conversion Time
Time required to convert analog signal into digital form
7. Sampling Rate
Number of samples per second
8. Quantization Error
Difference between actual analog value and quantized value
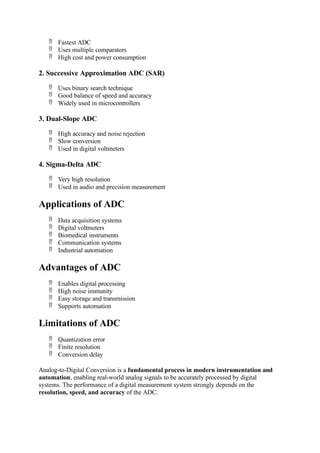
Types of Analog-to-Digital Converters
1. Flash ADC
9.
Fastest ADC
Uses multiple comparators
High cost and power consumption
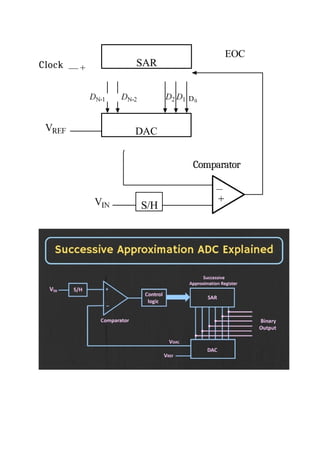
2. Successive Approximation ADC (SAR)
Uses binary search technique
Good balance of speed and accuracy
Widely used in microcontrollers
3. Dual-Slope ADC
High accuracy and noise rejection
Slow conversion
Used in digital voltmeters
4. Sigma-Delta ADC
Very high resolution
Used in audio and precision measurement
Applications of ADC
Data acquisition systems
Digital voltmeters
Biomedical instruments
Communication systems
Industrial automation
Advantages of ADC
Enables digital processing
High noise immunity
Easy storage and transmission
Supports automation
Limitations of ADC
Quantization error
Finite resolution
Conversion delay
Analog-to-Digital Conversion is a fundamental process in modern instrumentation and
automation, enabling real-world analog signals to be accurately processed by digital
systems. The performance of a digital measurement system strongly depends on the
resolution, speed, and accuracy of the ADC.
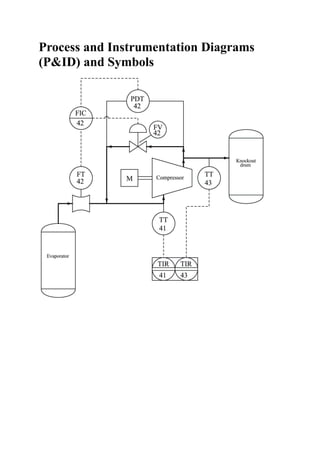
1.Definition of Processand Instrumentation
Diagram (P&ID)
A Process and Instrumentation Diagram (P&ID) is a detailed graphical representation
of a process plant that shows process equipment, piping, instruments, control loops, and
safety devices using standardized symbols.
It provides complete information required for design, operation, control, maintenance, and
safety analysis of a process plant.
2. Importance of P&ID
P&IDs are essential because they:
13.
Show theentire process flow and control philosophy
Help in plant design, installation, and commissioning
Serve as a reference for operation and maintenance
Are used for HAZOP and safety studies
Act as a communication tool between engineers, operators, and technicians
3. Difference between PFD and P&ID
Aspect PFD P&ID
Detail level Basic Highly detailed
Instrumentation Minimal Complete
Piping details Limited Complete
Control loops Not shown Fully shown
Use Process understanding Design & operation
4. Main Elements of a P&ID
A typical P&ID includes:
1. Process equipment
2. Piping and valves
3. Instrumentation symbols
4. Control loops
5. Utility lines
6. Safety devices
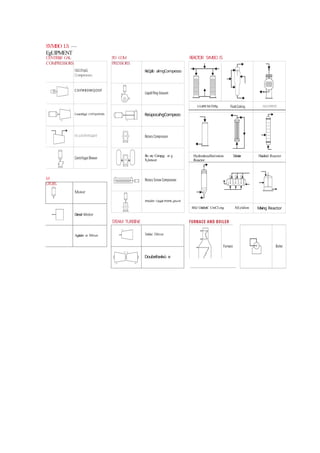
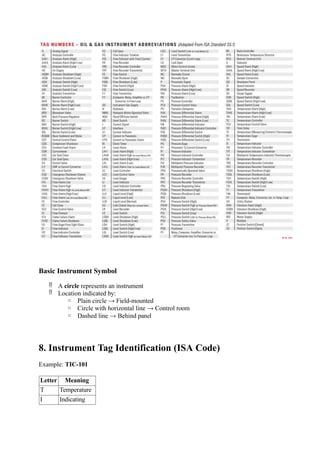
5. Equipment Symbols Used in P&ID
14.
Motor
Diesel Molor
Agitalor orMixer
C
e
l
i
f
v
g
a
l
Compesso
C0íf#80WQD0f
CentriflJgal C0lTlpr9SS0r
Ó1idIÚ0TÇQS0
Turbine Dïiver
Doubefowlvü e
R
e
G
p
f
o almgCompesso
ReüpocahgCompezo
R
o ory Compçg or g
S¡lencer
P0SitÍ¥9 ÜjSgldCPlTlPflt gl0w9f
I-l}df0CfüCÈlflIg h0l0f€0f
Hydrodesulfuri/ation Tubular
Reactor
Fluidi/ed Reactor
fllJid CütülytiC CrüCLing AlLylalion Mixing Reactor
SYMBO LS —
EgUIPMENT
CENTRIíIJ G
A
L
COMPRESSORS
PD C
O
M
PRESSORS
M
O
T
ORS
STEAM TURBINE
R
E
A
CT
O
R SYM
BO íS
15.
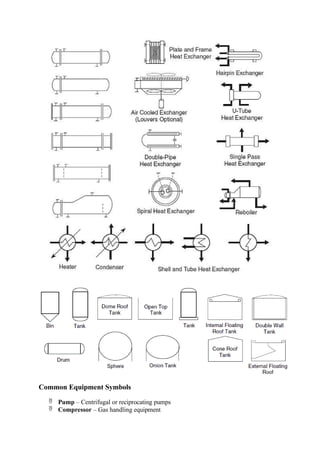
Common Equipment Symbols
Pump – Centrifugal or reciprocating pumps
Compressor – Gas handling equipment
16.
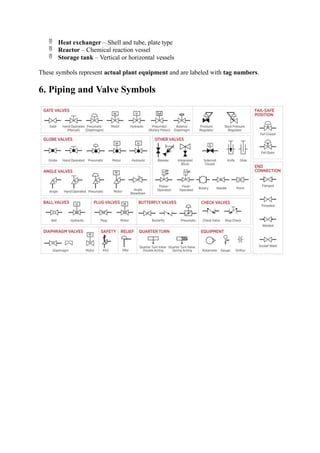
Heat exchanger– Shell and tube, plate type
Reactor – Chemical reaction vessel
Storage tank – Vertical or horizontal vessels
These symbols represent actual plant equipment and are labeled with tag numbers.
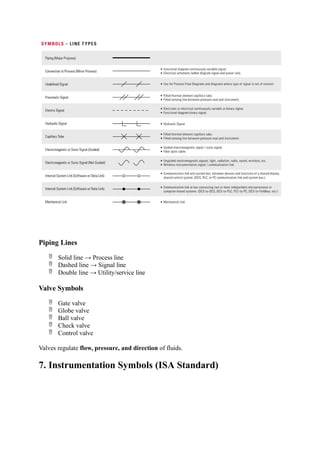
6. Piping and Valve Symbols
17.
Piping Lines
Solidline → Process line
Dashed line → Signal line
Double line → Utility/service line
Valve Symbols
Gate valve
Globe valve
Ball valve
Check valve
Control valve
Valves regulate flow, pressure, and direction of fluids.
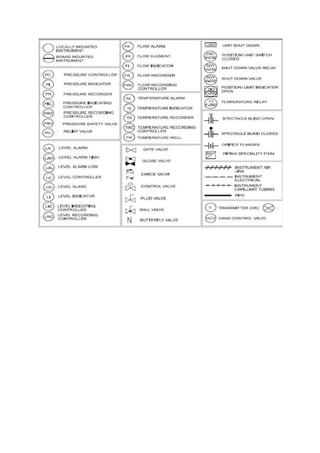
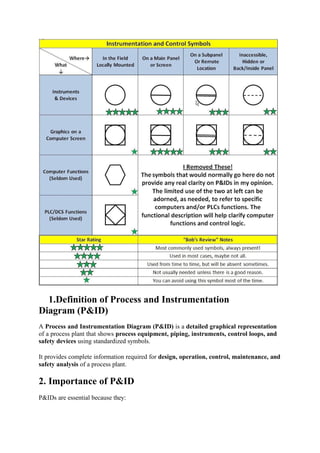
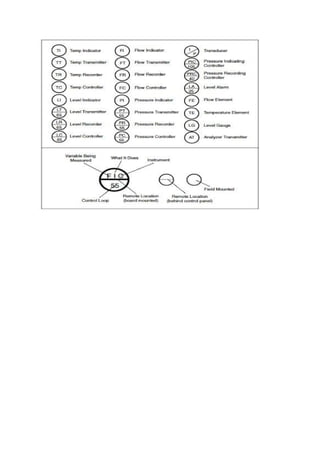
7. Instrumentation Symbols (ISA Standard)
19.
Basic Instrument Symbol
A circle represents an instrument
Location indicated by:
o Plain circle → Field-mounted
o Circle with horizontal line → Control room
o Dashed line → Behind panel
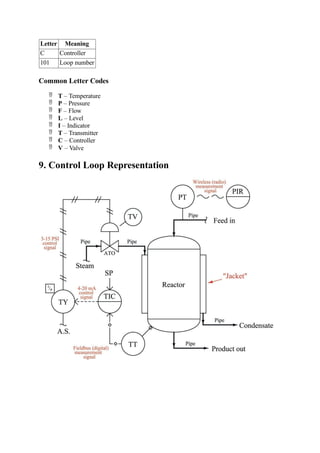
8. Instrument Tag Identification (ISA Code)
Example: TIC-101
Letter Meaning
T Temperature
I Indicating
20.
Letter Meaning
C Controller
101Loop number
Common Letter Codes
T – Temperature
P – Pressure
F – Flow
L – Level
I – Indicator
T – Transmitter
C – Controller
V – Valve
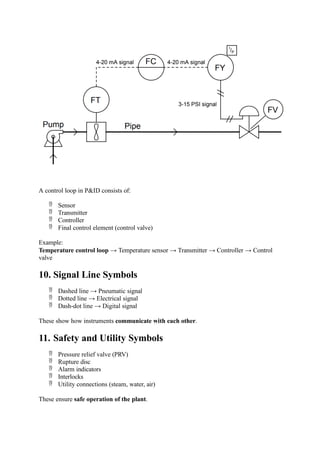
9. Control Loop Representation
21.
A control loopin P&ID consists of:
Sensor
Transmitter
Controller
Final control element (control valve)
Example:
Temperature control loop → Temperature sensor → Transmitter → Controller → Control
valve
10. Signal Line Symbols
Dashed line → Pneumatic signal
Dotted line → Electrical signal
Dash-dot line → Digital signal
These show how instruments communicate with each other.
11. Safety and Utility Symbols
Pressure relief valve (PRV)
Rupture disc
Alarm indicators
Interlocks
Utility connections (steam, water, air)
These ensure safe operation of the plant.
22.
12. Applications ofP&ID
Chemical process industries
Oil and gas plants
Power plants
Food and pharmaceutical industries
Water treatment plants
Process and Instrumentation Diagrams are the most important engineering documents in a
process plant. They provide a complete visual description of process flow, instrumentation,
and control strategy, ensuring efficient operation, safety, and maintenance.
Instrumentation of Process Equipment
(Distillation Column and Heat Exchanger)
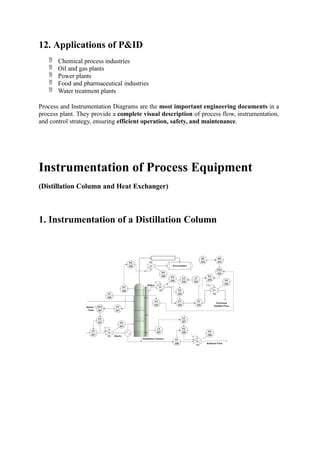
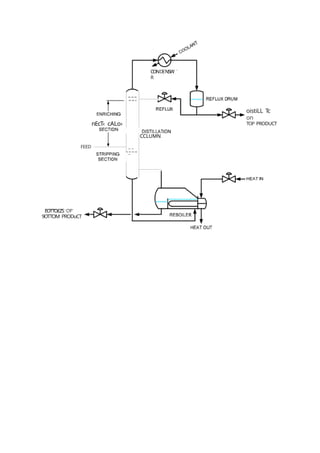
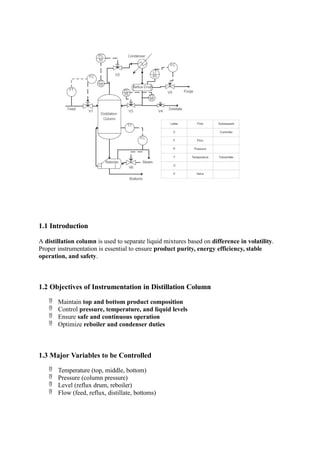
1. Instrumentation of a Distillation Column
1.1 Introduction
A distillationcolumn is used to separate liquid mixtures based on difference in volatility.
Proper instrumentation is essential to ensure product purity, energy efficiency, stable
operation, and safety.
1.2 Objectives of Instrumentation in Distillation Column
Maintain top and bottom product composition
Control pressure, temperature, and liquid levels
Ensure safe and continuous operation
Optimize reboiler and condenser duties
1.3 Major Variables to be Controlled
Temperature (top, middle, bottom)
Pressure (column pressure)
Level (reflux drum, reboiler)
Flow (feed, reflux, distillate, bottoms)
25.
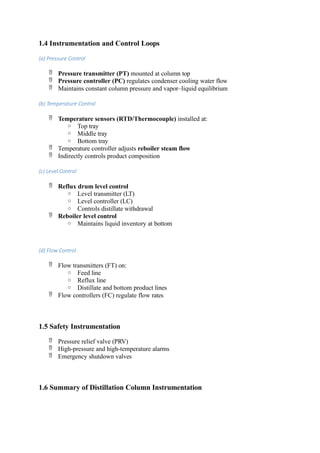
1.4 Instrumentation andControl Loops
(a) Pressure Control
Pressure transmitter (PT) mounted at column top
Pressure controller (PC) regulates condenser cooling water flow
Maintains constant column pressure and vapor–liquid equilibrium
(b) Temperature Control
Temperature sensors (RTD/Thermocouple) installed at:
o Top tray
o Middle tray
o Bottom tray
Temperature controller adjusts reboiler steam flow
Indirectly controls product composition
(c) Level Control
Reflux drum level control
o Level transmitter (LT)
o Level controller (LC)
o Controls distillate withdrawal
Reboiler level control
o Maintains liquid inventory at bottom
(d) Flow Control
Flow transmitters (FT) on:
o Feed line
o Reflux line
o Distillate and bottom product lines
Flow controllers (FC) regulate flow rates
1.5 Safety Instrumentation
Pressure relief valve (PRV)
High-pressure and high-temperature alarms
Emergency shutdown valves
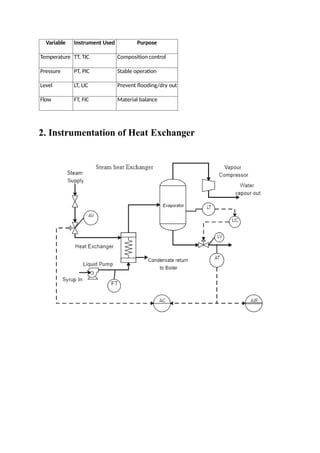
1.6 Summary of Distillation Column Instrumentation
26.
Variable Instrument UsedPurpose
Temperature TT, TIC Composition control
Pressure PT, PIC Stable operation
Level LT, LIC Prevent flooding/dry out
Flow FT, FIC Material balance
2. Instrumentation of Heat Exchanger
27.
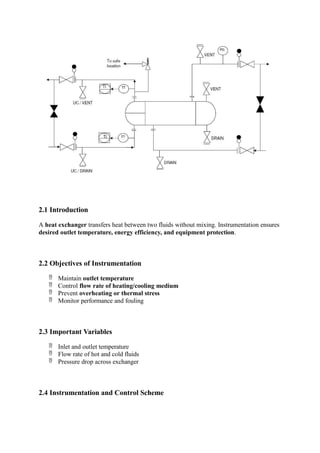
2.1 Introduction
A heatexchanger transfers heat between two fluids without mixing. Instrumentation ensures
desired outlet temperature, energy efficiency, and equipment protection.
2.2 Objectives of Instrumentation
Maintain outlet temperature
Control flow rate of heating/cooling medium
Prevent overheating or thermal stress
Monitor performance and fouling
2.3 Important Variables
Inlet and outlet temperature
Flow rate of hot and cold fluids
Pressure drop across exchanger
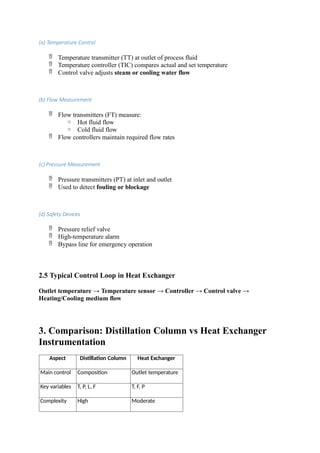
2.4 Instrumentation and Control Scheme
28.
(a) Temperature Control
Temperature transmitter (TT) at outlet of process fluid
Temperature controller (TIC) compares actual and set temperature
Control valve adjusts steam or cooling water flow
(b) Flow Measurement
Flow transmitters (FT) measure:
o Hot fluid flow
o Cold fluid flow
Flow controllers maintain required flow rates
(c) Pressure Measurement
Pressure transmitters (PT) at inlet and outlet
Used to detect fouling or blockage
(d) Safety Devices
Pressure relief valve
High-temperature alarm
Bypass line for emergency operation
2.5 Typical Control Loop in Heat Exchanger
Outlet temperature → Temperature sensor → Controller → Control valve →
Heating/Cooling medium flow
3. Comparison: Distillation Column vs Heat Exchanger
Instrumentation
Aspect Distillation Column Heat Exchanger
Main control Composition Outlet temperature
Key variables T, P, L, F T, F, P
Complexity High Moderate
29.
Aspect Distillation ColumnHeat Exchanger
Energy control Reboiler & condenser Steam/cooling water
4. Importance of Instrumentation
Ensures product quality
Improves energy efficiency
Enhances plant safety
Enables automation and remote monitoring
Instrumentation plays a critical role in the efficient and safe operation of process equipment
such as distillation columns and heat exchangers. Proper measurement and control of
temperature, pressure, level, and flow ensure stable operation, desired output quality, and
economic performance of chemical process plants.