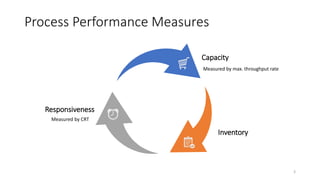
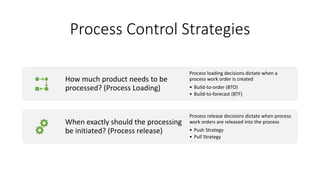
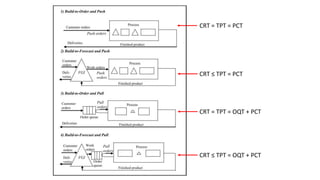
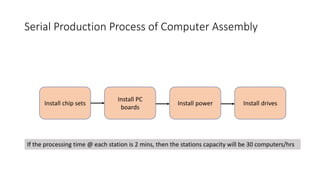
Process Control at Compaq®
Presented by –
• Debarpan Haldar (2207010)
• Dushyant Pratap (2207014)
• Rishabh Singh (2207025)
• Subhashish Das (2207026)
• Sumit Singh (2207027)
“Understanding the Build-to-Order Decision”
Compaq
launched ODM
(Optimised
Distribution
Model) to create
Customer Value
Revolution
Launching New Business Model
Compaq wants to be
here by implementing
JIT & KANBAN
Compaq is currently
here
Push Pull
BTO
BTF
WIP
FGI
Strategy
Process Performance Measures
3
Capacity
Responsiveness
Inventory
Measured by max. throughput rate
Measured by CRT
Inventories
Tactical
Inventories
Pipeline
Inventories
Finished goods
Inventory
Intermediate
Inventory
Raw Material
Inventory
WIP
Transportation
4
Time Measures
5
The time taken from the issuing of
a work order until the completion
of the order
The time a work order waits in the
order queue until it is “released”
to the (production) process
The time taken from the release of an
order into the (production) process
until the delivery of the finished
product (to the customer or to the FGI)
TPT = OQT + PCT
Inter-relation amongst process performance
measures
Increasing inventory will improve responsiveness, but also increase inventory carrying cost
Inventory incurs cost in the form of -
• Opportunity cost of financial capital
• The cost of product obsolescence
• Cost of maintaining warehouse operations
Increasing production capacity can reduce both inventory and response time at the cost of
increasing idleness
Compaq wishes to maximise the resource utilisation of its process, thus no need to increase the
capacity currently
Process Control Strategies
How much product needs to be
processed? (Process Loading)
Process loading decisions dictate when a
process work order is created
• Build-to-order (BTO)
• Build-to-forecast (BTF)
When exactly should the processing
be initiated? (Process release)
Process release decisions dictate when process
work orders are released into the process
• Push Strategy
• Pull Strategy
CRT = TPT = PCT
CRT ≤ TPT = PCT
CRT = TPT = OQT + PCT
CRT ≤ TPT = OQT + PCT
Serial Production Process of Computer Assembly
Install chip sets
Install PC
boards
Install power Install drives
If the processing time @ each station is 2 mins, then the stations capacity will be 30 computers/hrs
WIP Inventory Control
• Push (Unlimited WIP)
• Pull (WIP Inventory Control)
• Zero buffer
• Kanban square
• CONWIP
• Bottleneck starvation
avoidance Kan = Card
Ban = Signal
Kanban – trigger replenishment activity
MIN/MAX System: Visual Reorder Point
MAX
(Maximum Allowable)
MIN
(Minimum  Place
Order)
Safety Stock
Visual Signal
Positive signal
when depleted
Effect of
variability and
Kanban size
on Production
Capacity
(SD/µ)²
Mean Process Cycle Time (PCT) for Push and Pull WIP strategies
Little’s Law:
WIP =
Throughput*PCT
Comparison of BTO & BTF
BTO
• Process work orders are created only in response
to actual customer orders
• BTO strategy do not use FGI
• BTO/Pull strategies limit WIP inventories and
release process work orders only once WIP falls
below a certain level
• BTO-Push: CRT=TPT=PCT
• BTO-Pull: CRT=TPT=OQT+PCT
BTF
• Process work orders are created in anticipation of
customer demand
• BTF strategies use FGI to buffer the process from
demand
• BTF/Push strategies do not attempt to control WIP
inventories
• BTF-Push: CRT<=TPT=PCT
• BTF-Pull: CRT<=TPT=OQT+PCT
Given Data :
 CV²A = 1
 Mean Arrival rate (λ) = 23 computers/hour
 CV²S = 1
 τ = 2 minutes for each station
 Manufacturing Strategy – BTO/Pull
From Queueing theory,
Utilization rate = (23/30) = 0.77 ~ 77%, τi = Mean Service Time = 2 minutes
Wi = 2 x {0.77/(1-0.77)} = 26.5 minutes
E[CRT] = E[PCT] = ΣWi + τi = 26.5 + (2x4) = 34.5 minutes
E[CRT] is 34.5 minutes under the BTO push strategy.
Where(Wi) – expected time spent at each station
BTO/Push strategy
E[PCT] of the proposed BTO/Pull strategy with Kanban size
E[OQT] of the proposed BTO/Pull strategy with Kanban size
E[CRT] of the proposed BTO/Pull strategy with Kanban size
Conclusion
Initially, with increase in Kanban size PCT will decrease comparatively more than the increase
in OQT, thus overall CRT will reduce
After reaching optimal Kanban size, OQT will increase comparatively more than the decrease
in PCT with a further increase of Kanban size, which will result eventually increase CRT
In case of increased process variability (Cv=1) then increase in Kanban size would significantly
increase CRT
Compaq should trade-off between OQT and PCT by selecting optimal Kanban size (through
simulation) in BTO/Pull Strategy
Thank You!

Process control at Compaq.pptx

  • 1.
    Process Control atCompaq® Presented by – • Debarpan Haldar (2207010) • Dushyant Pratap (2207014) • Rishabh Singh (2207025) • Subhashish Das (2207026) • Sumit Singh (2207027) “Understanding the Build-to-Order Decision”
  • 2.
    Compaq launched ODM (Optimised Distribution Model) tocreate Customer Value Revolution Launching New Business Model Compaq wants to be here by implementing JIT & KANBAN Compaq is currently here Push Pull BTO BTF WIP FGI Strategy
  • 3.
  • 4.
  • 5.
    Time Measures 5 The timetaken from the issuing of a work order until the completion of the order The time a work order waits in the order queue until it is “released” to the (production) process The time taken from the release of an order into the (production) process until the delivery of the finished product (to the customer or to the FGI) TPT = OQT + PCT
  • 6.
    Inter-relation amongst processperformance measures Increasing inventory will improve responsiveness, but also increase inventory carrying cost Inventory incurs cost in the form of - • Opportunity cost of financial capital • The cost of product obsolescence • Cost of maintaining warehouse operations Increasing production capacity can reduce both inventory and response time at the cost of increasing idleness Compaq wishes to maximise the resource utilisation of its process, thus no need to increase the capacity currently
  • 7.
    Process Control Strategies Howmuch product needs to be processed? (Process Loading) Process loading decisions dictate when a process work order is created • Build-to-order (BTO) • Build-to-forecast (BTF) When exactly should the processing be initiated? (Process release) Process release decisions dictate when process work orders are released into the process • Push Strategy • Pull Strategy
  • 8.
    CRT = TPT= PCT CRT ≤ TPT = PCT CRT = TPT = OQT + PCT CRT ≤ TPT = OQT + PCT
  • 9.
    Serial Production Processof Computer Assembly Install chip sets Install PC boards Install power Install drives If the processing time @ each station is 2 mins, then the stations capacity will be 30 computers/hrs
  • 10.
    WIP Inventory Control •Push (Unlimited WIP) • Pull (WIP Inventory Control) • Zero buffer • Kanban square • CONWIP • Bottleneck starvation avoidance Kan = Card Ban = Signal Kanban – trigger replenishment activity
  • 11.
    MIN/MAX System: VisualReorder Point MAX (Maximum Allowable) MIN (Minimum  Place Order) Safety Stock Visual Signal Positive signal when depleted
  • 12.
    Effect of variability and Kanbansize on Production Capacity (SD/µ)²
  • 13.
    Mean Process CycleTime (PCT) for Push and Pull WIP strategies Little’s Law: WIP = Throughput*PCT
  • 14.
    Comparison of BTO& BTF BTO • Process work orders are created only in response to actual customer orders • BTO strategy do not use FGI • BTO/Pull strategies limit WIP inventories and release process work orders only once WIP falls below a certain level • BTO-Push: CRT=TPT=PCT • BTO-Pull: CRT=TPT=OQT+PCT BTF • Process work orders are created in anticipation of customer demand • BTF strategies use FGI to buffer the process from demand • BTF/Push strategies do not attempt to control WIP inventories • BTF-Push: CRT<=TPT=PCT • BTF-Pull: CRT<=TPT=OQT+PCT
  • 15.
    Given Data : CV²A = 1  Mean Arrival rate (λ) = 23 computers/hour  CV²S = 1  τ = 2 minutes for each station  Manufacturing Strategy – BTO/Pull
  • 16.
    From Queueing theory, Utilizationrate = (23/30) = 0.77 ~ 77%, τi = Mean Service Time = 2 minutes Wi = 2 x {0.77/(1-0.77)} = 26.5 minutes E[CRT] = E[PCT] = ΣWi + τi = 26.5 + (2x4) = 34.5 minutes E[CRT] is 34.5 minutes under the BTO push strategy. Where(Wi) – expected time spent at each station
  • 17.
  • 18.
    E[PCT] of theproposed BTO/Pull strategy with Kanban size
  • 19.
    E[OQT] of theproposed BTO/Pull strategy with Kanban size
  • 20.
    E[CRT] of theproposed BTO/Pull strategy with Kanban size
  • 21.
    Conclusion Initially, with increasein Kanban size PCT will decrease comparatively more than the increase in OQT, thus overall CRT will reduce After reaching optimal Kanban size, OQT will increase comparatively more than the decrease in PCT with a further increase of Kanban size, which will result eventually increase CRT In case of increased process variability (Cv=1) then increase in Kanban size would significantly increase CRT Compaq should trade-off between OQT and PCT by selecting optimal Kanban size (through simulation) in BTO/Pull Strategy
  • 22.