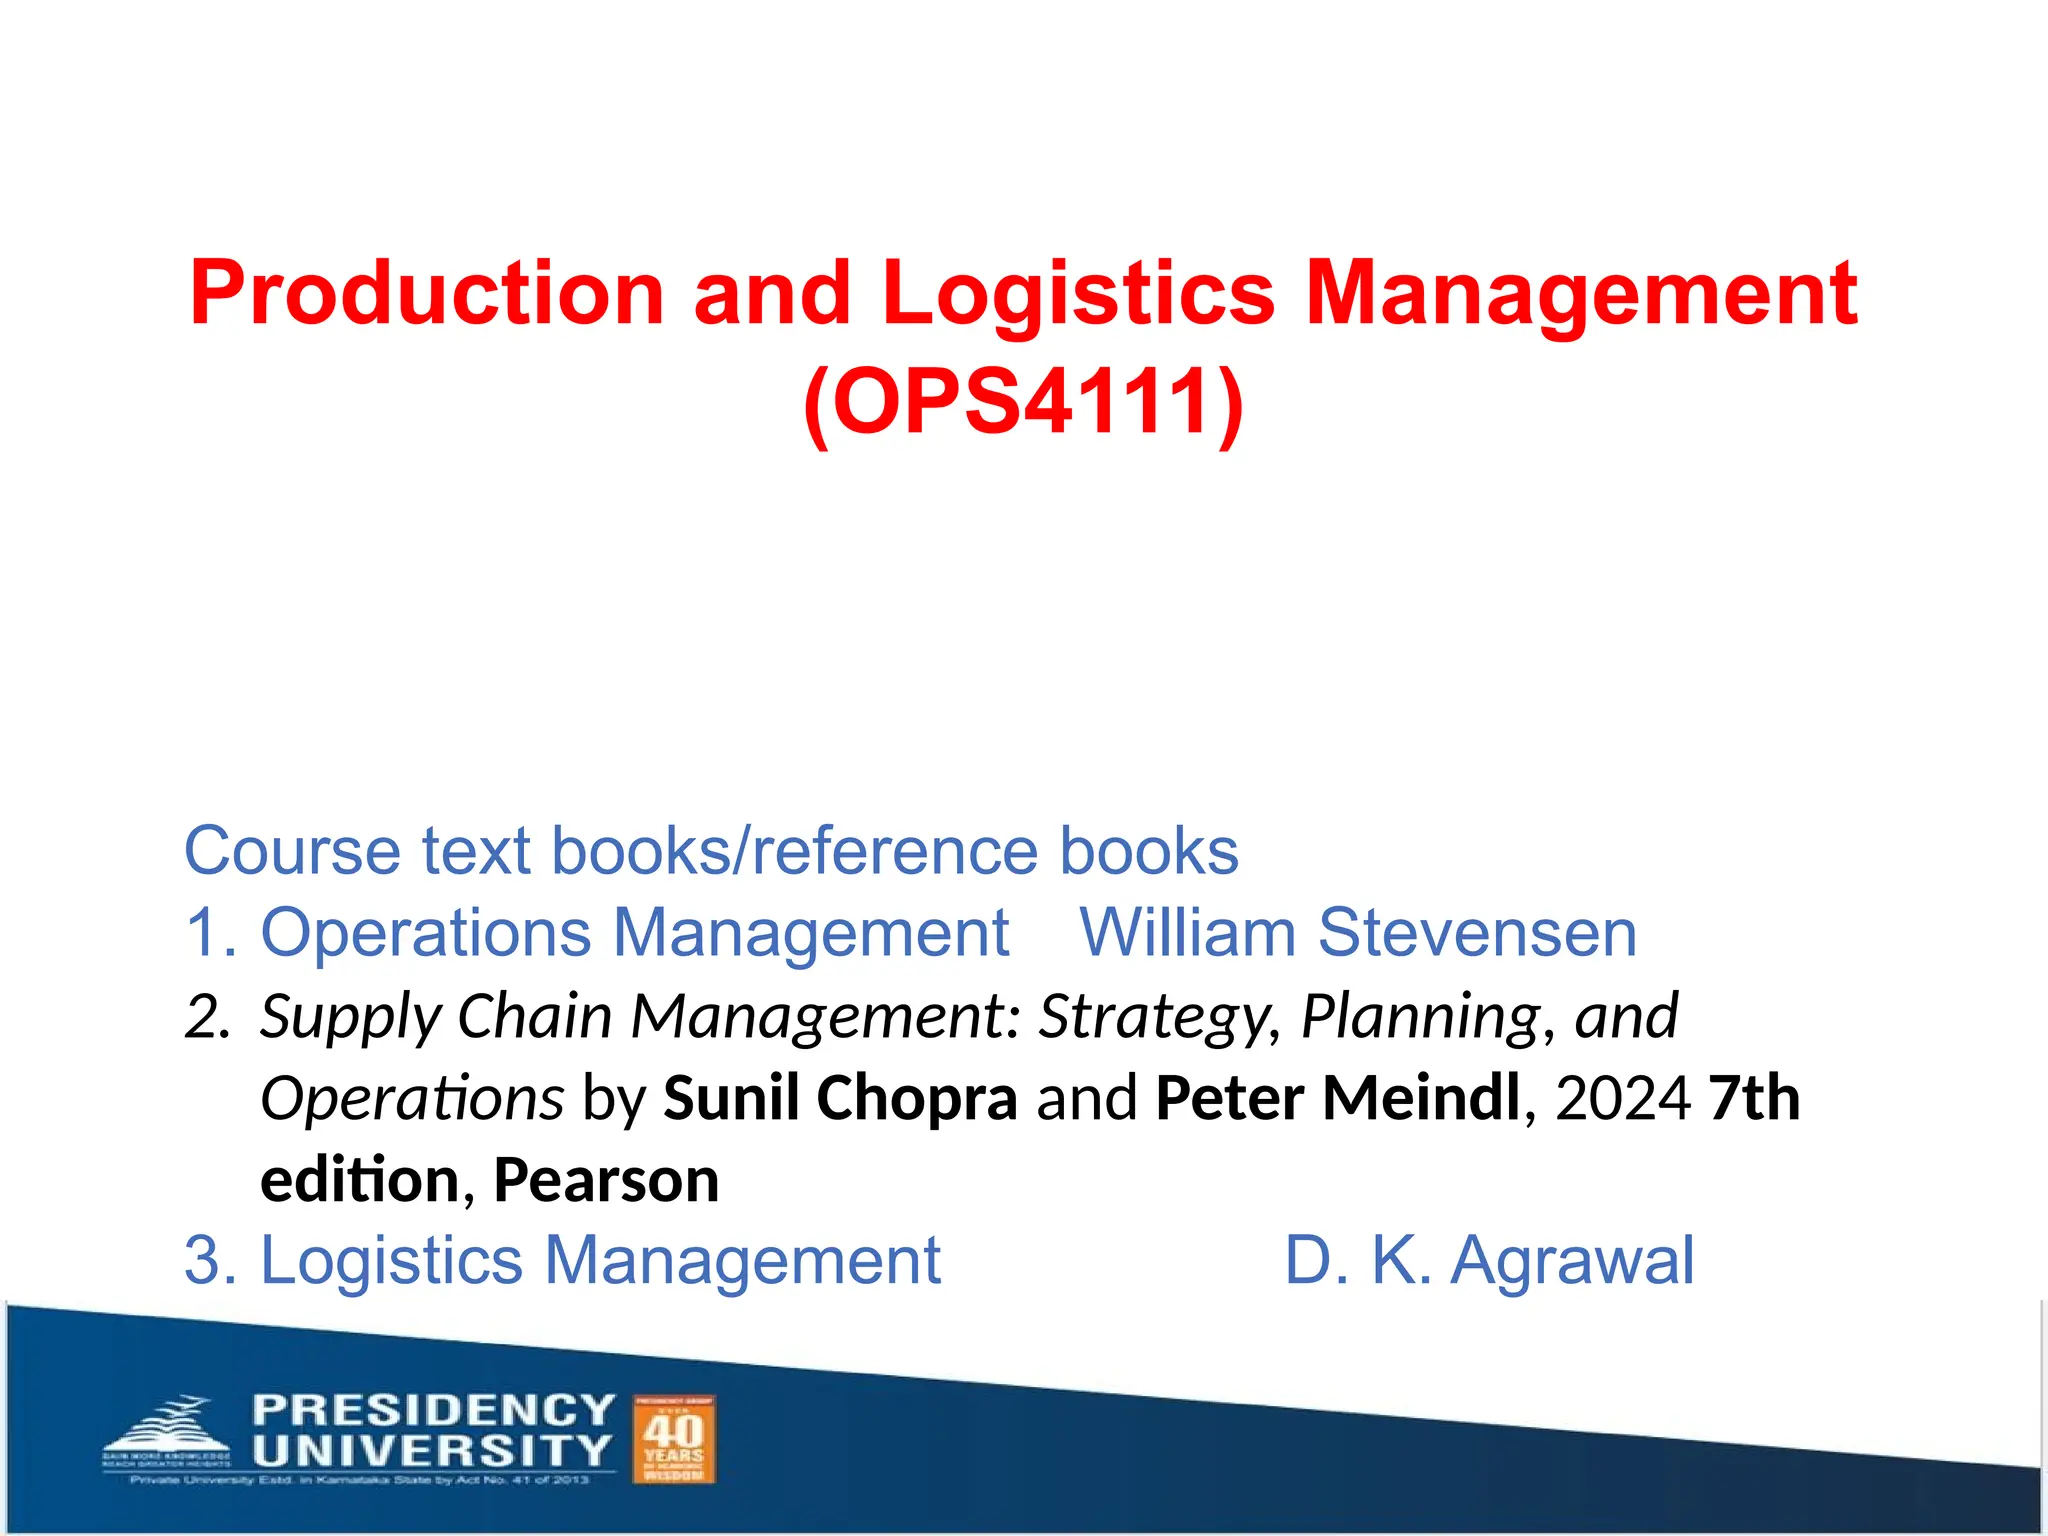
This document is a comprehensive and academically structured presentation covering the full spectrum of Production and Logistics Management concepts. It is based on major textbooks such as William Stevenson’s Operations Management and Chopra & Meindl’s Supply Chain Management, and integrates real-world corporate examples, caselets, modern technologies, Industry 4.0 principles, productivity calculations, and operational strategy frameworks. This resource is ideal for MBA, BBA, supply chain, operations management, and logistics students, as well as professionals preparing for industry roles.

⸻
1. Introduction to Production & Operations Management
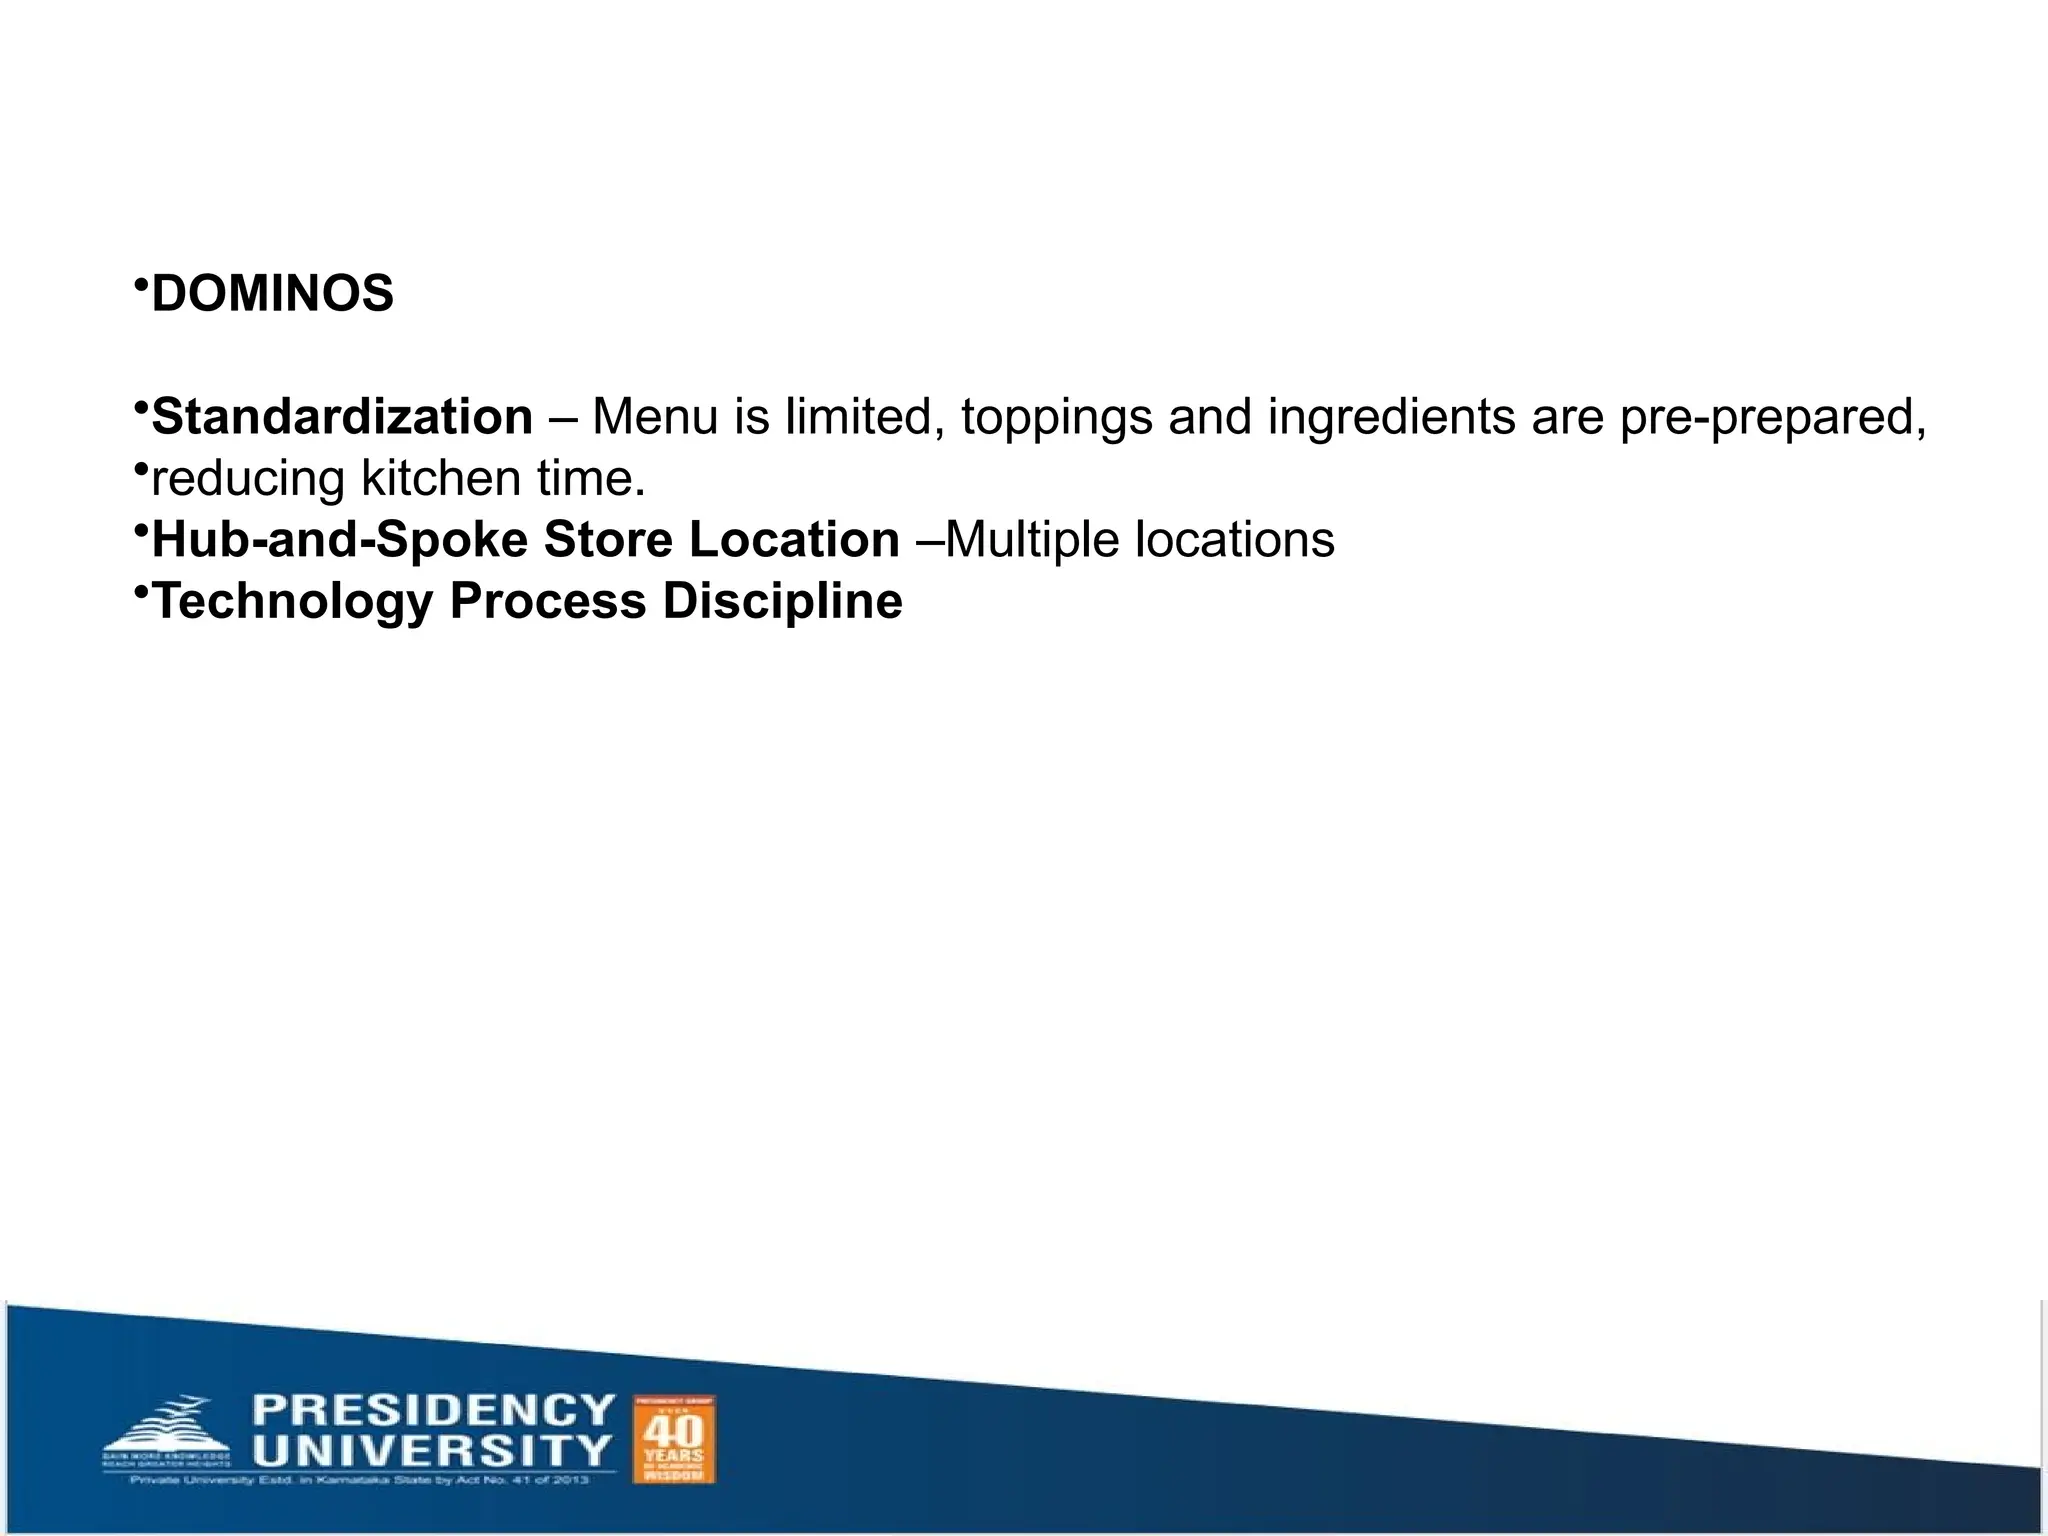
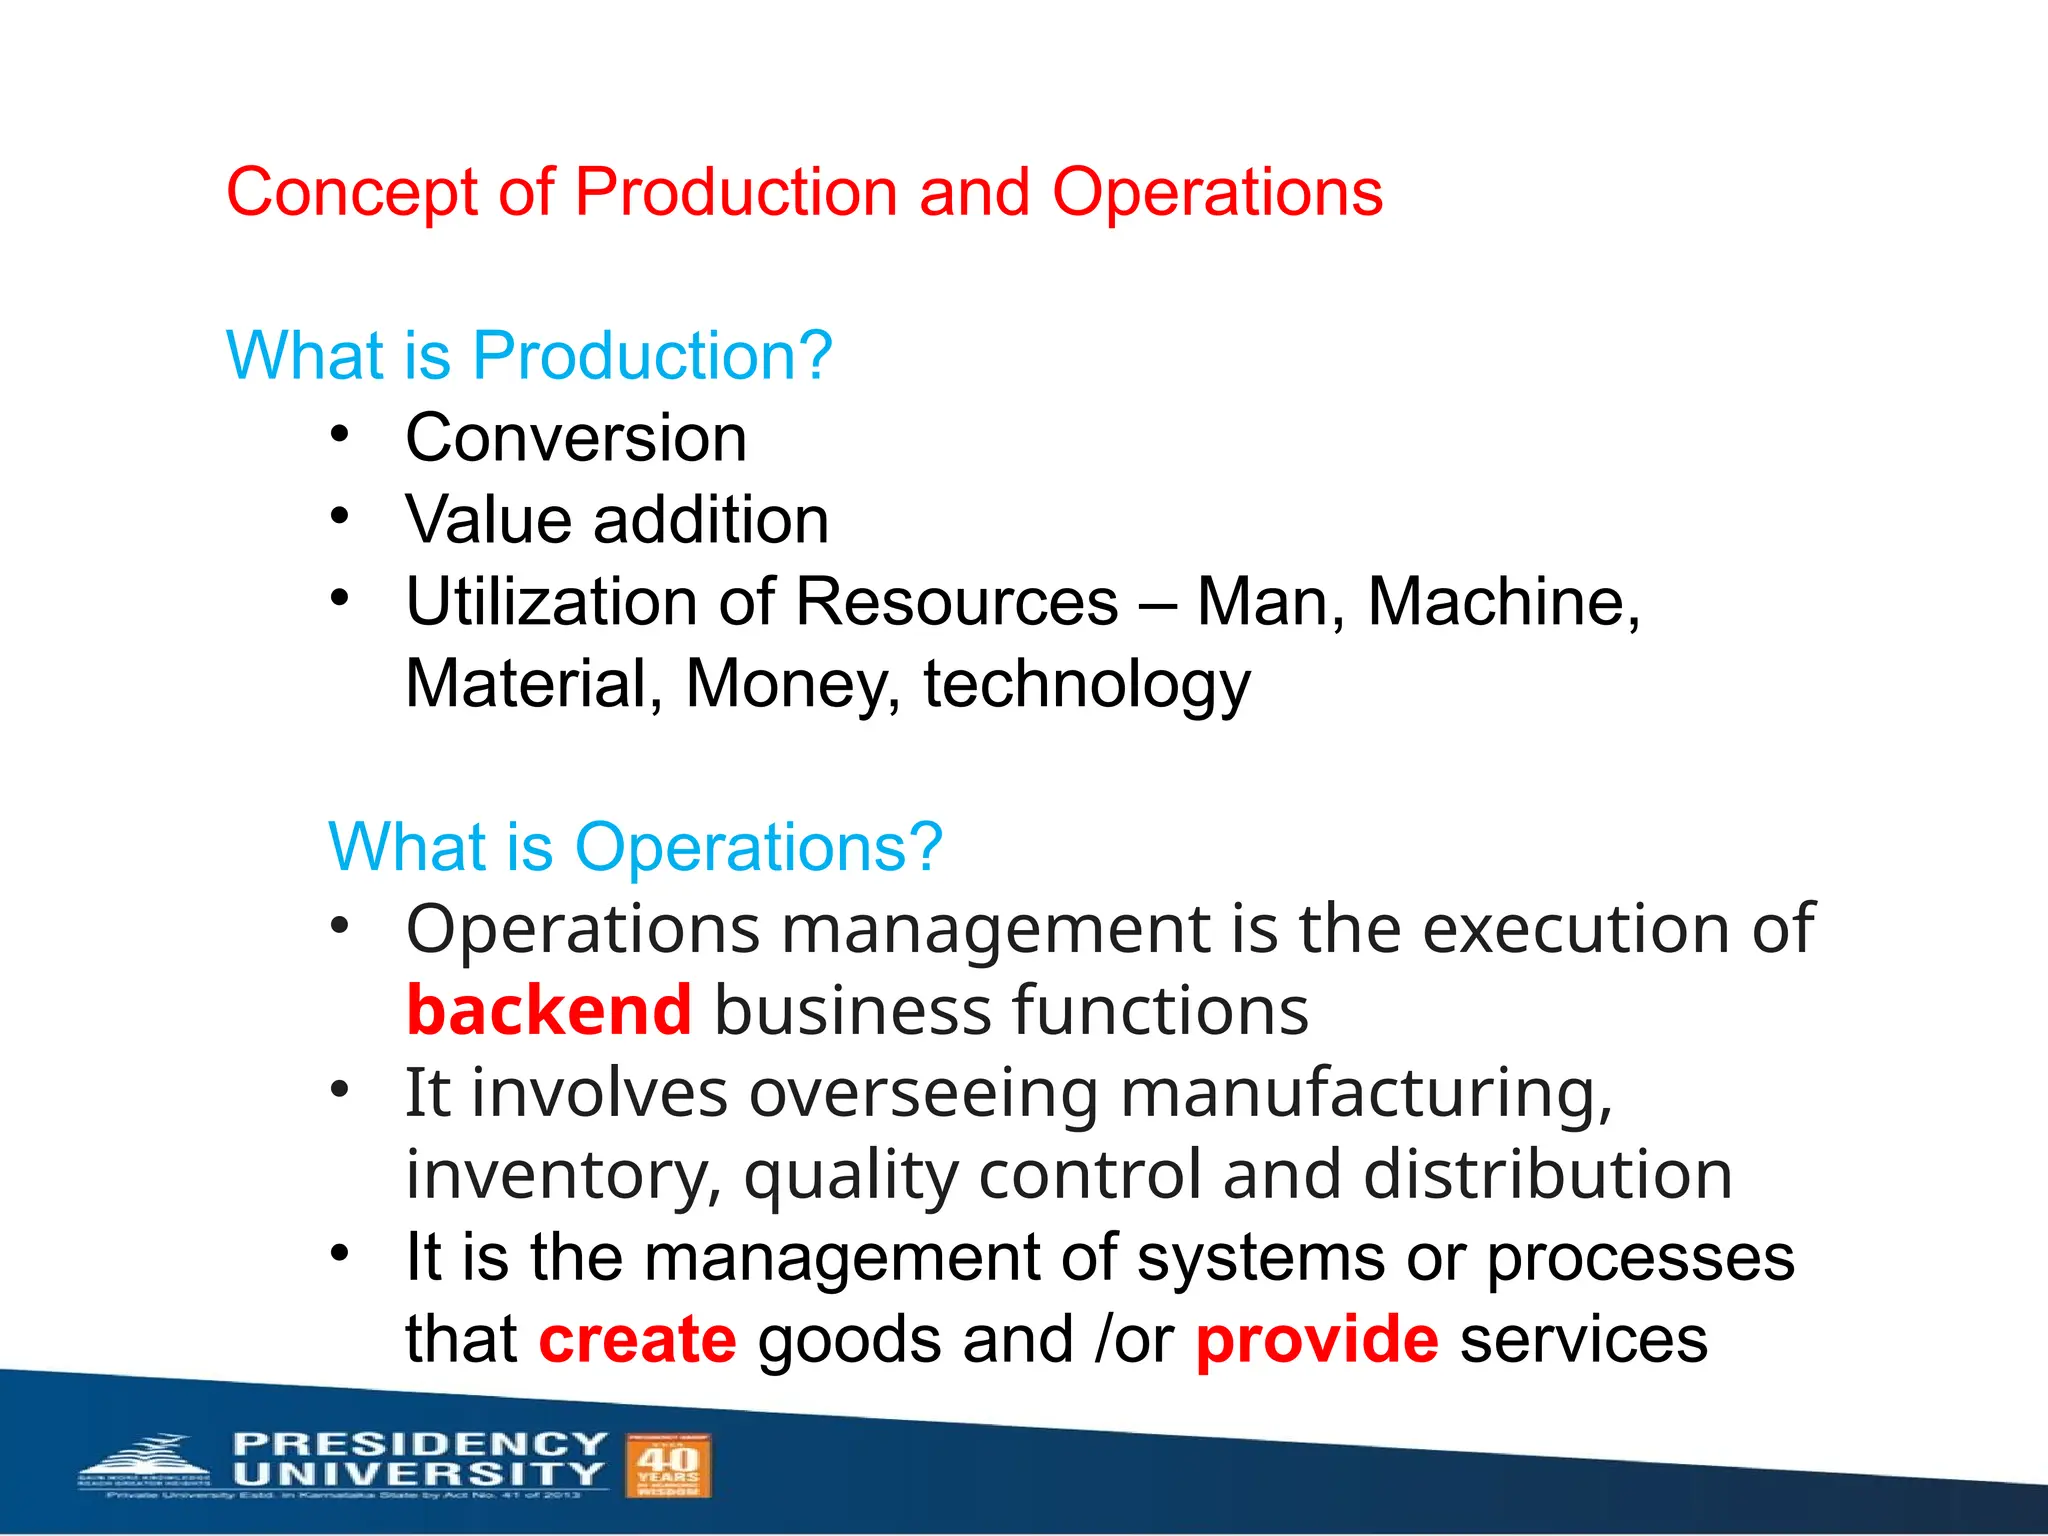
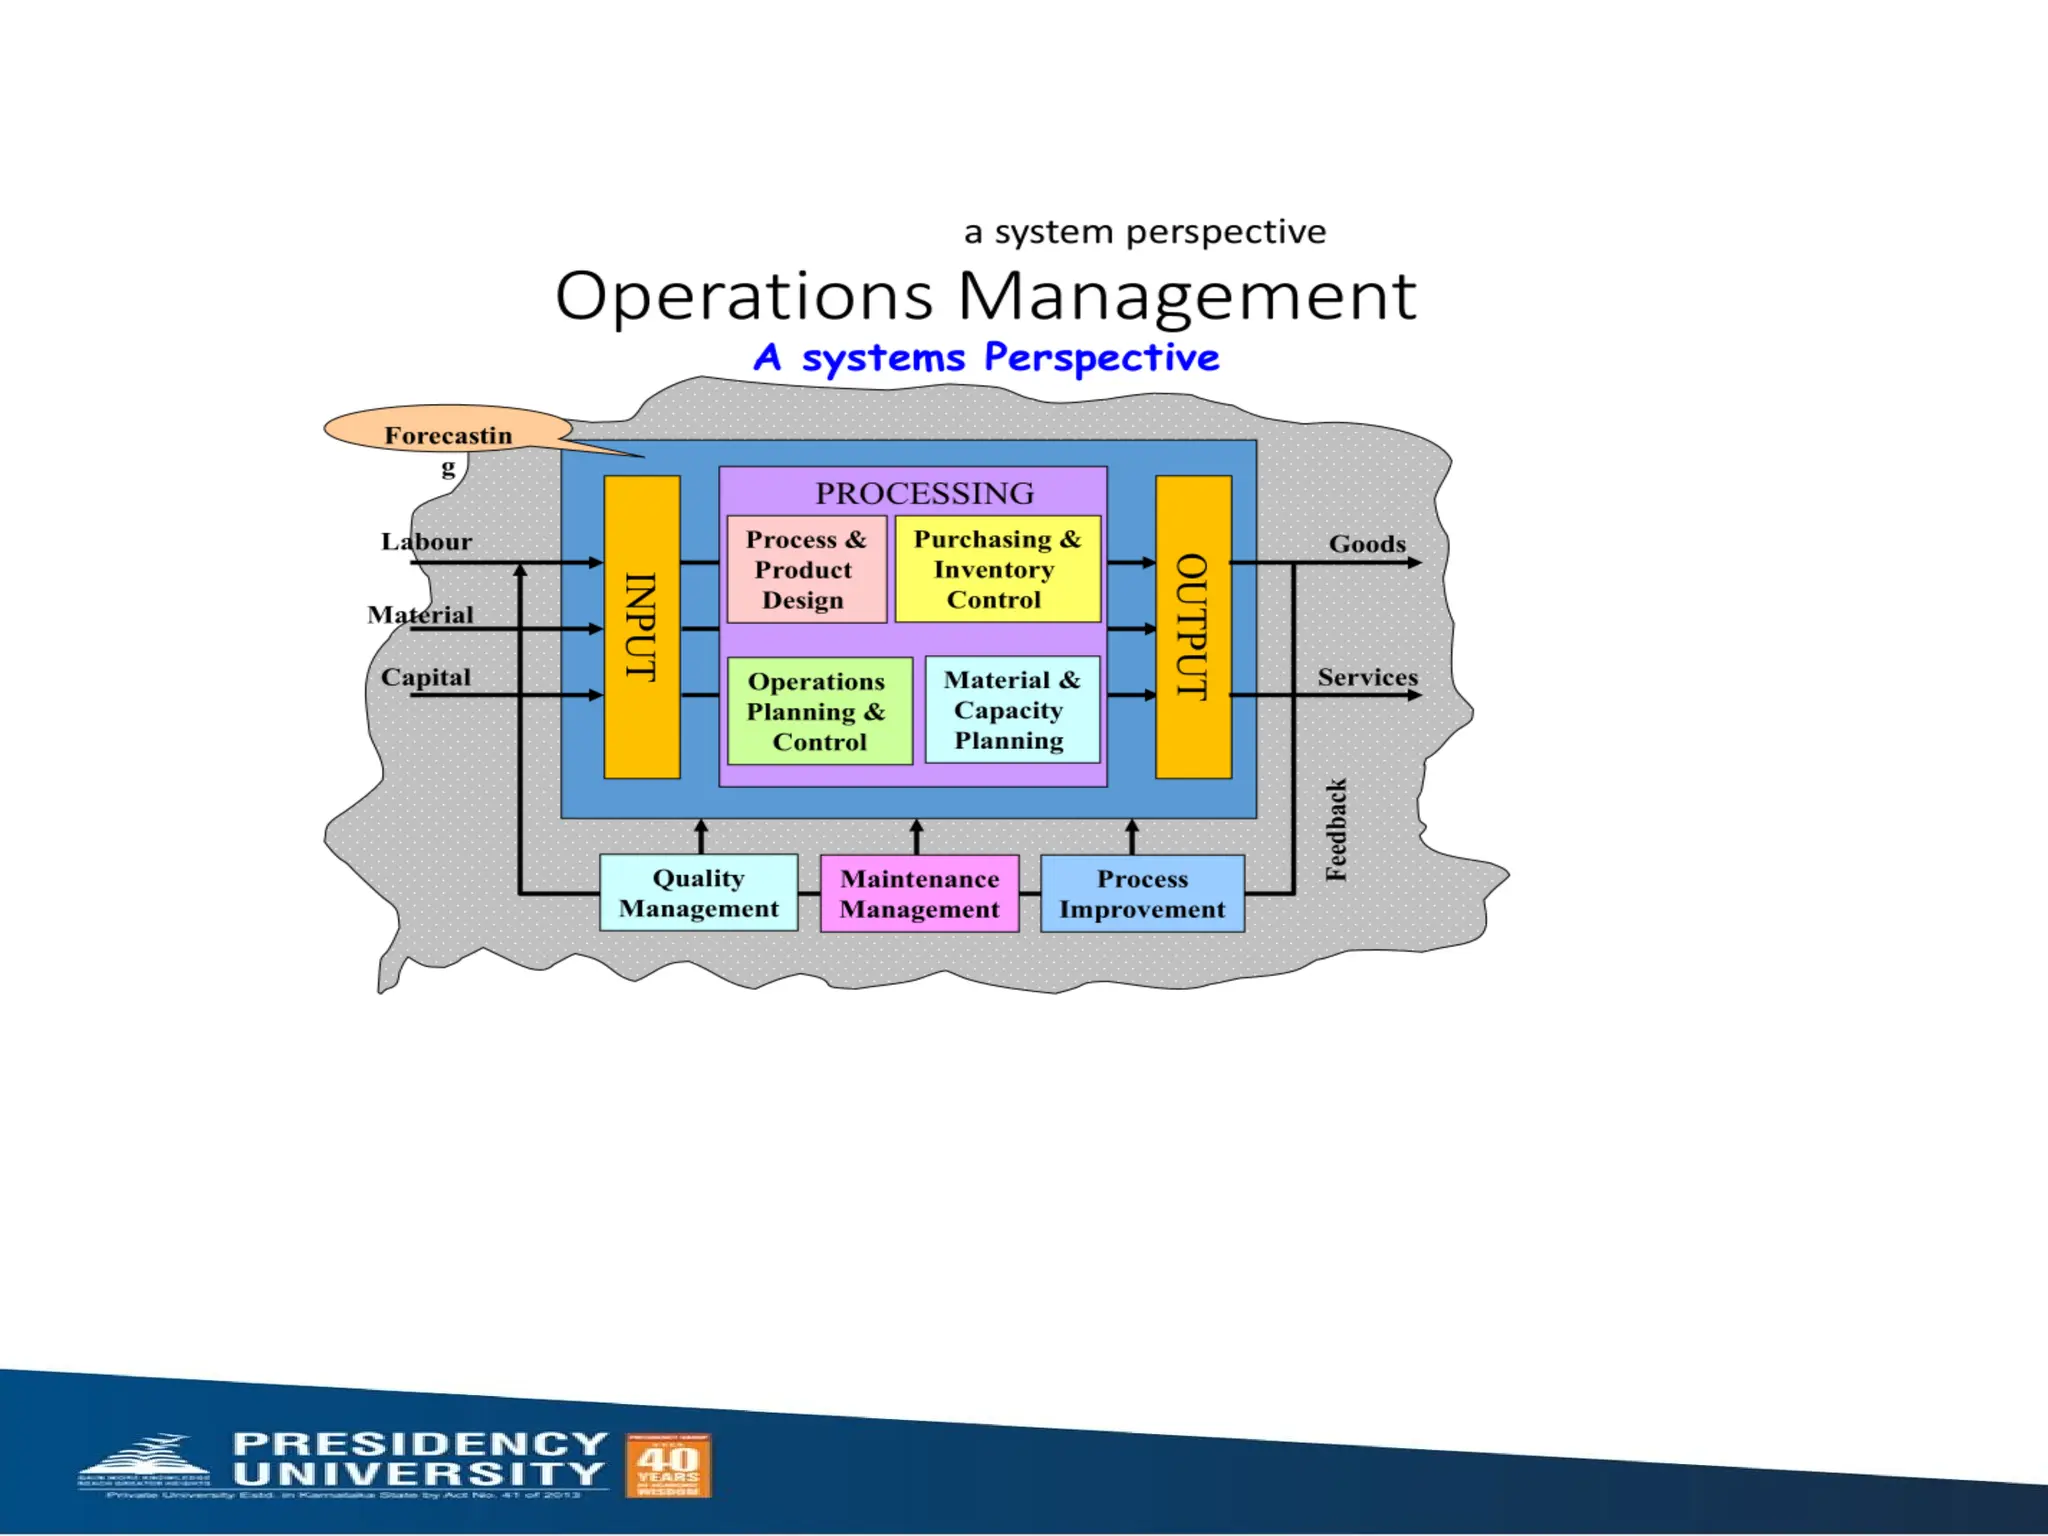
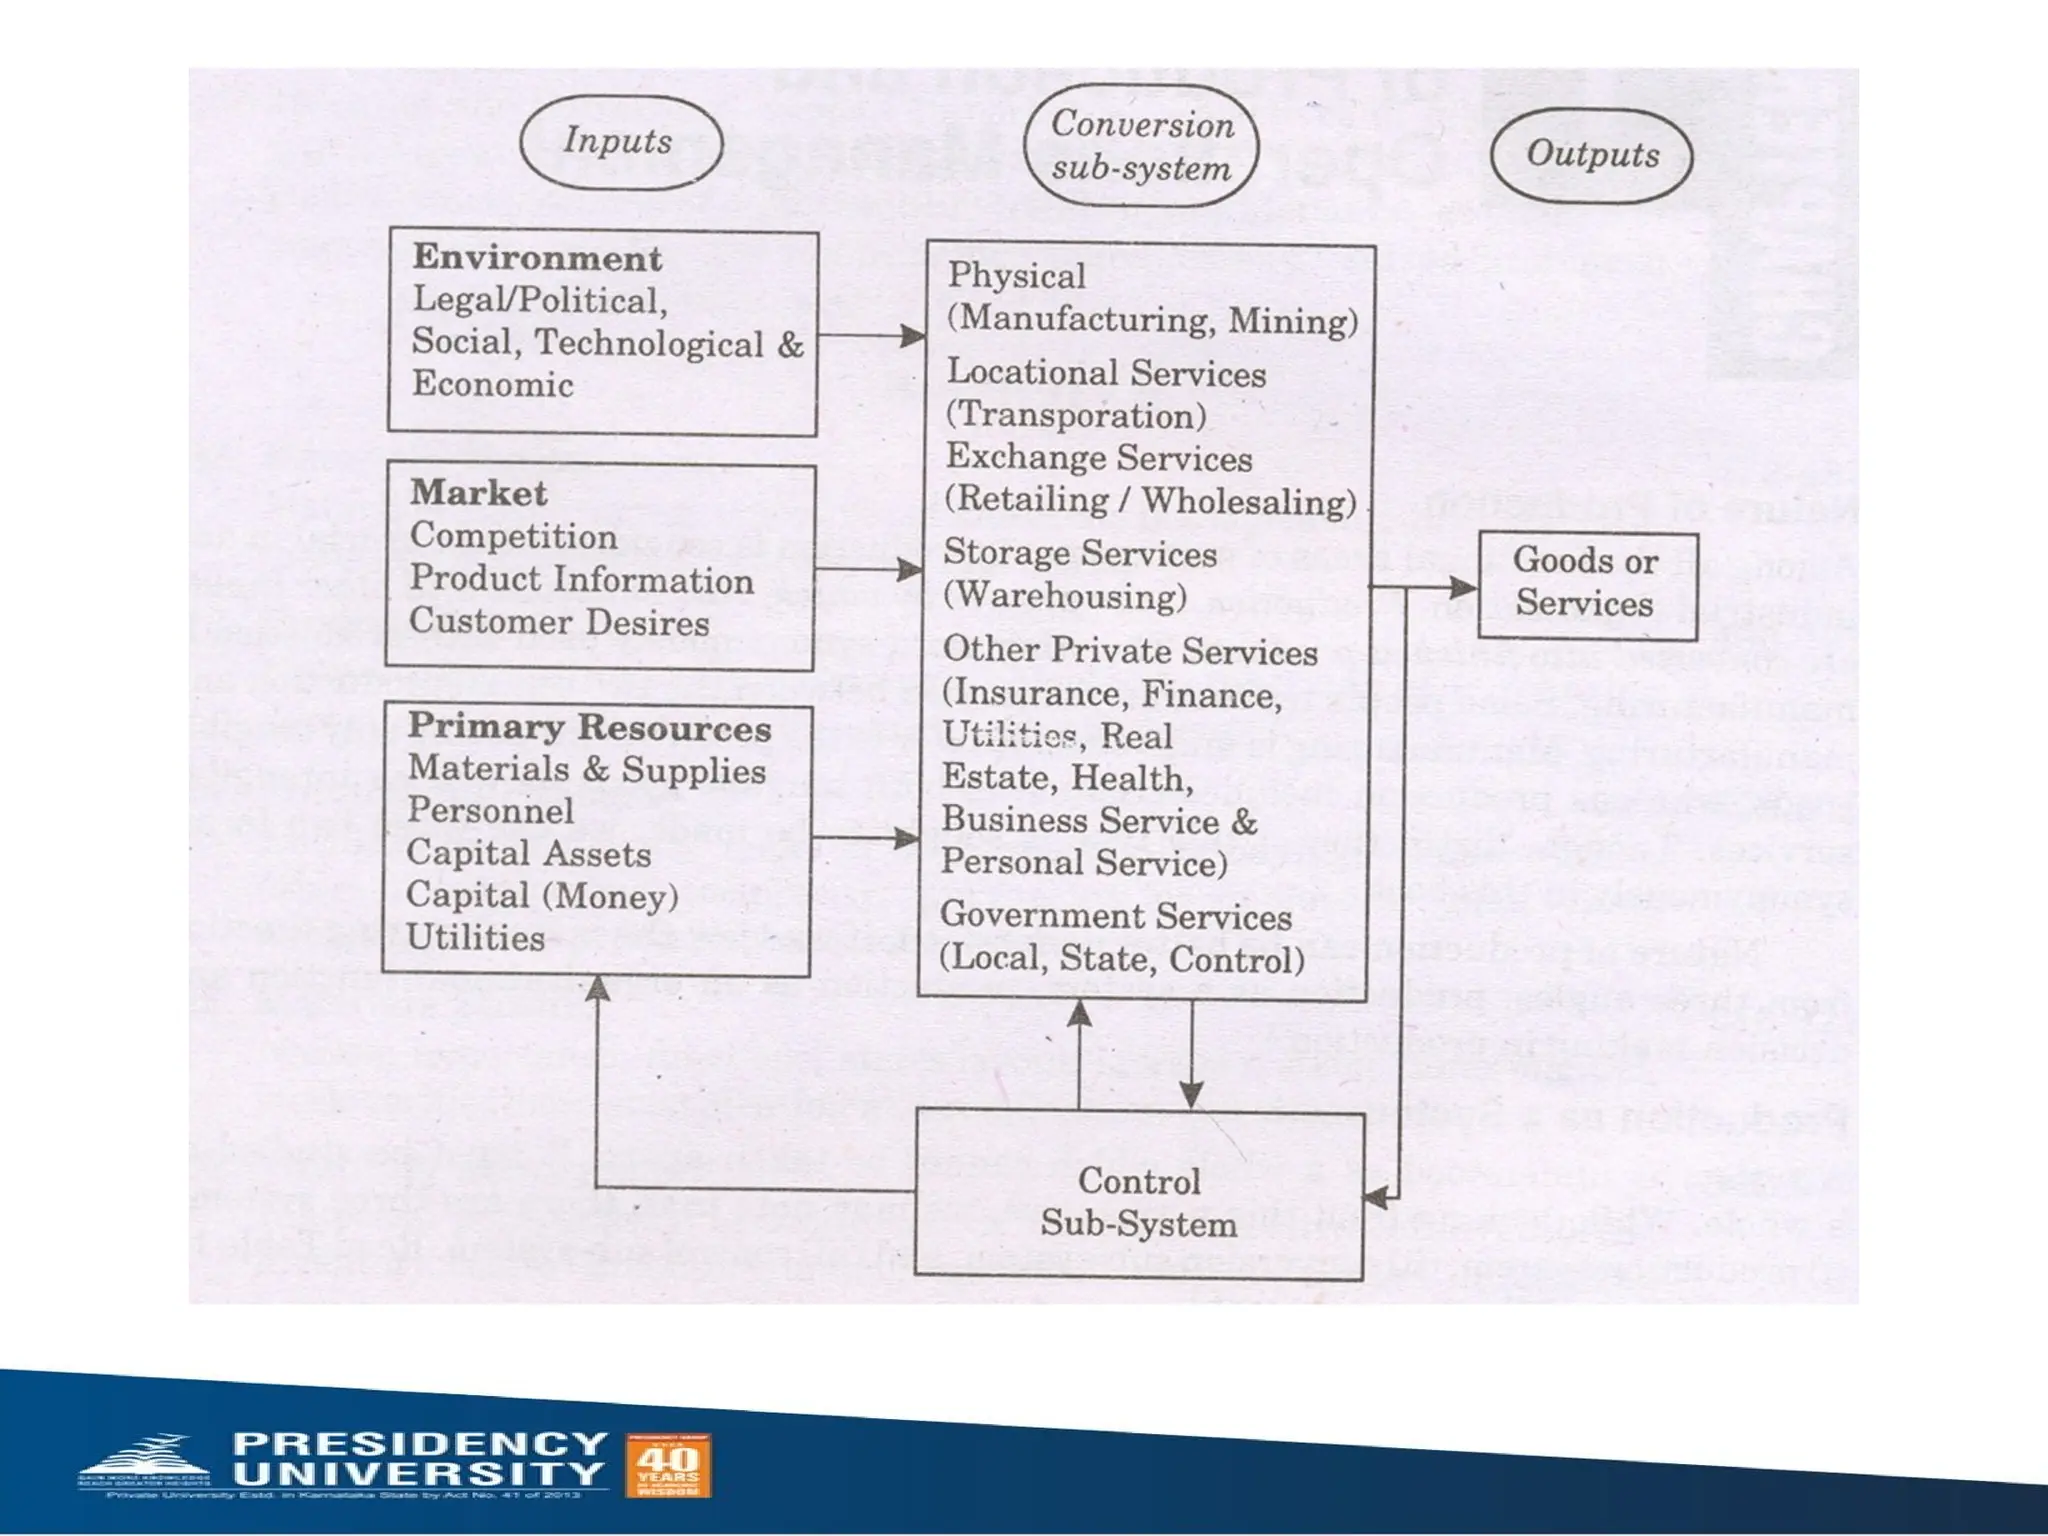
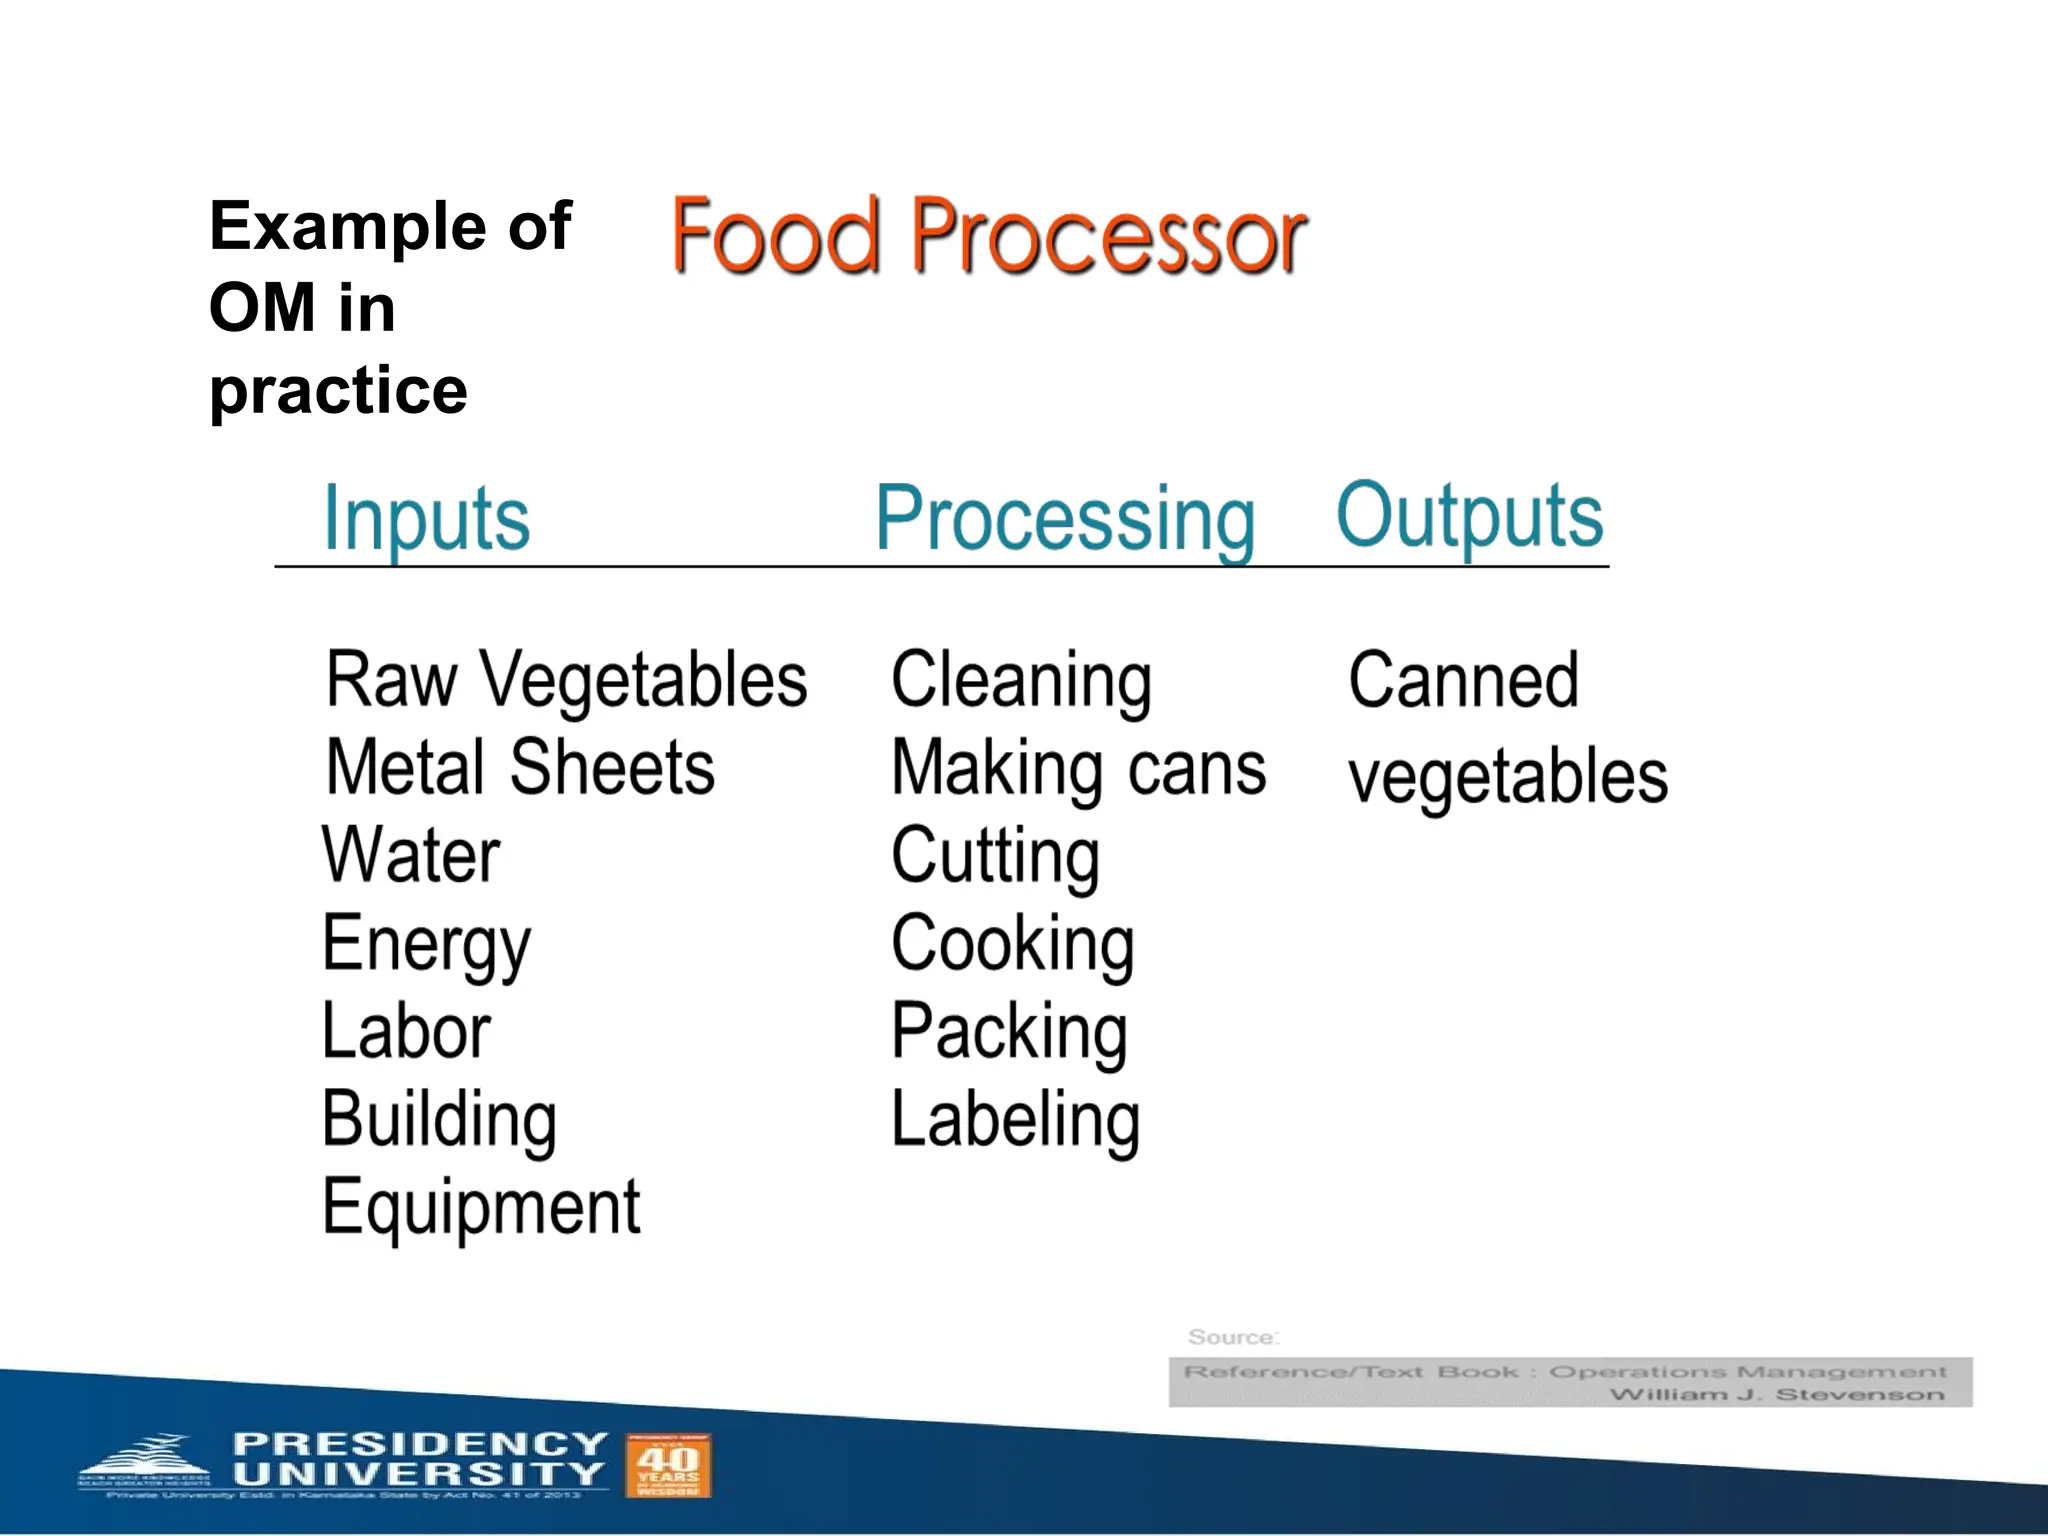
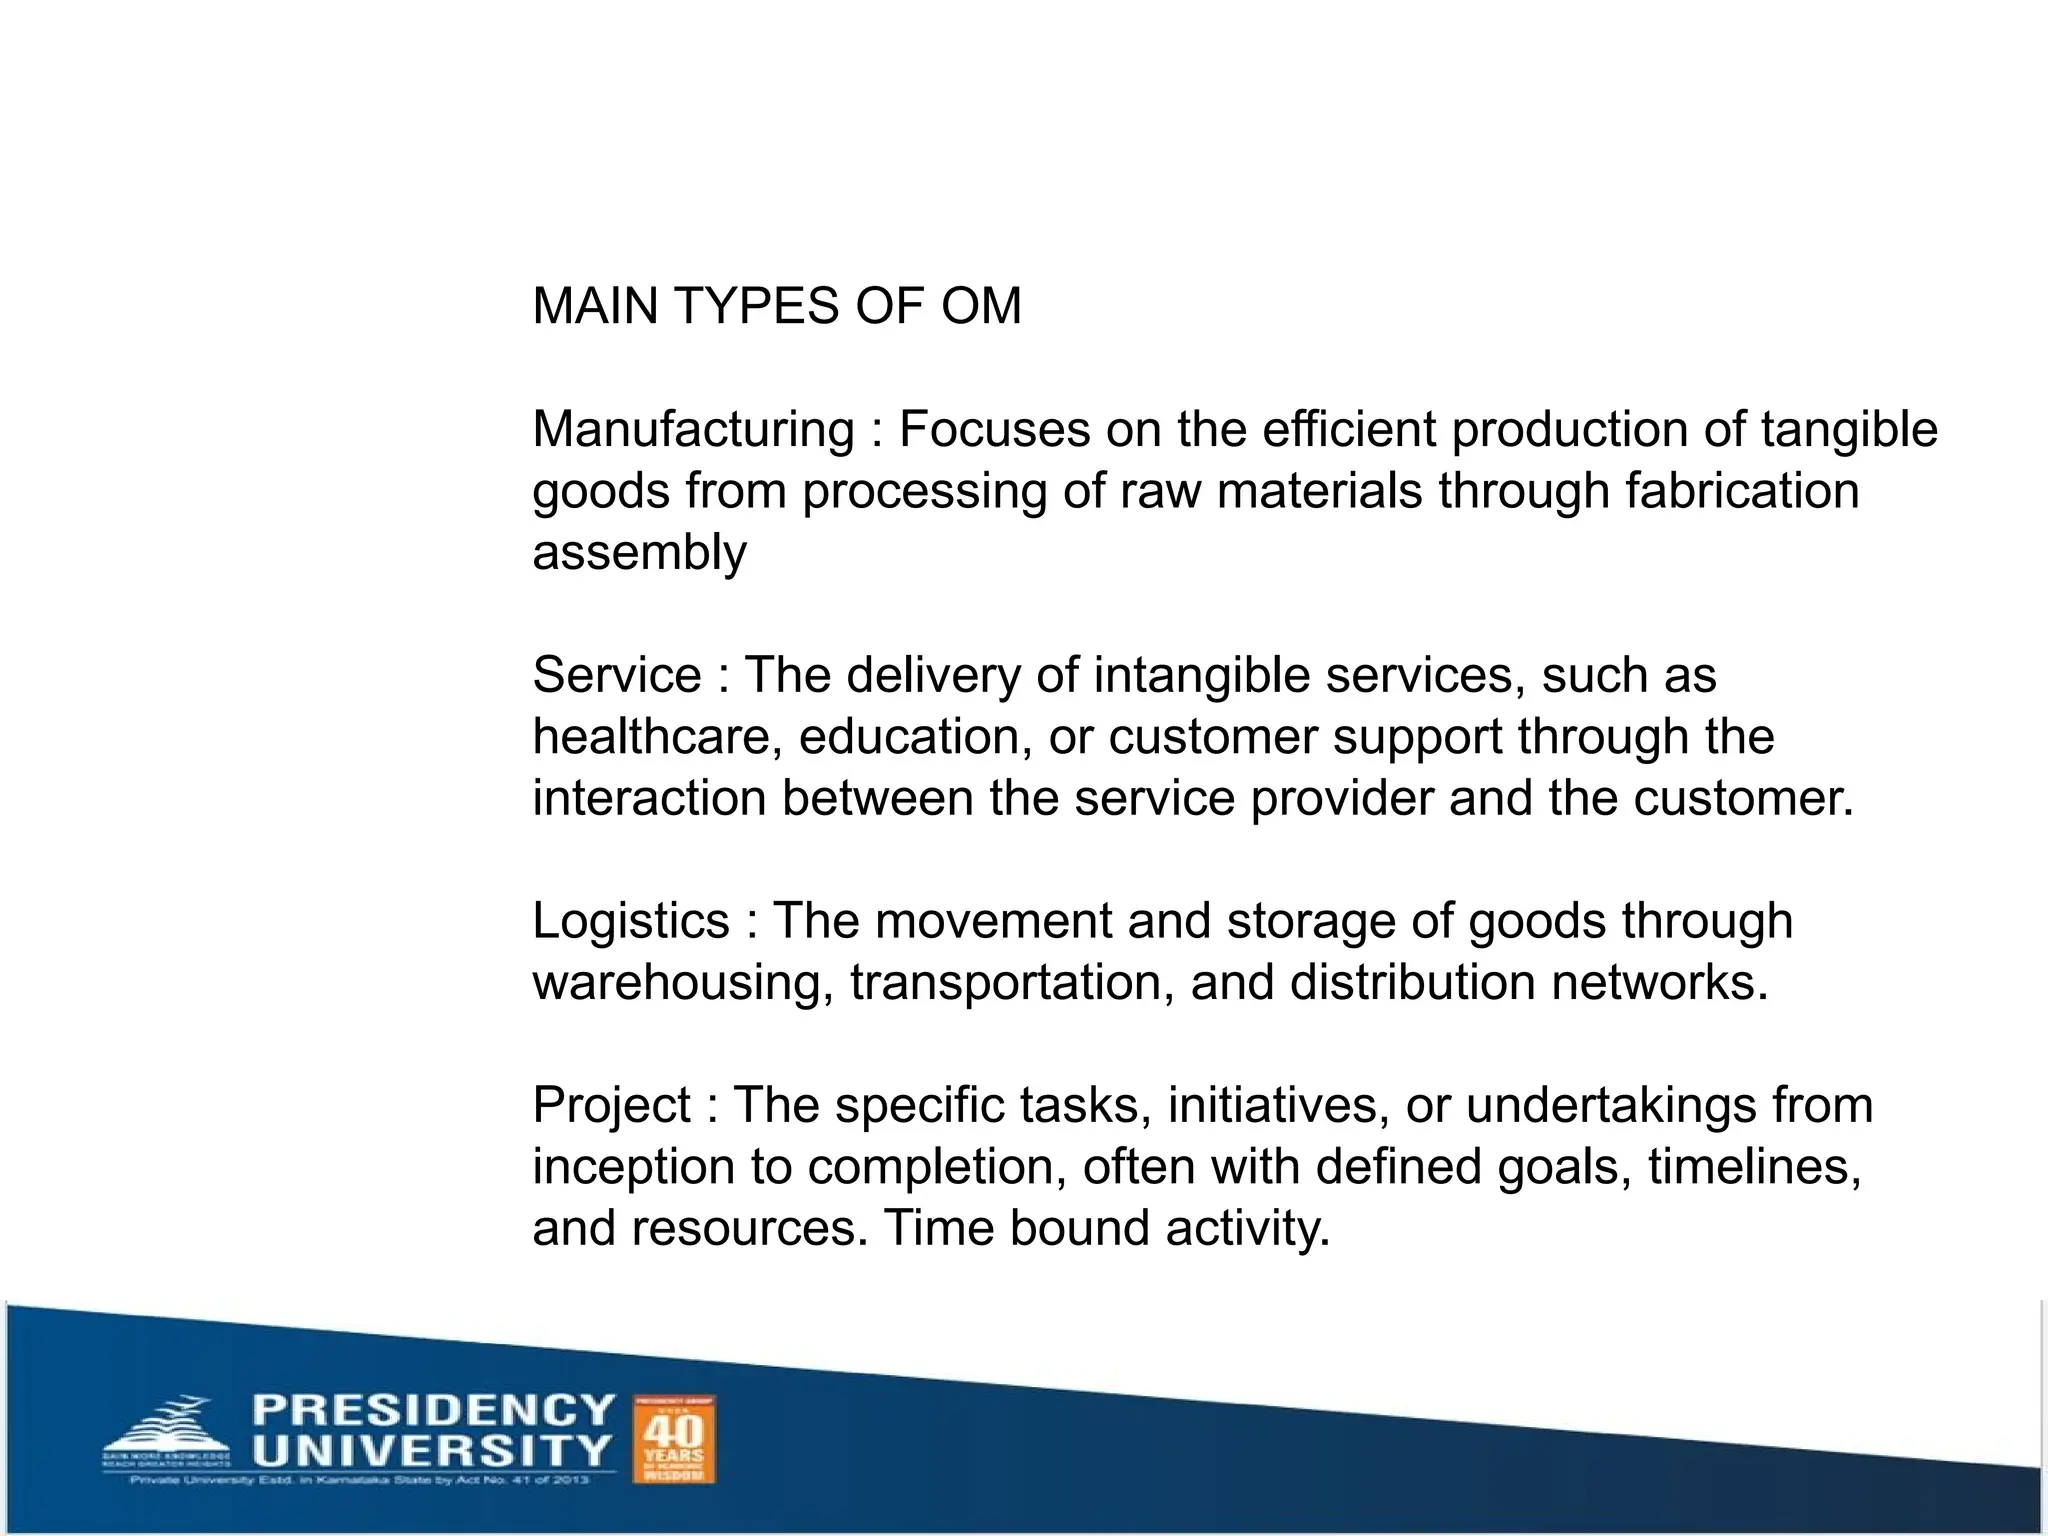
The presentation begins by defining the core concepts of production and operations, explaining how organizations convert inputs into valuable outputs. Production is described as the process of converting raw materials into finished goods through value-adding activities using the 5Ms — Man, Machine, Material, Money, and Methods (including technology). Operations Management (OM), on the other hand, focuses on managing backend functions such as manufacturing, inventory, quality control, distribution, and service delivery.
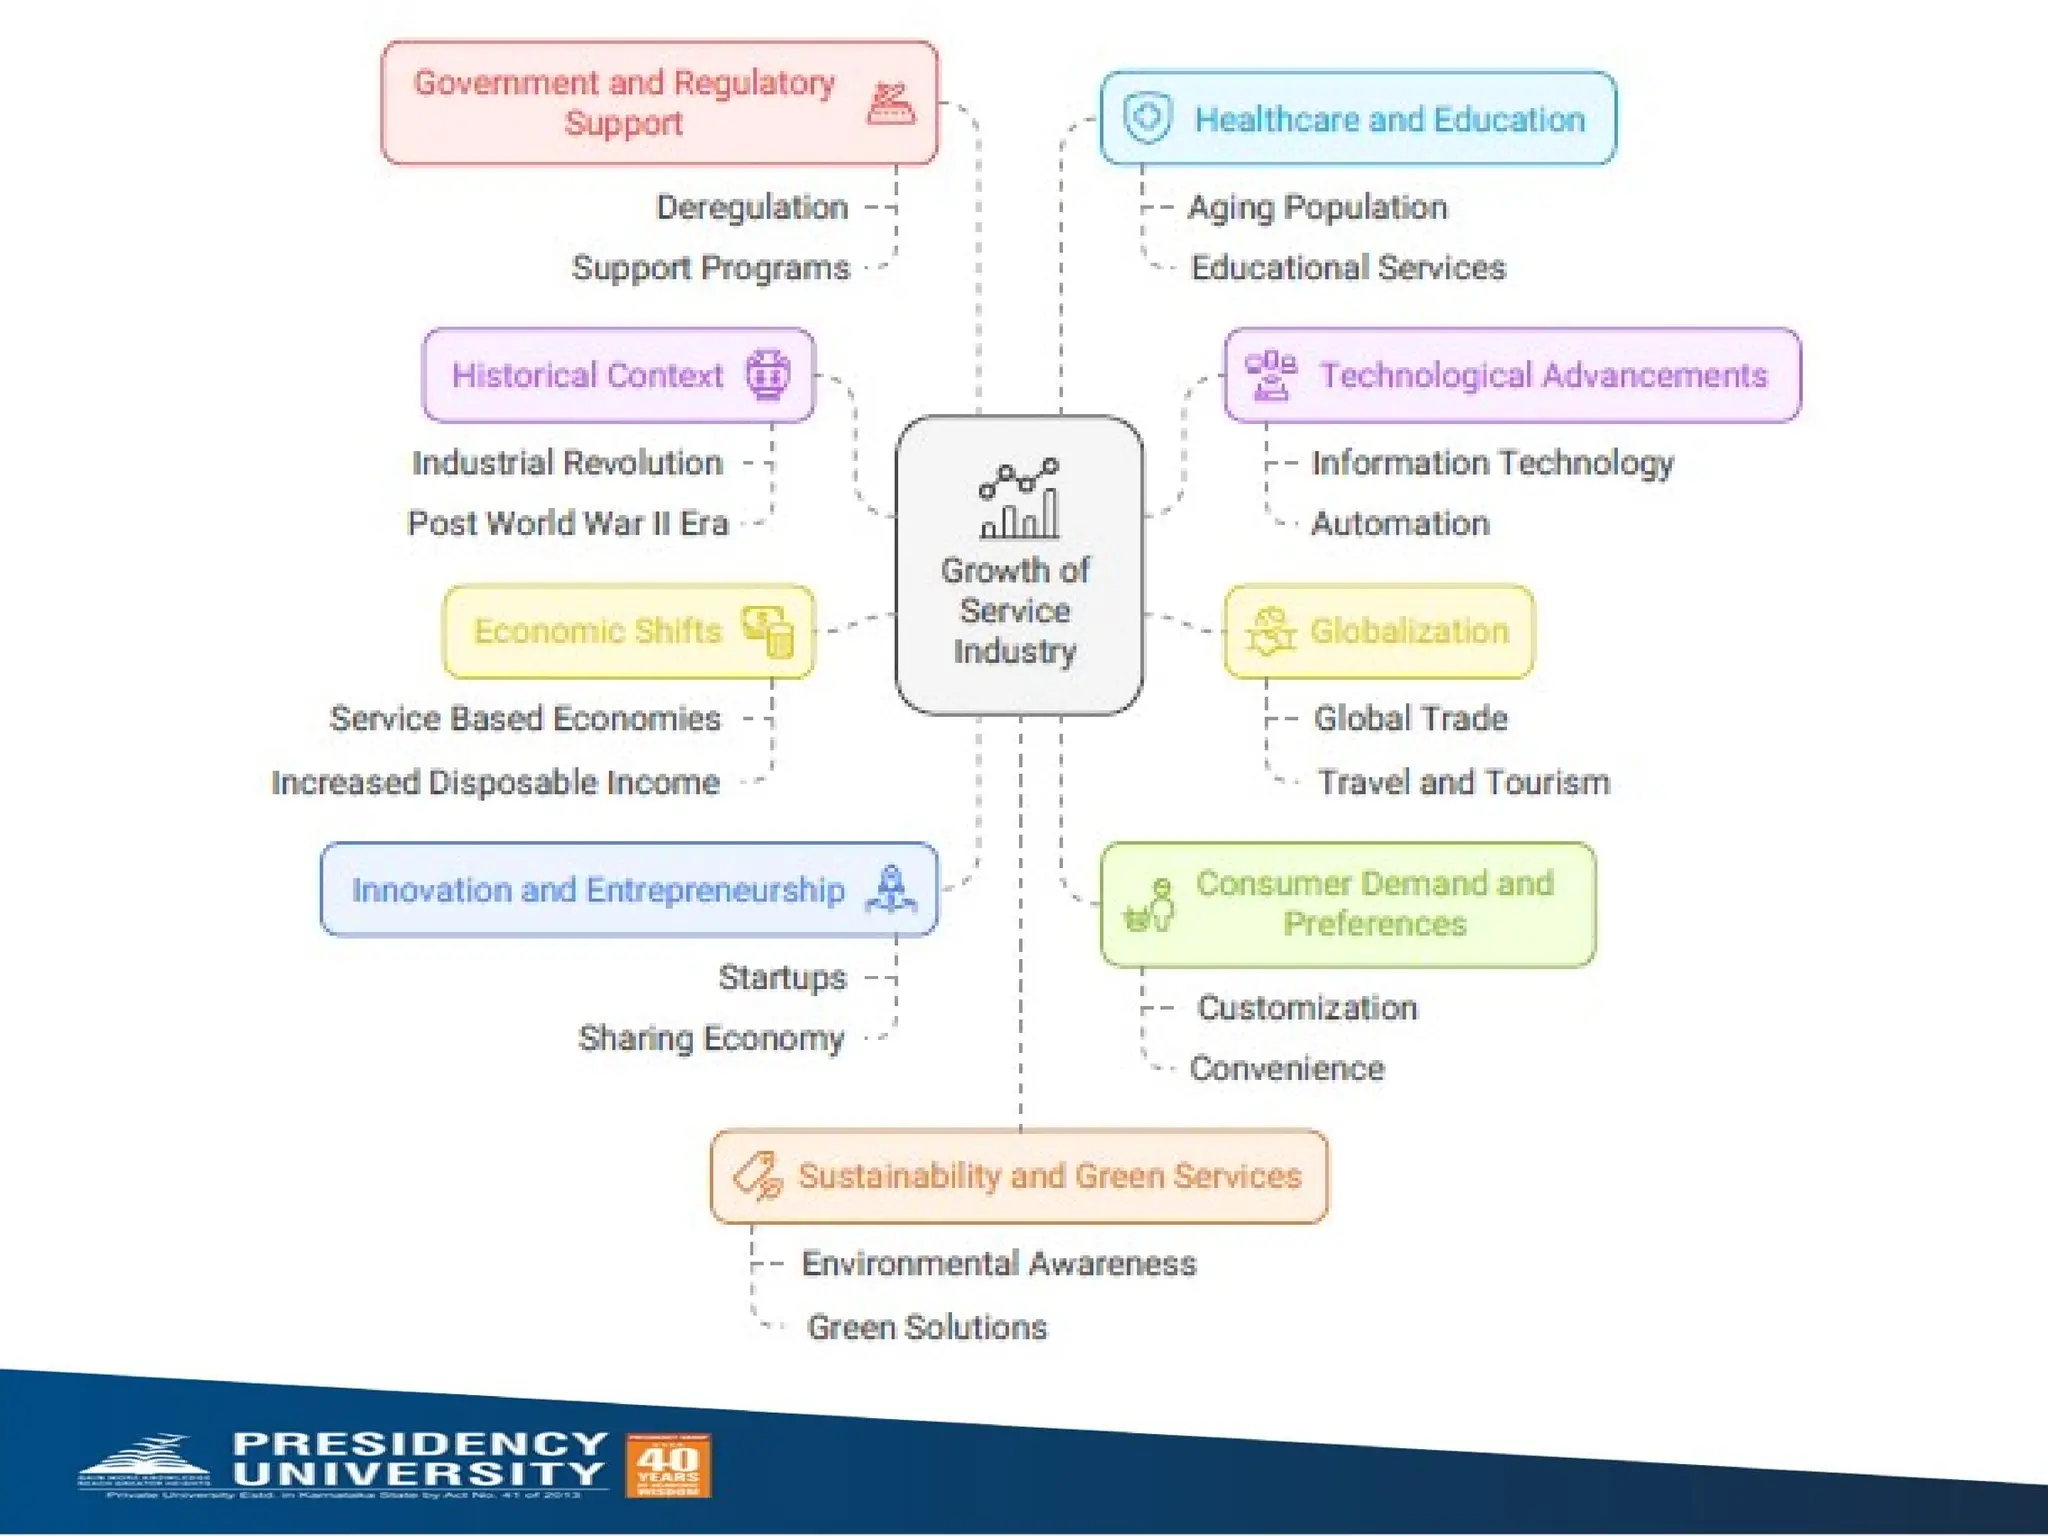
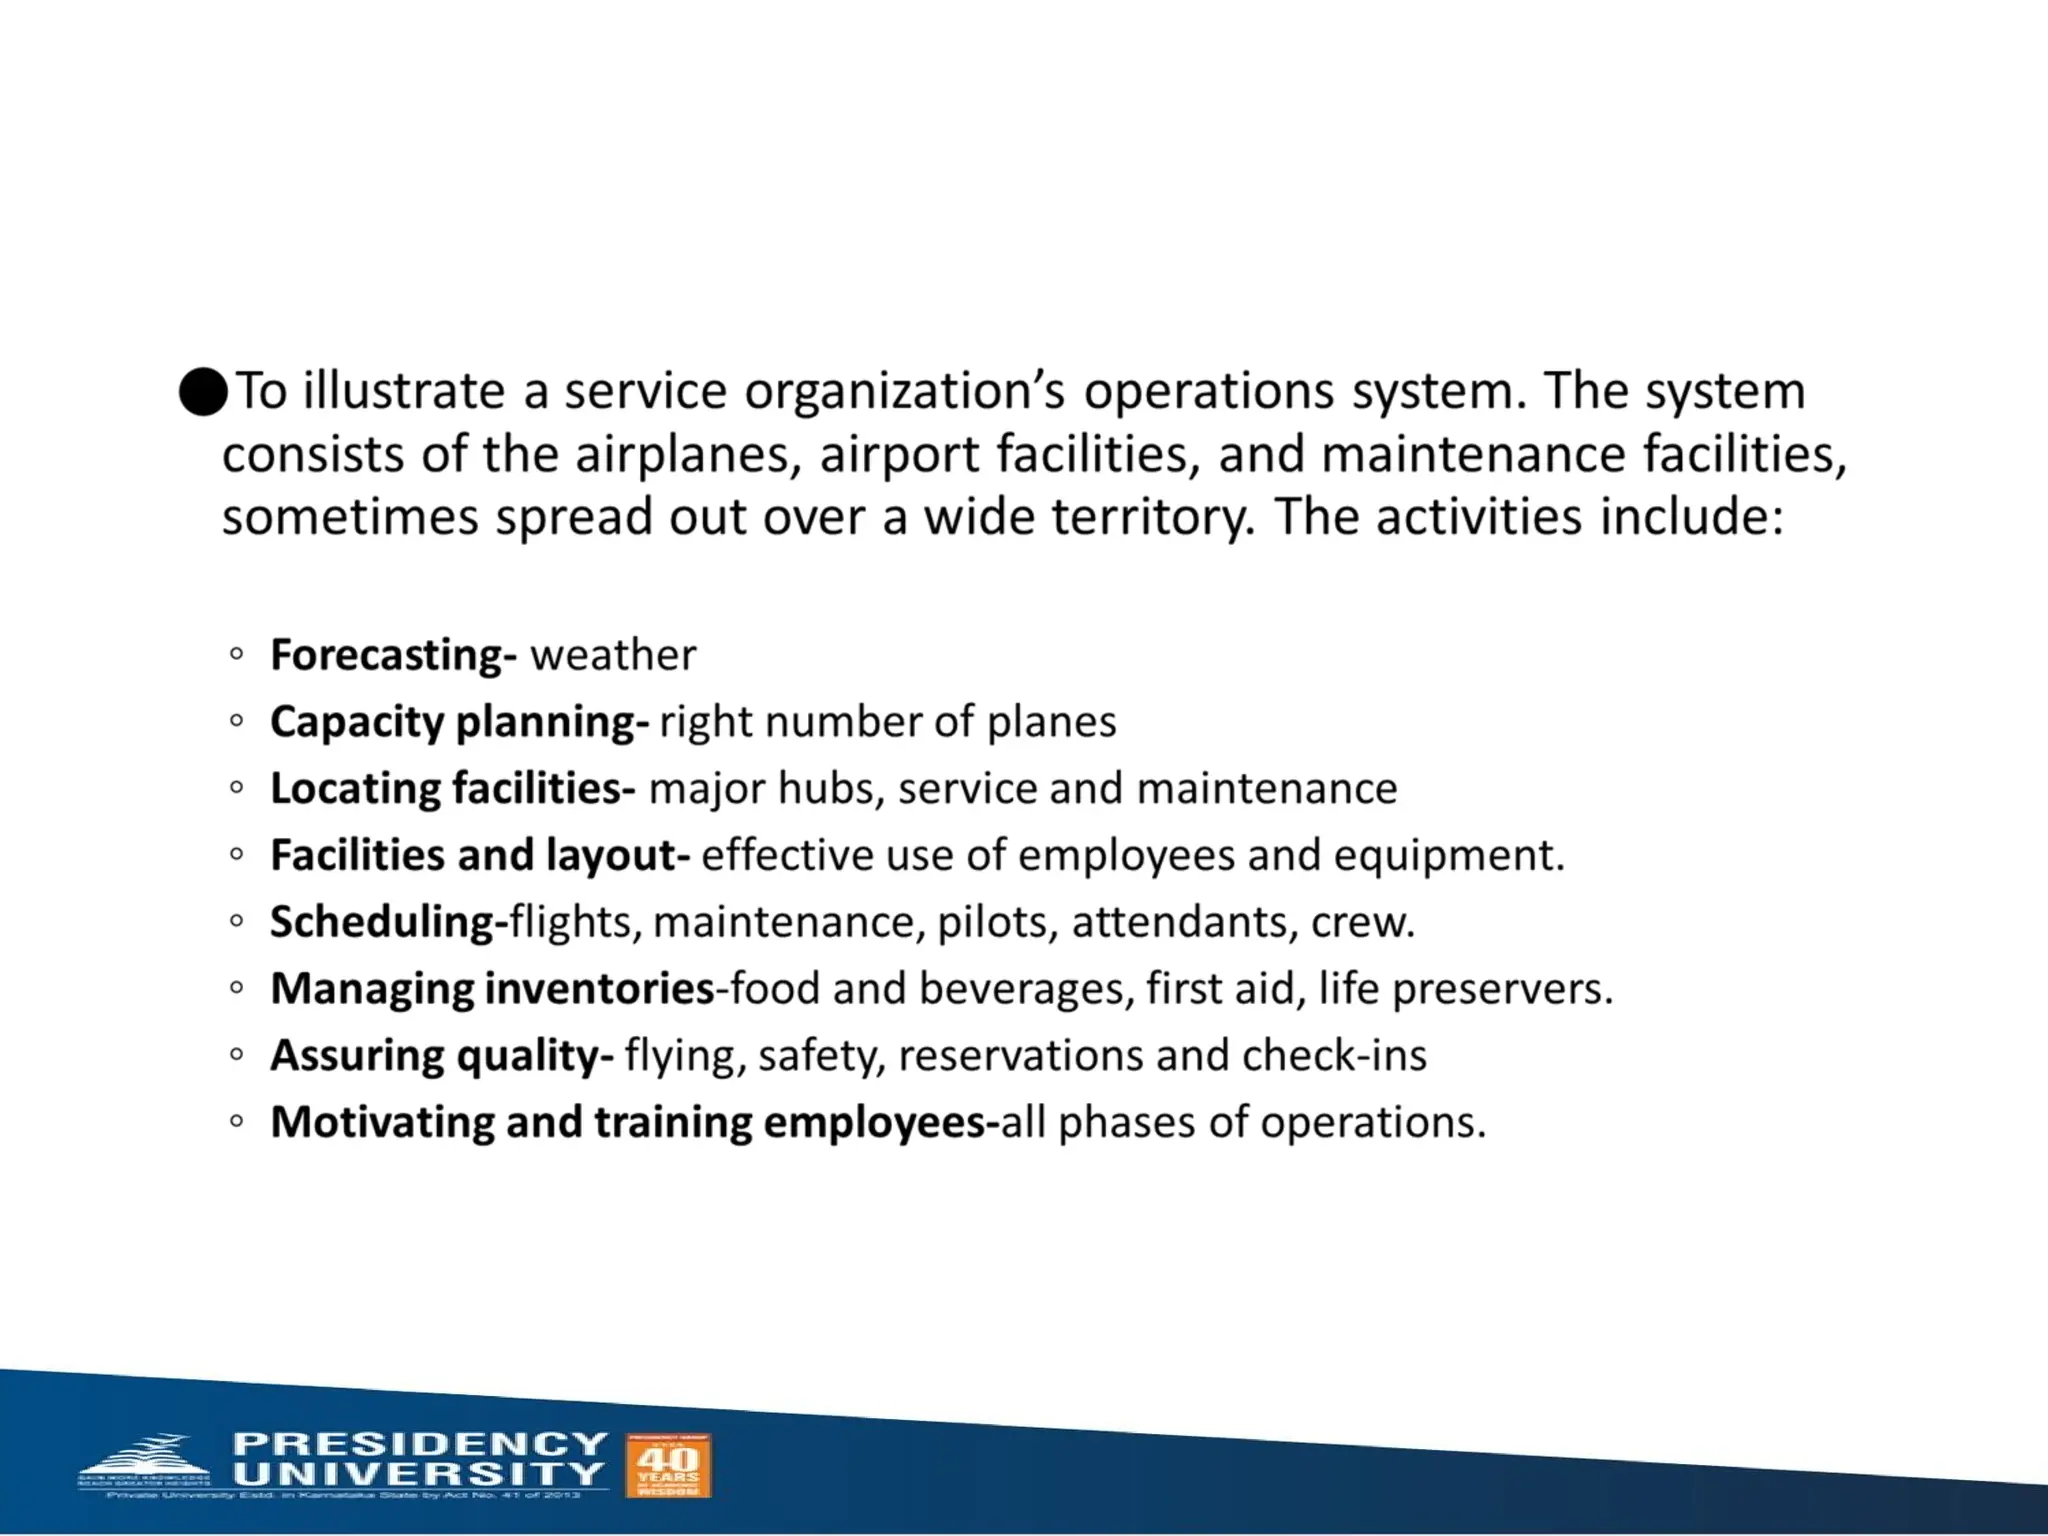
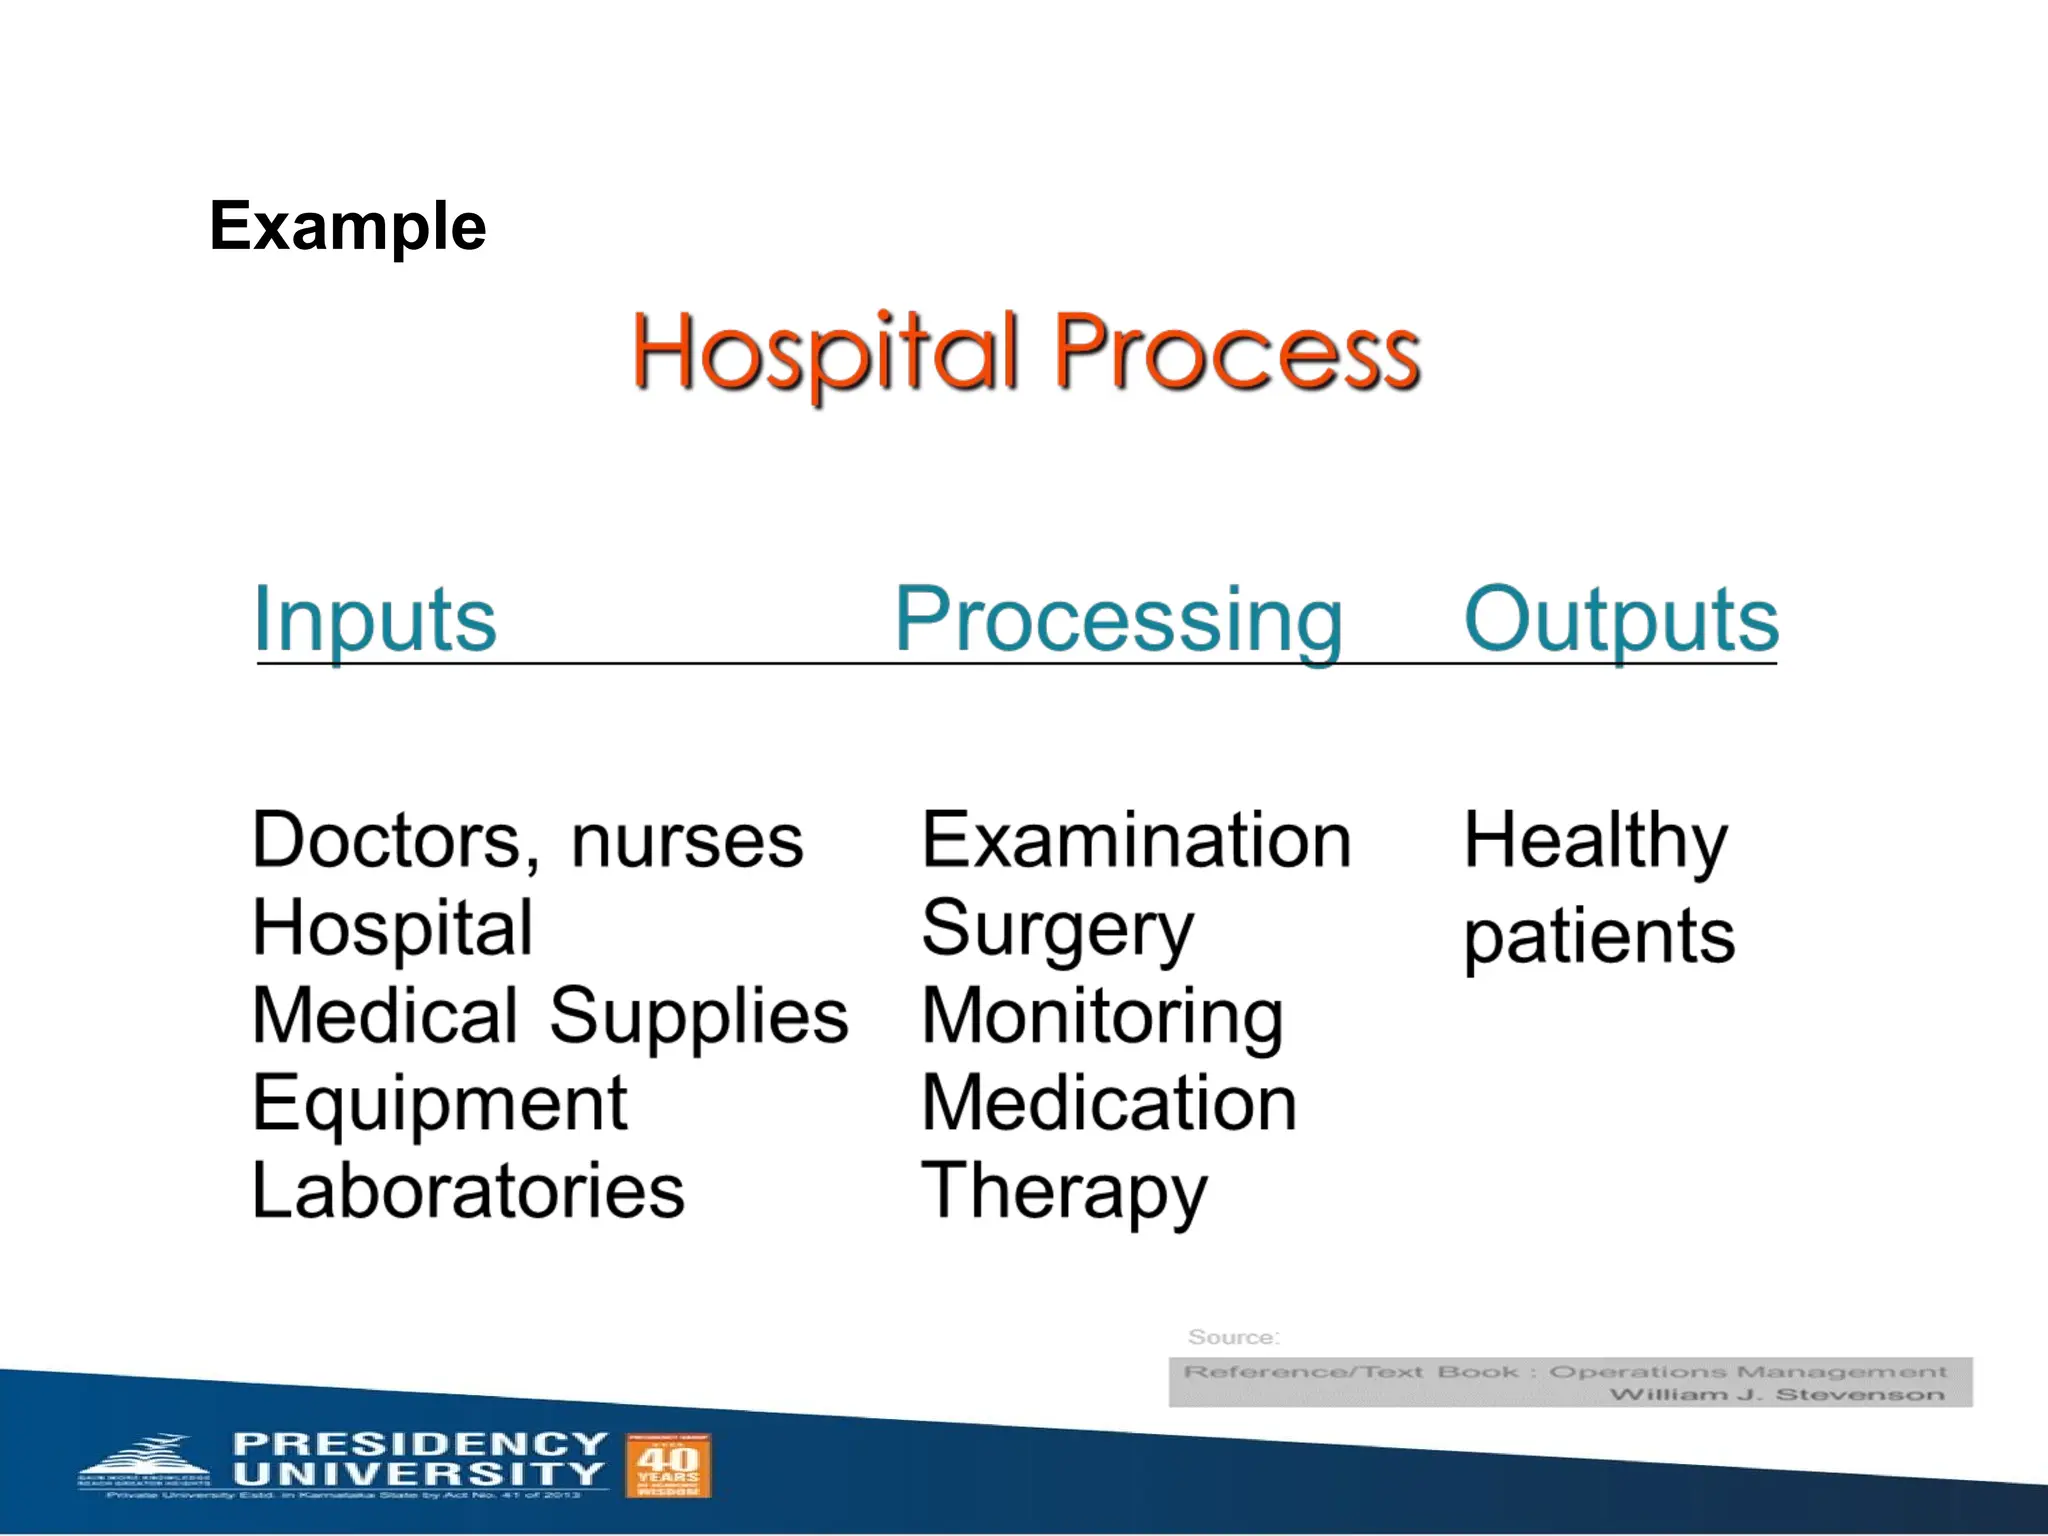
This establishes a foundational understanding that OM is not limited to factories — it applies to both manufacturing and service sectors, such as airlines, banking, retail, and logistics.
⸻
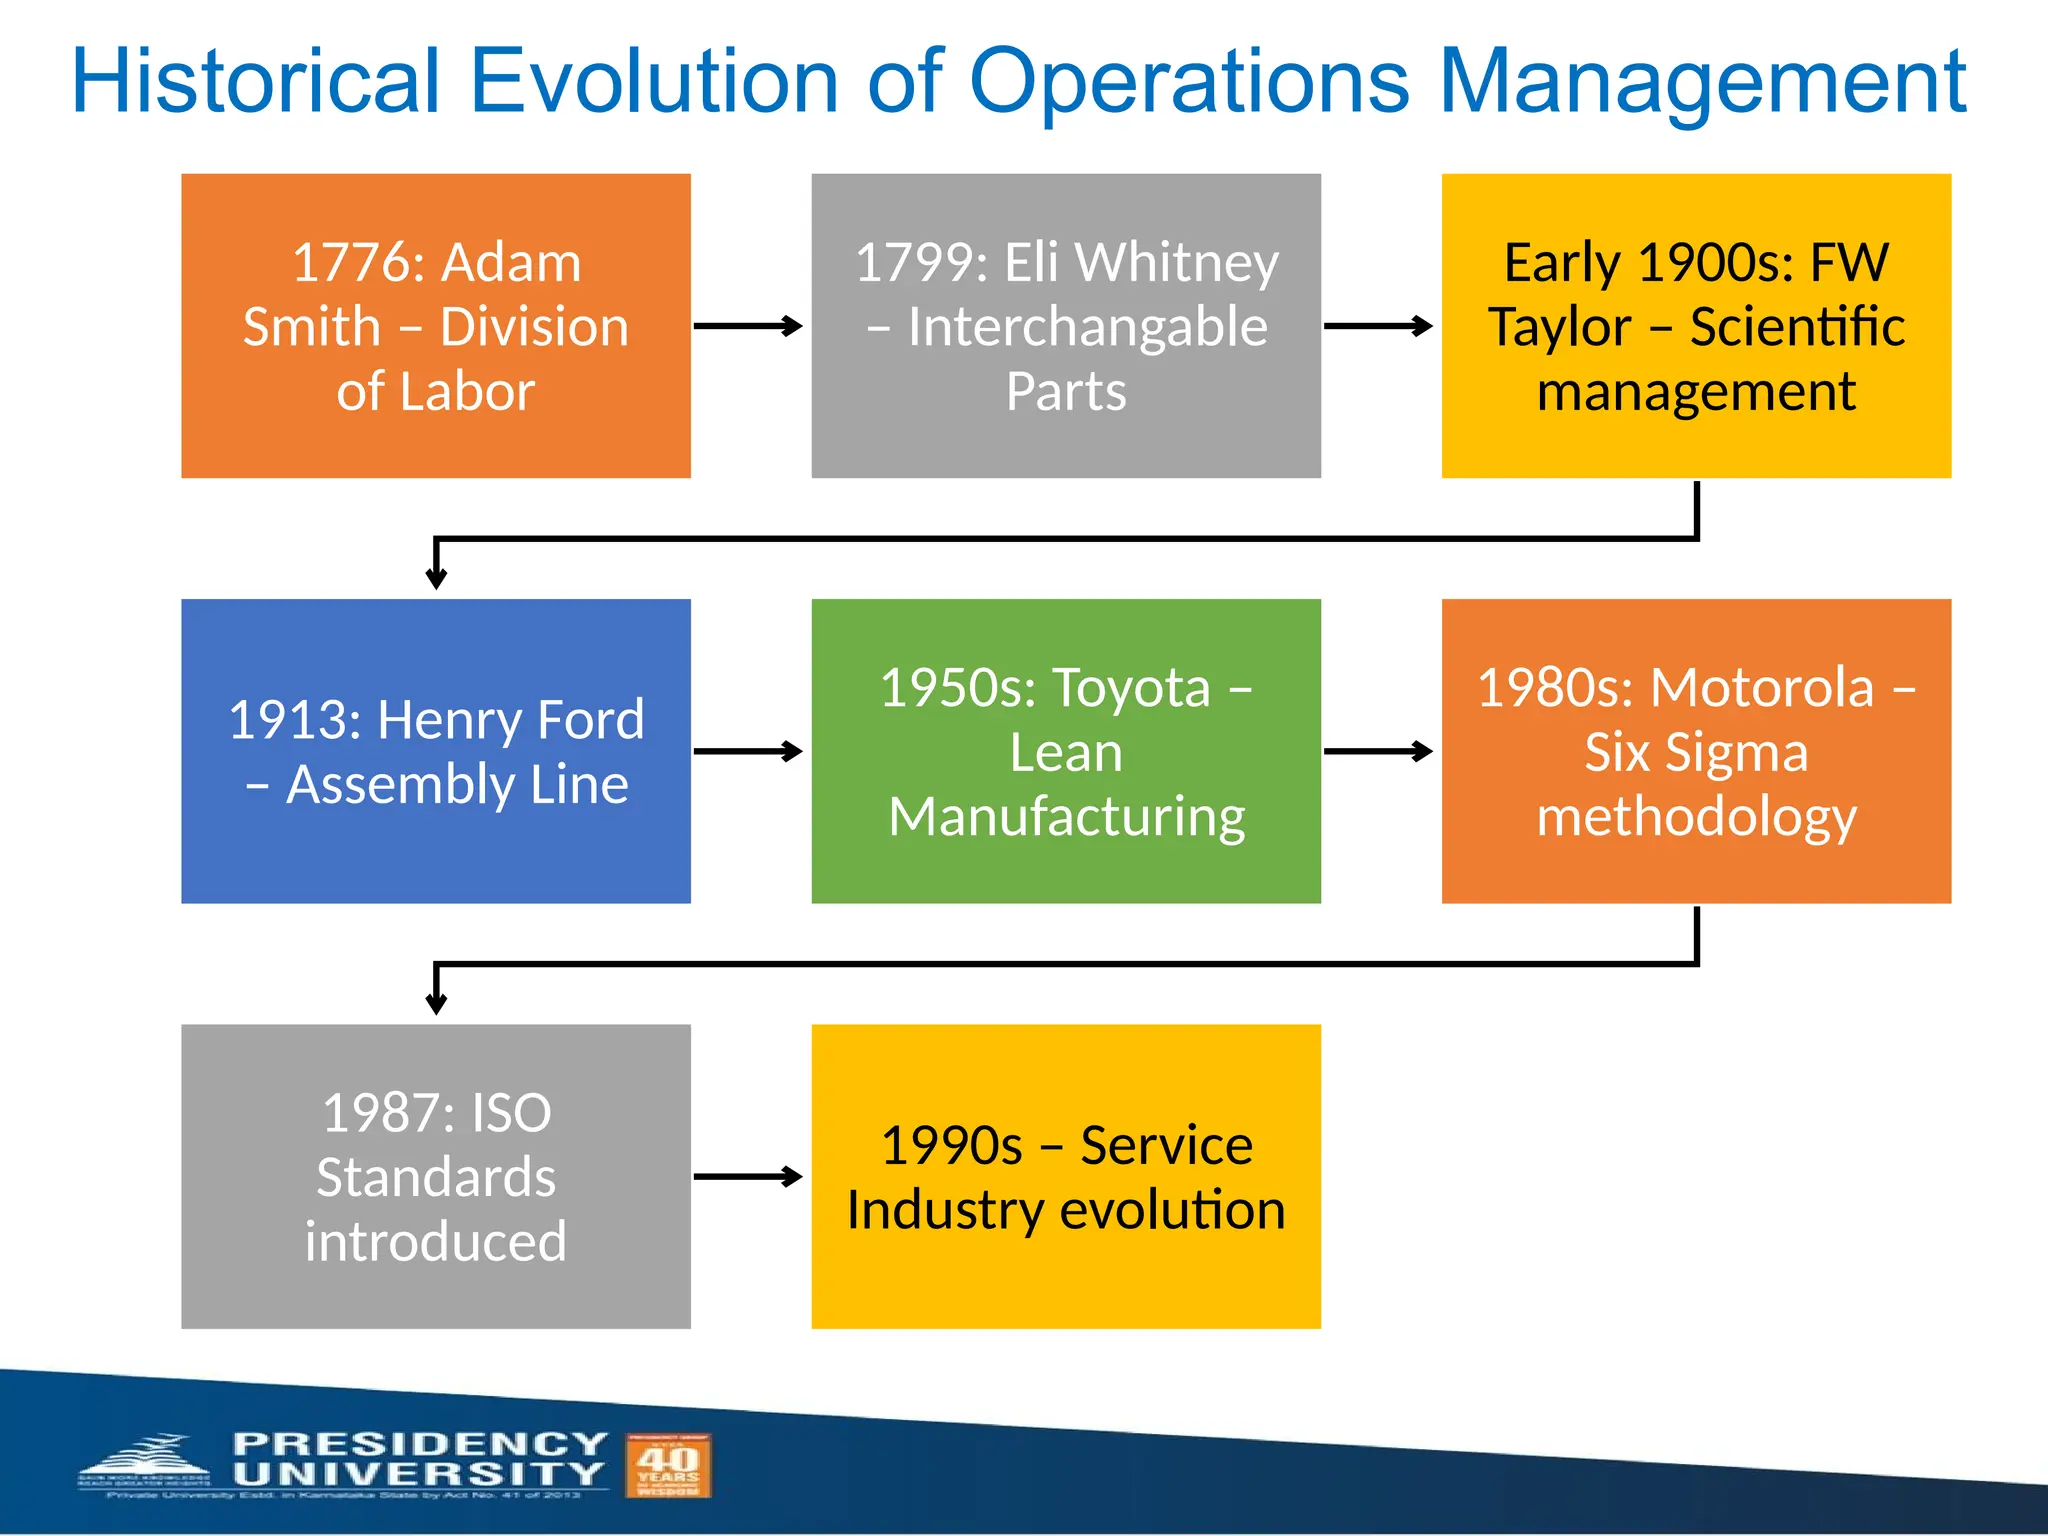
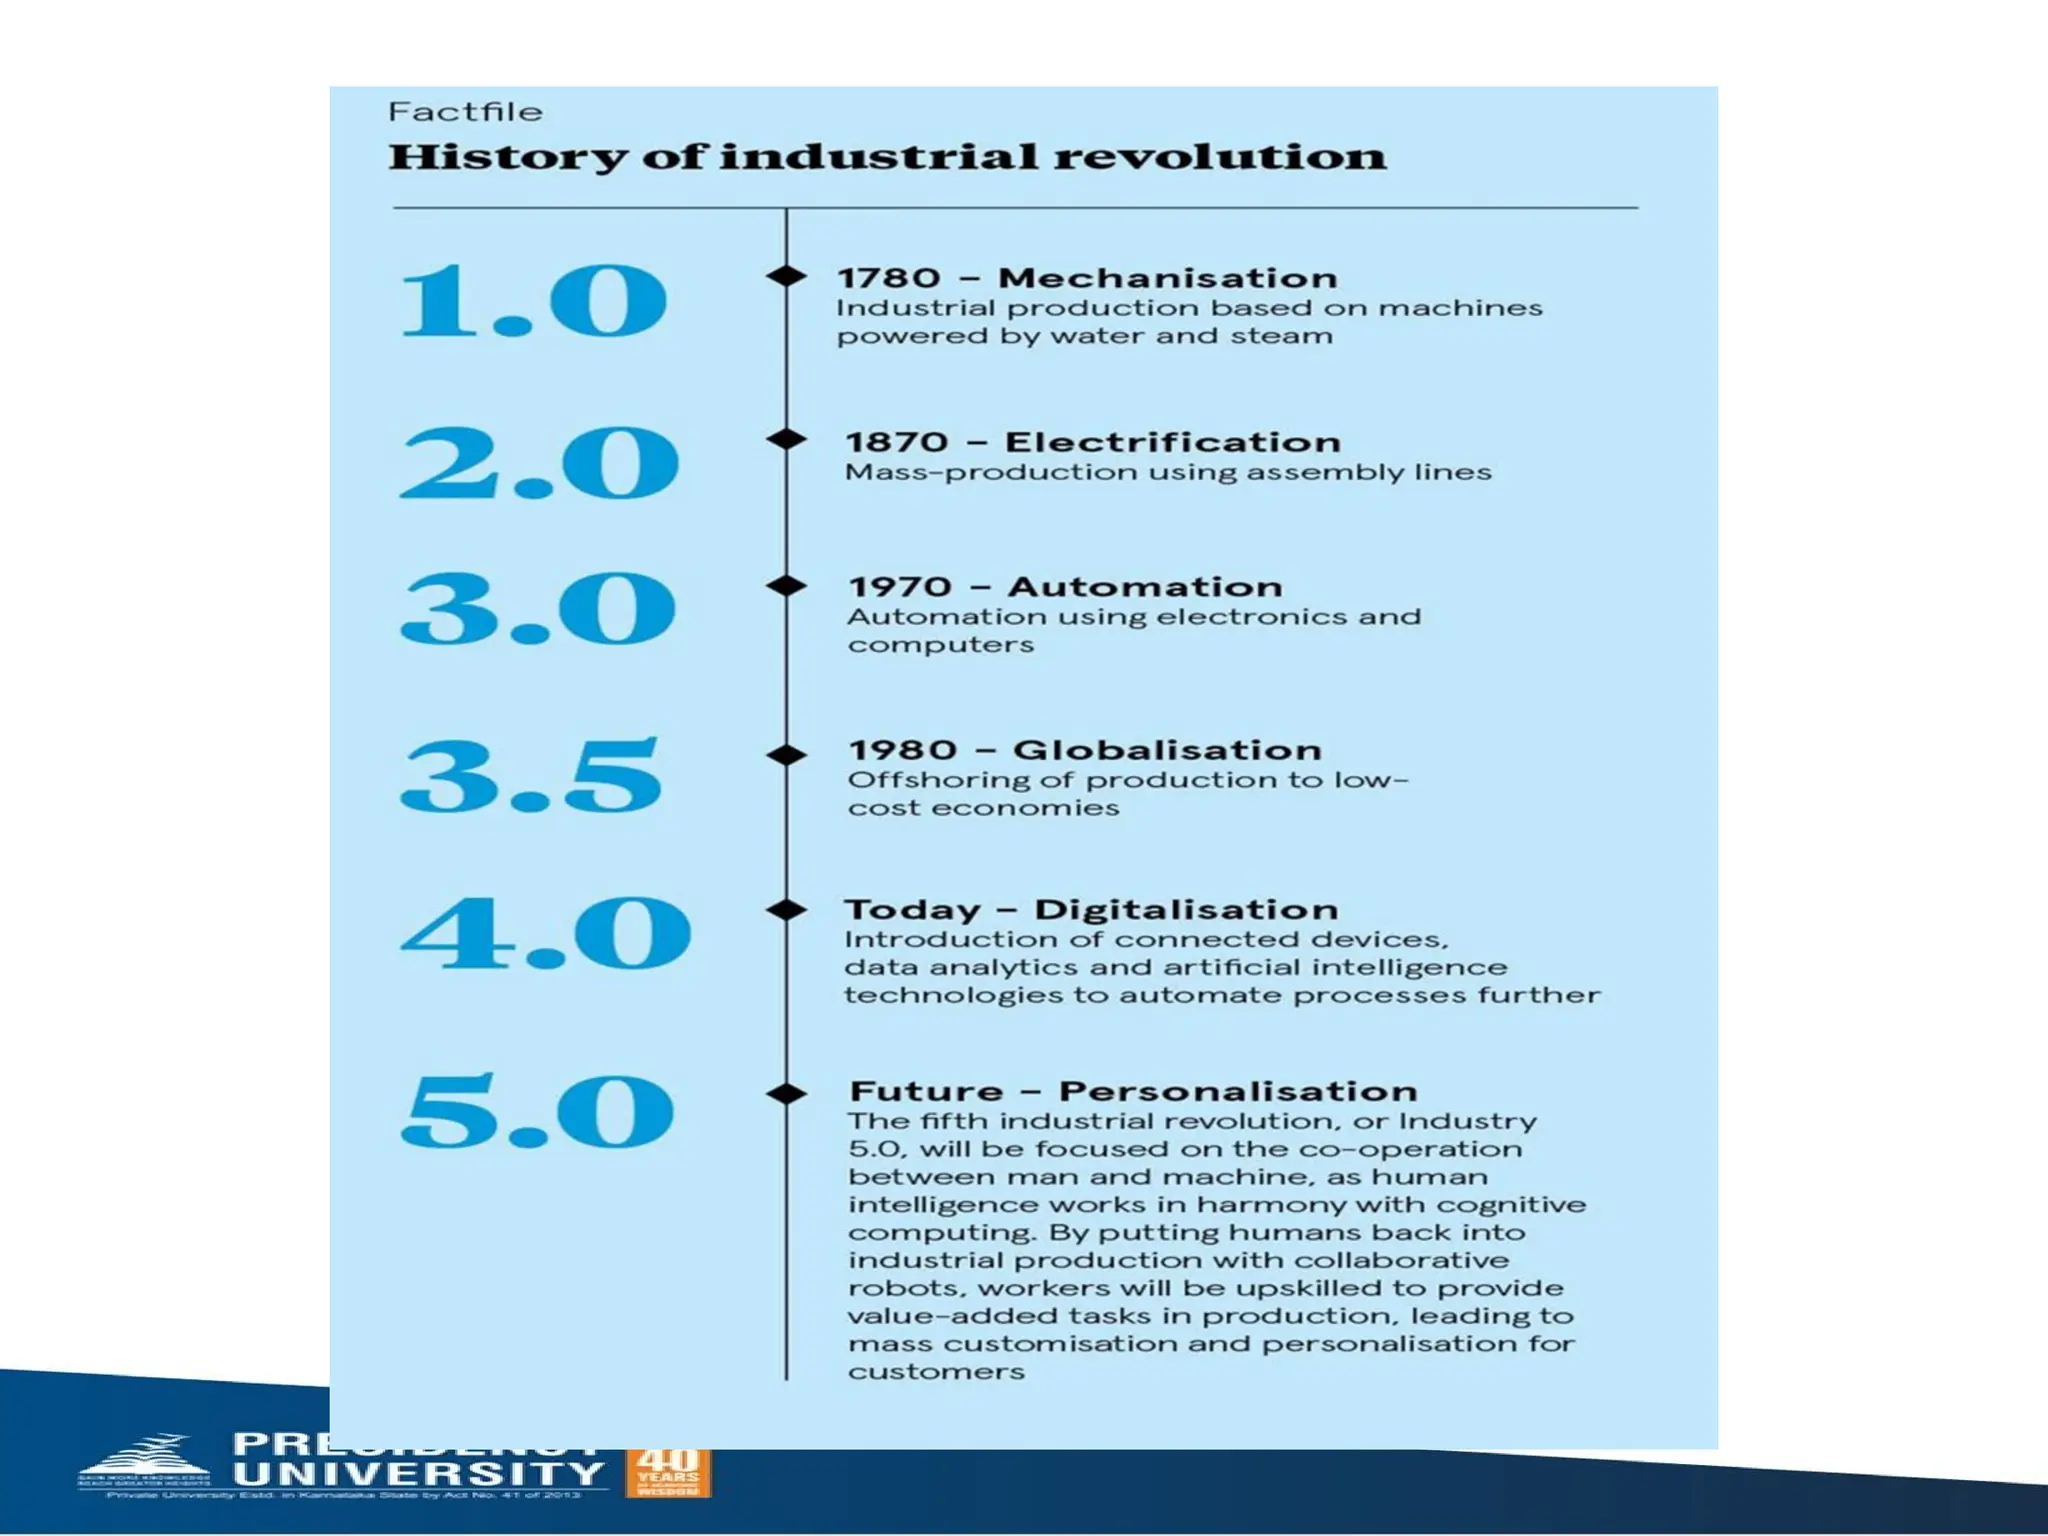
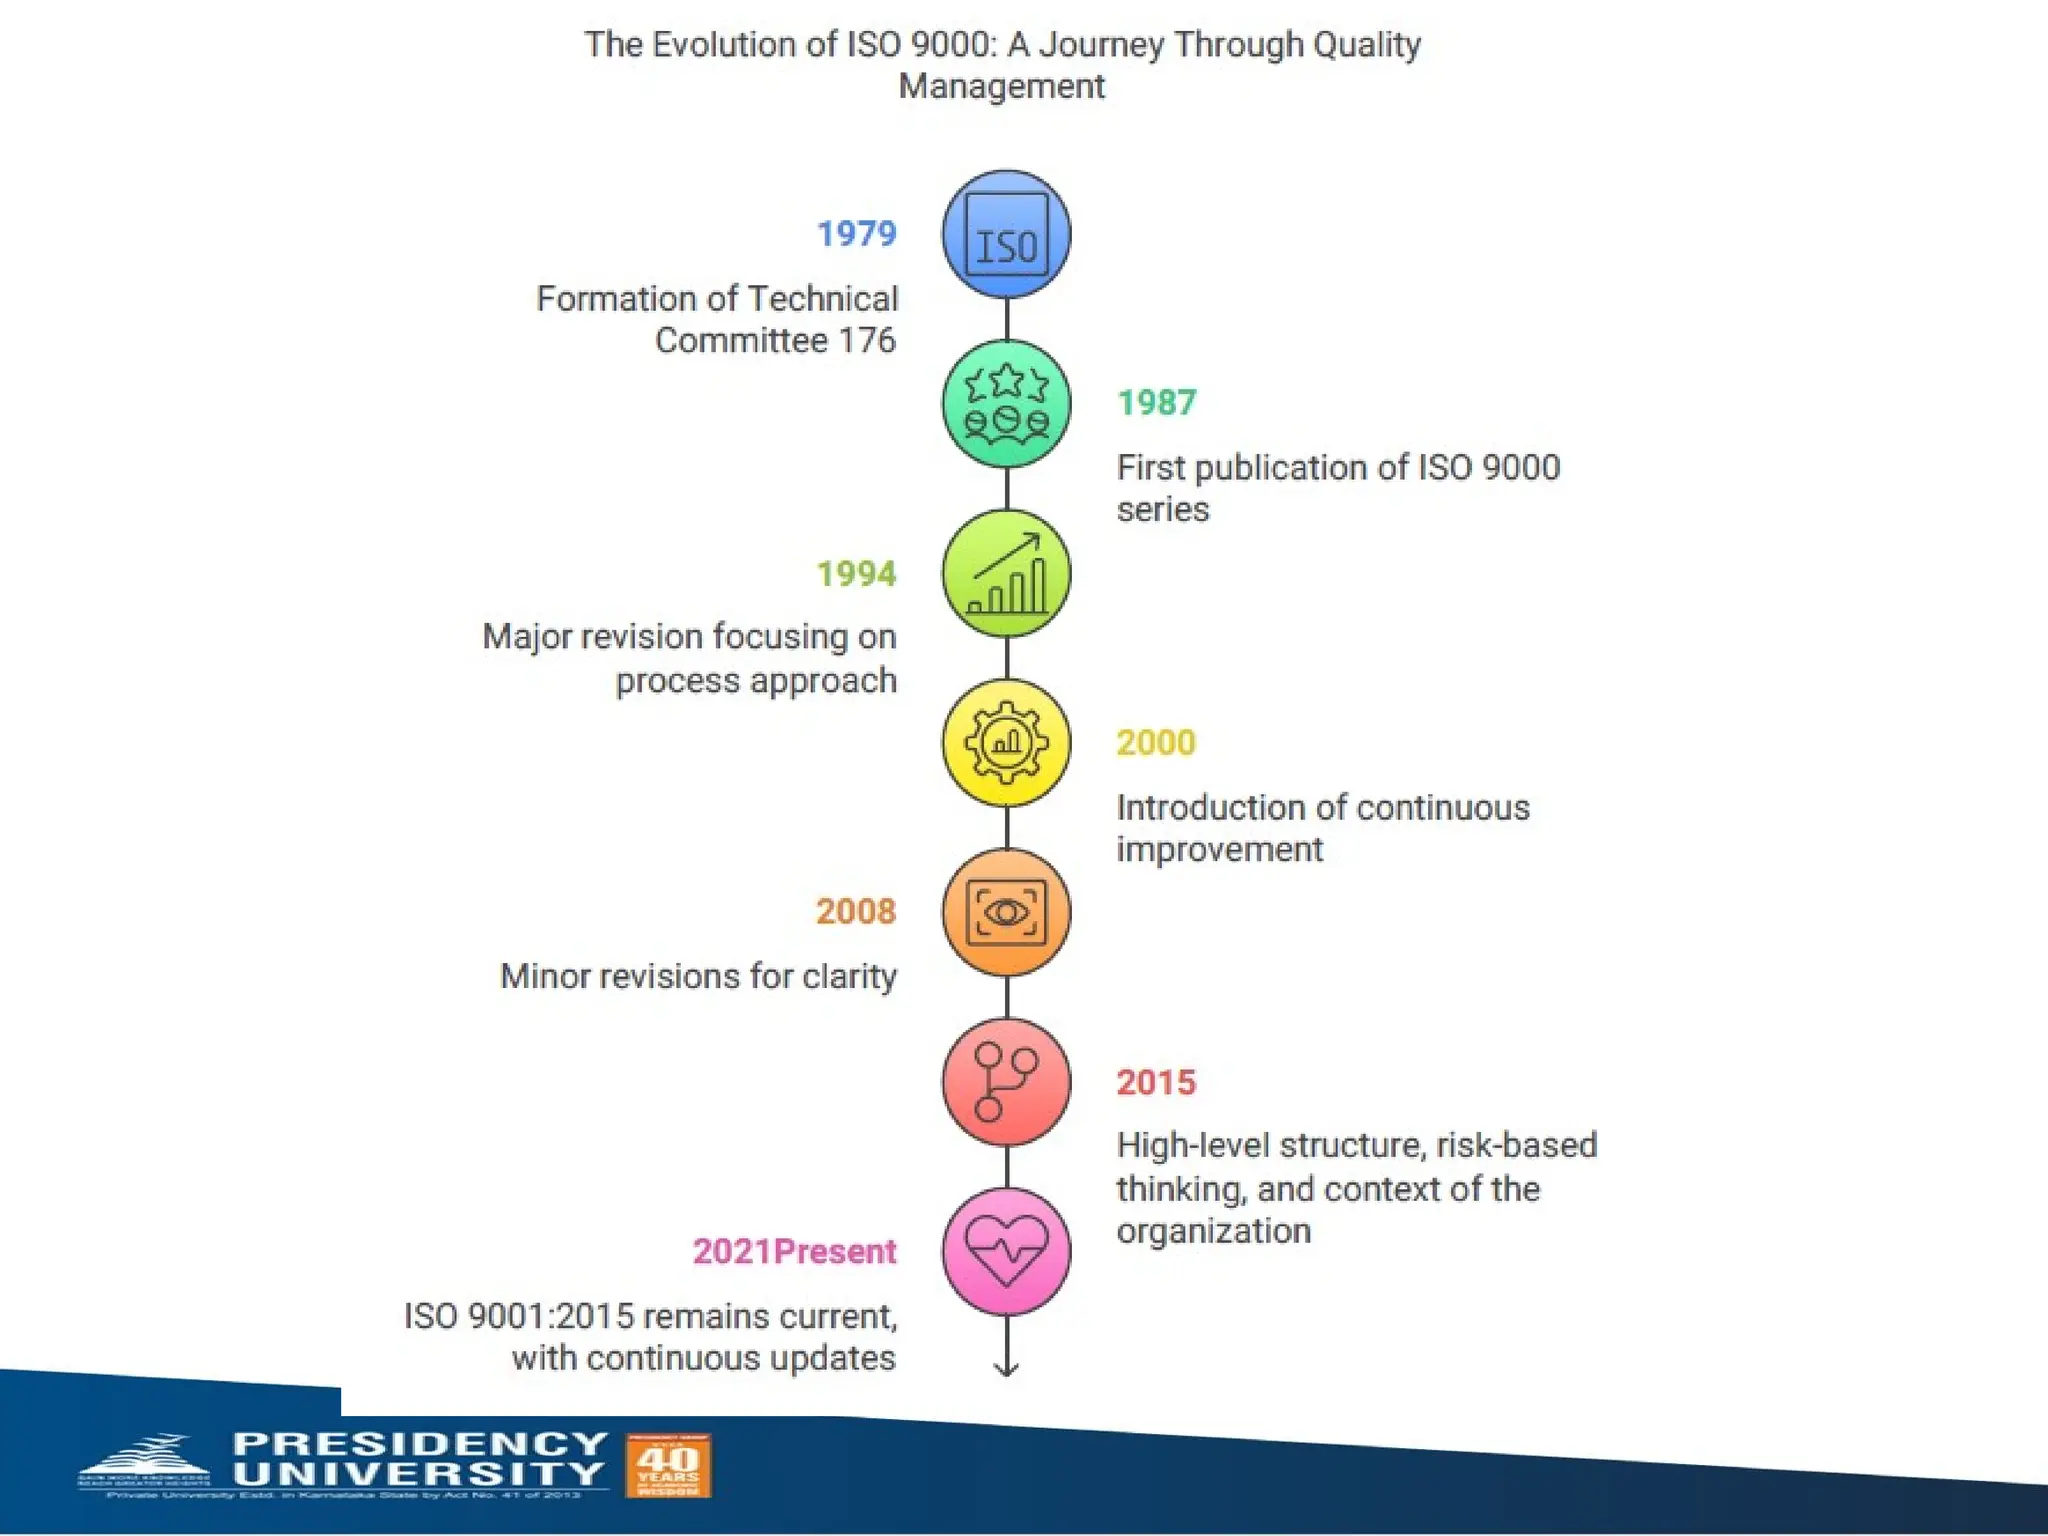
2. Historical Evolution of Operations Management
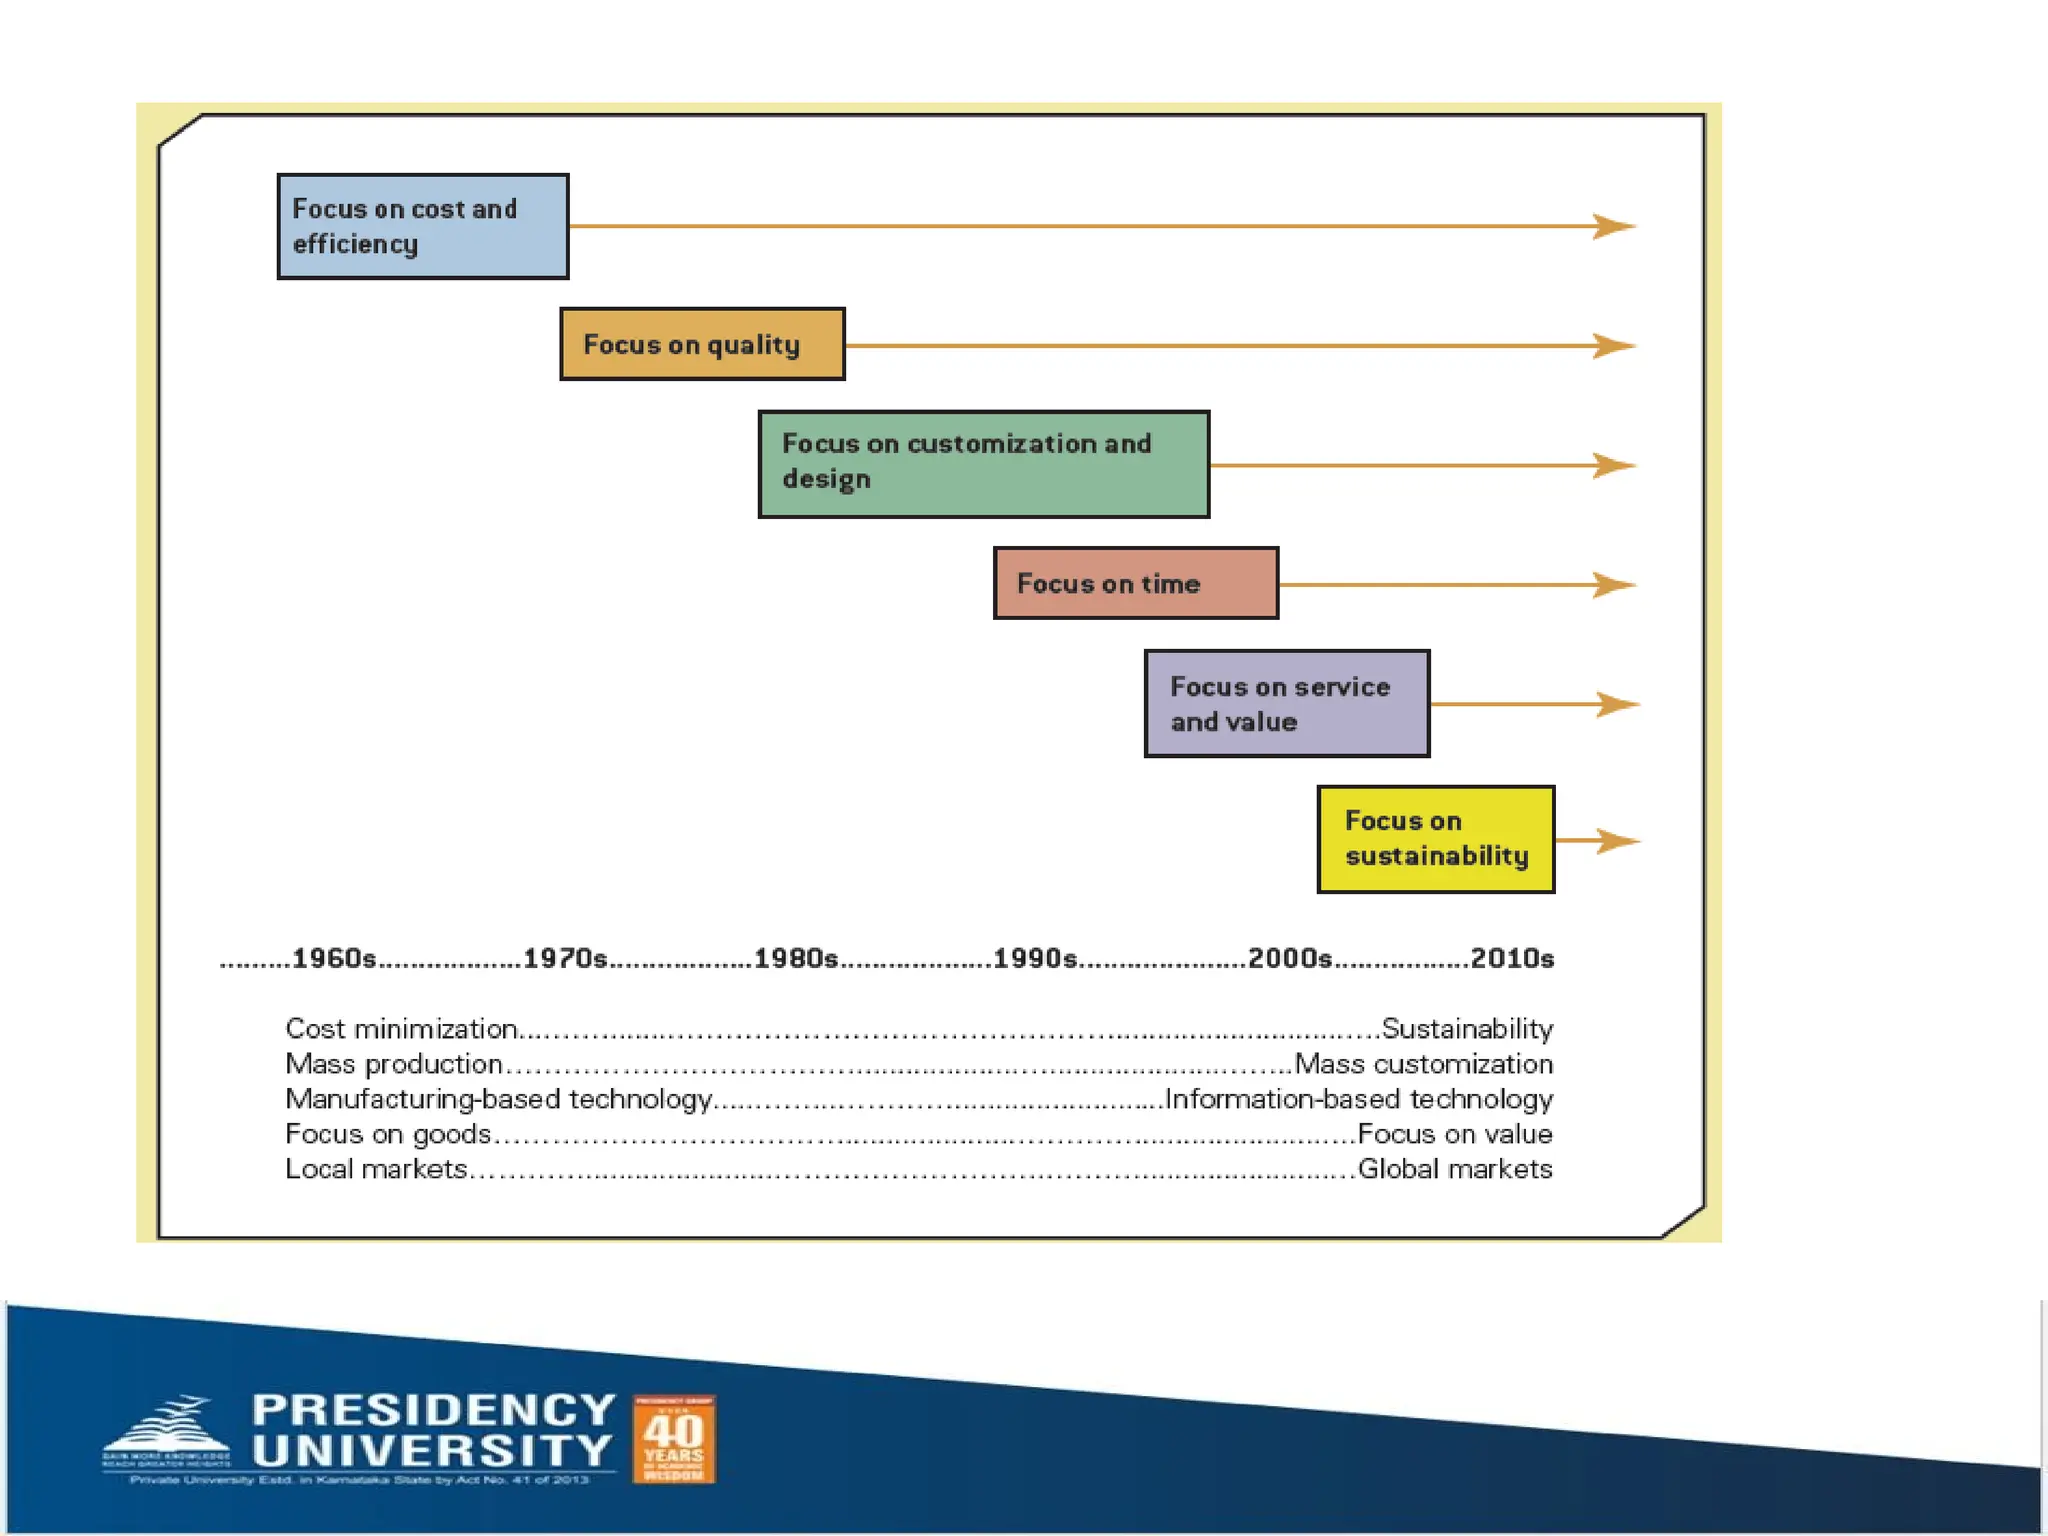
The presentation provides a chronological breakdown of how operations management evolved over two centuries:
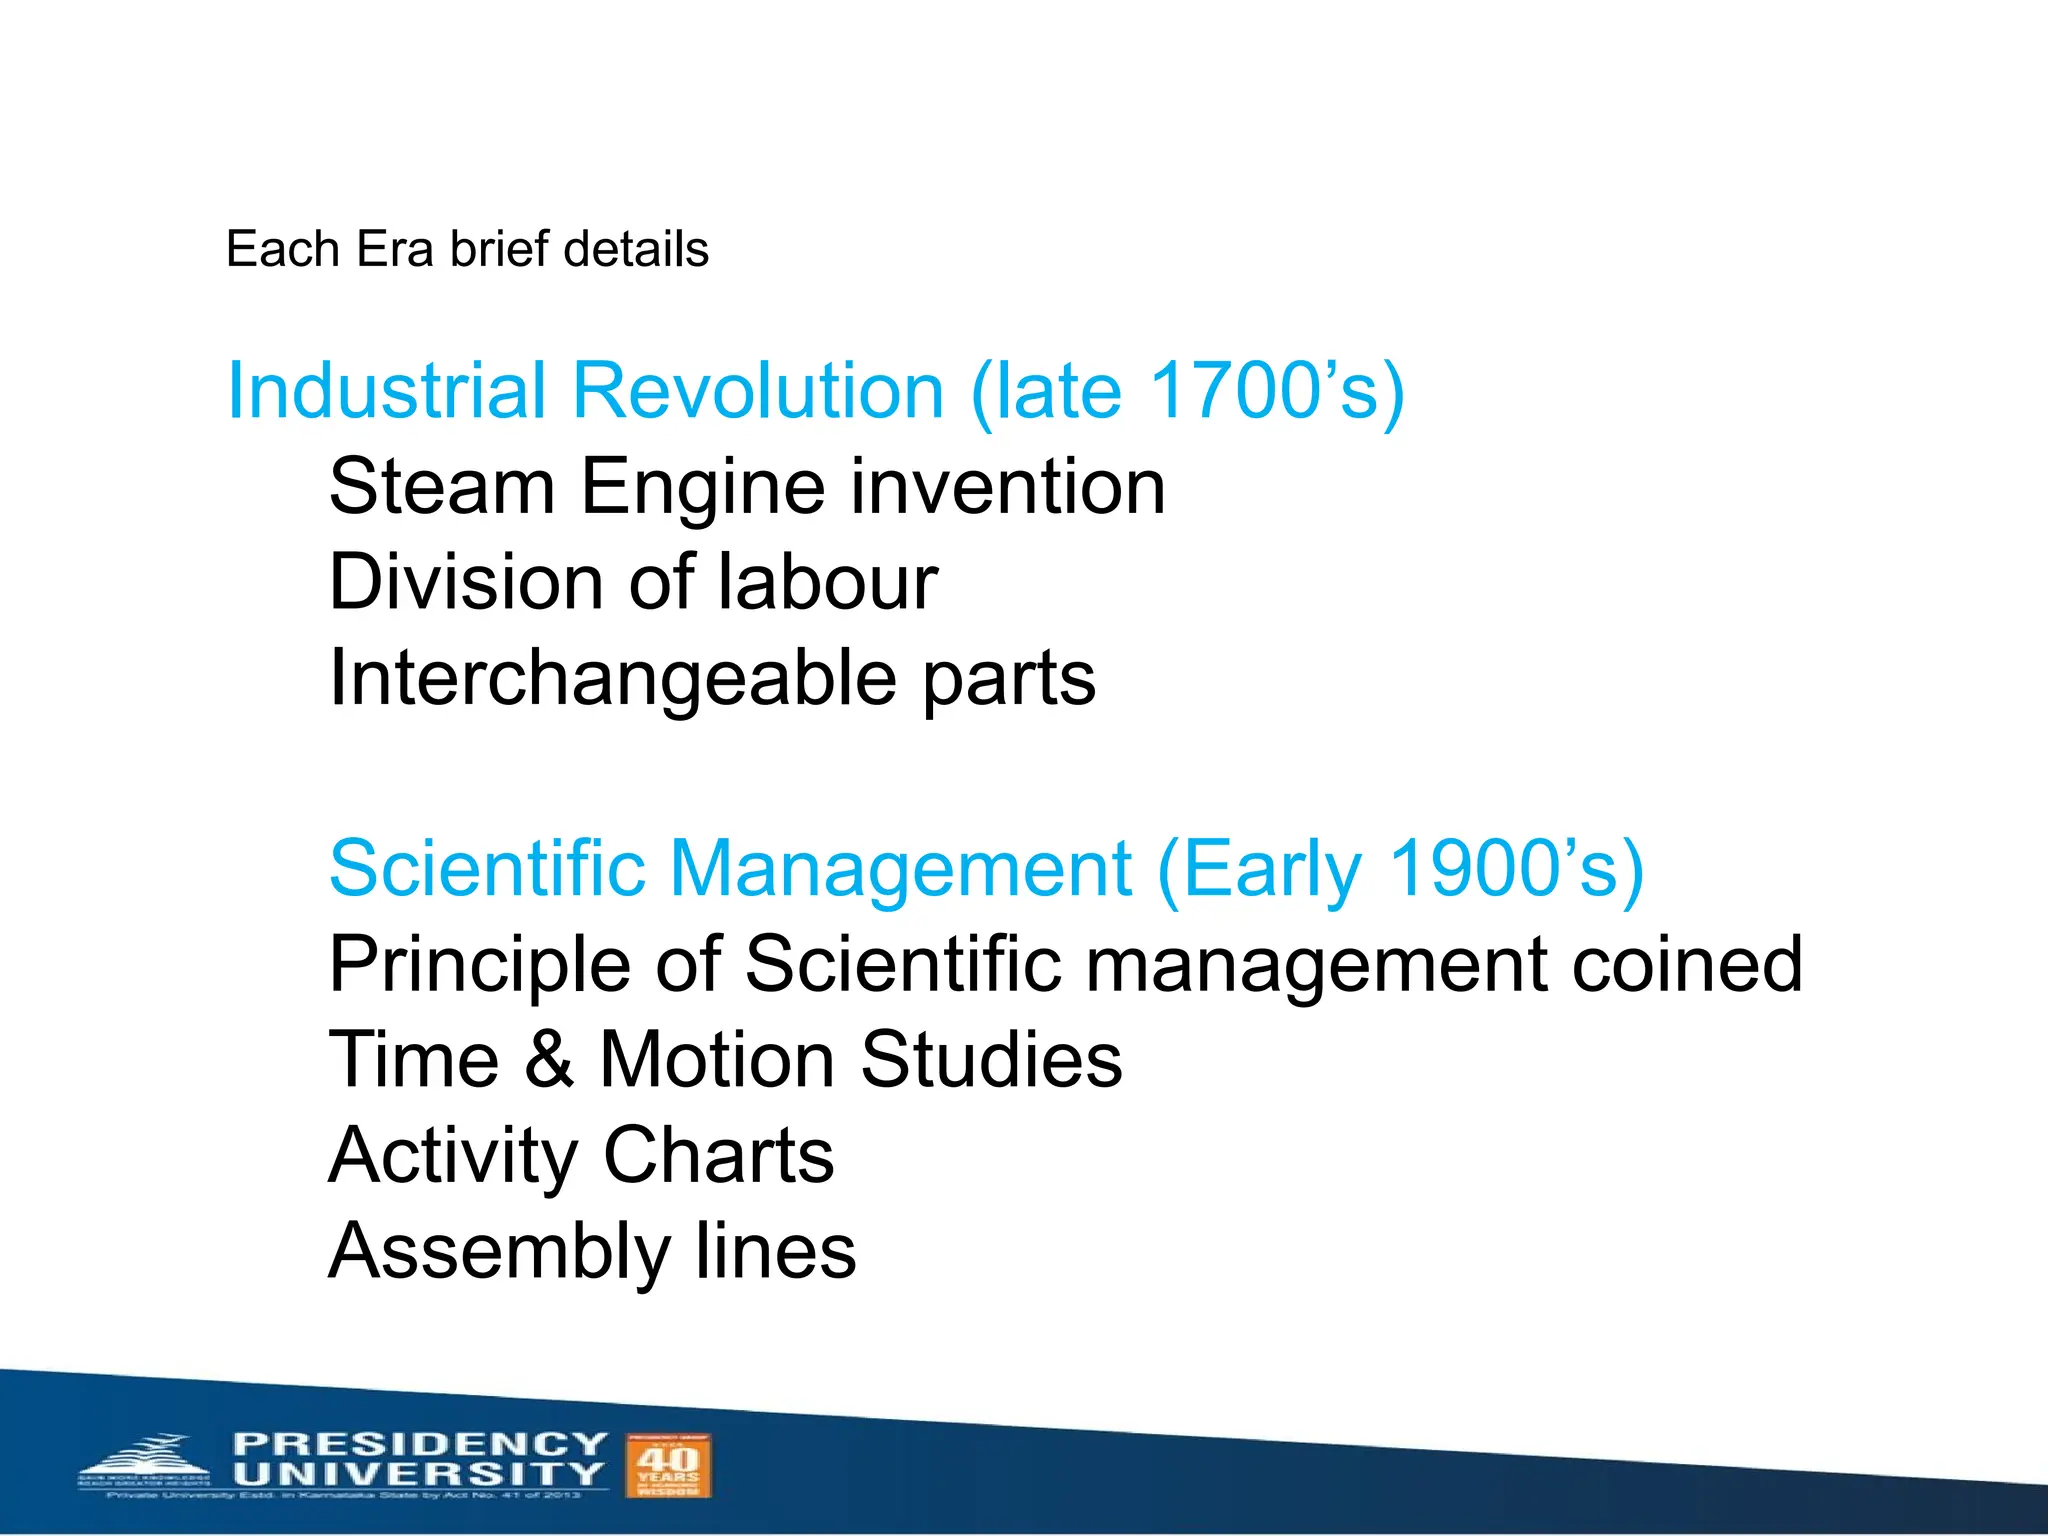
a. Industrial Revolution (Late 1700s)
• Steam engine invention
• Division of labour
• Standardized, interchangeable parts
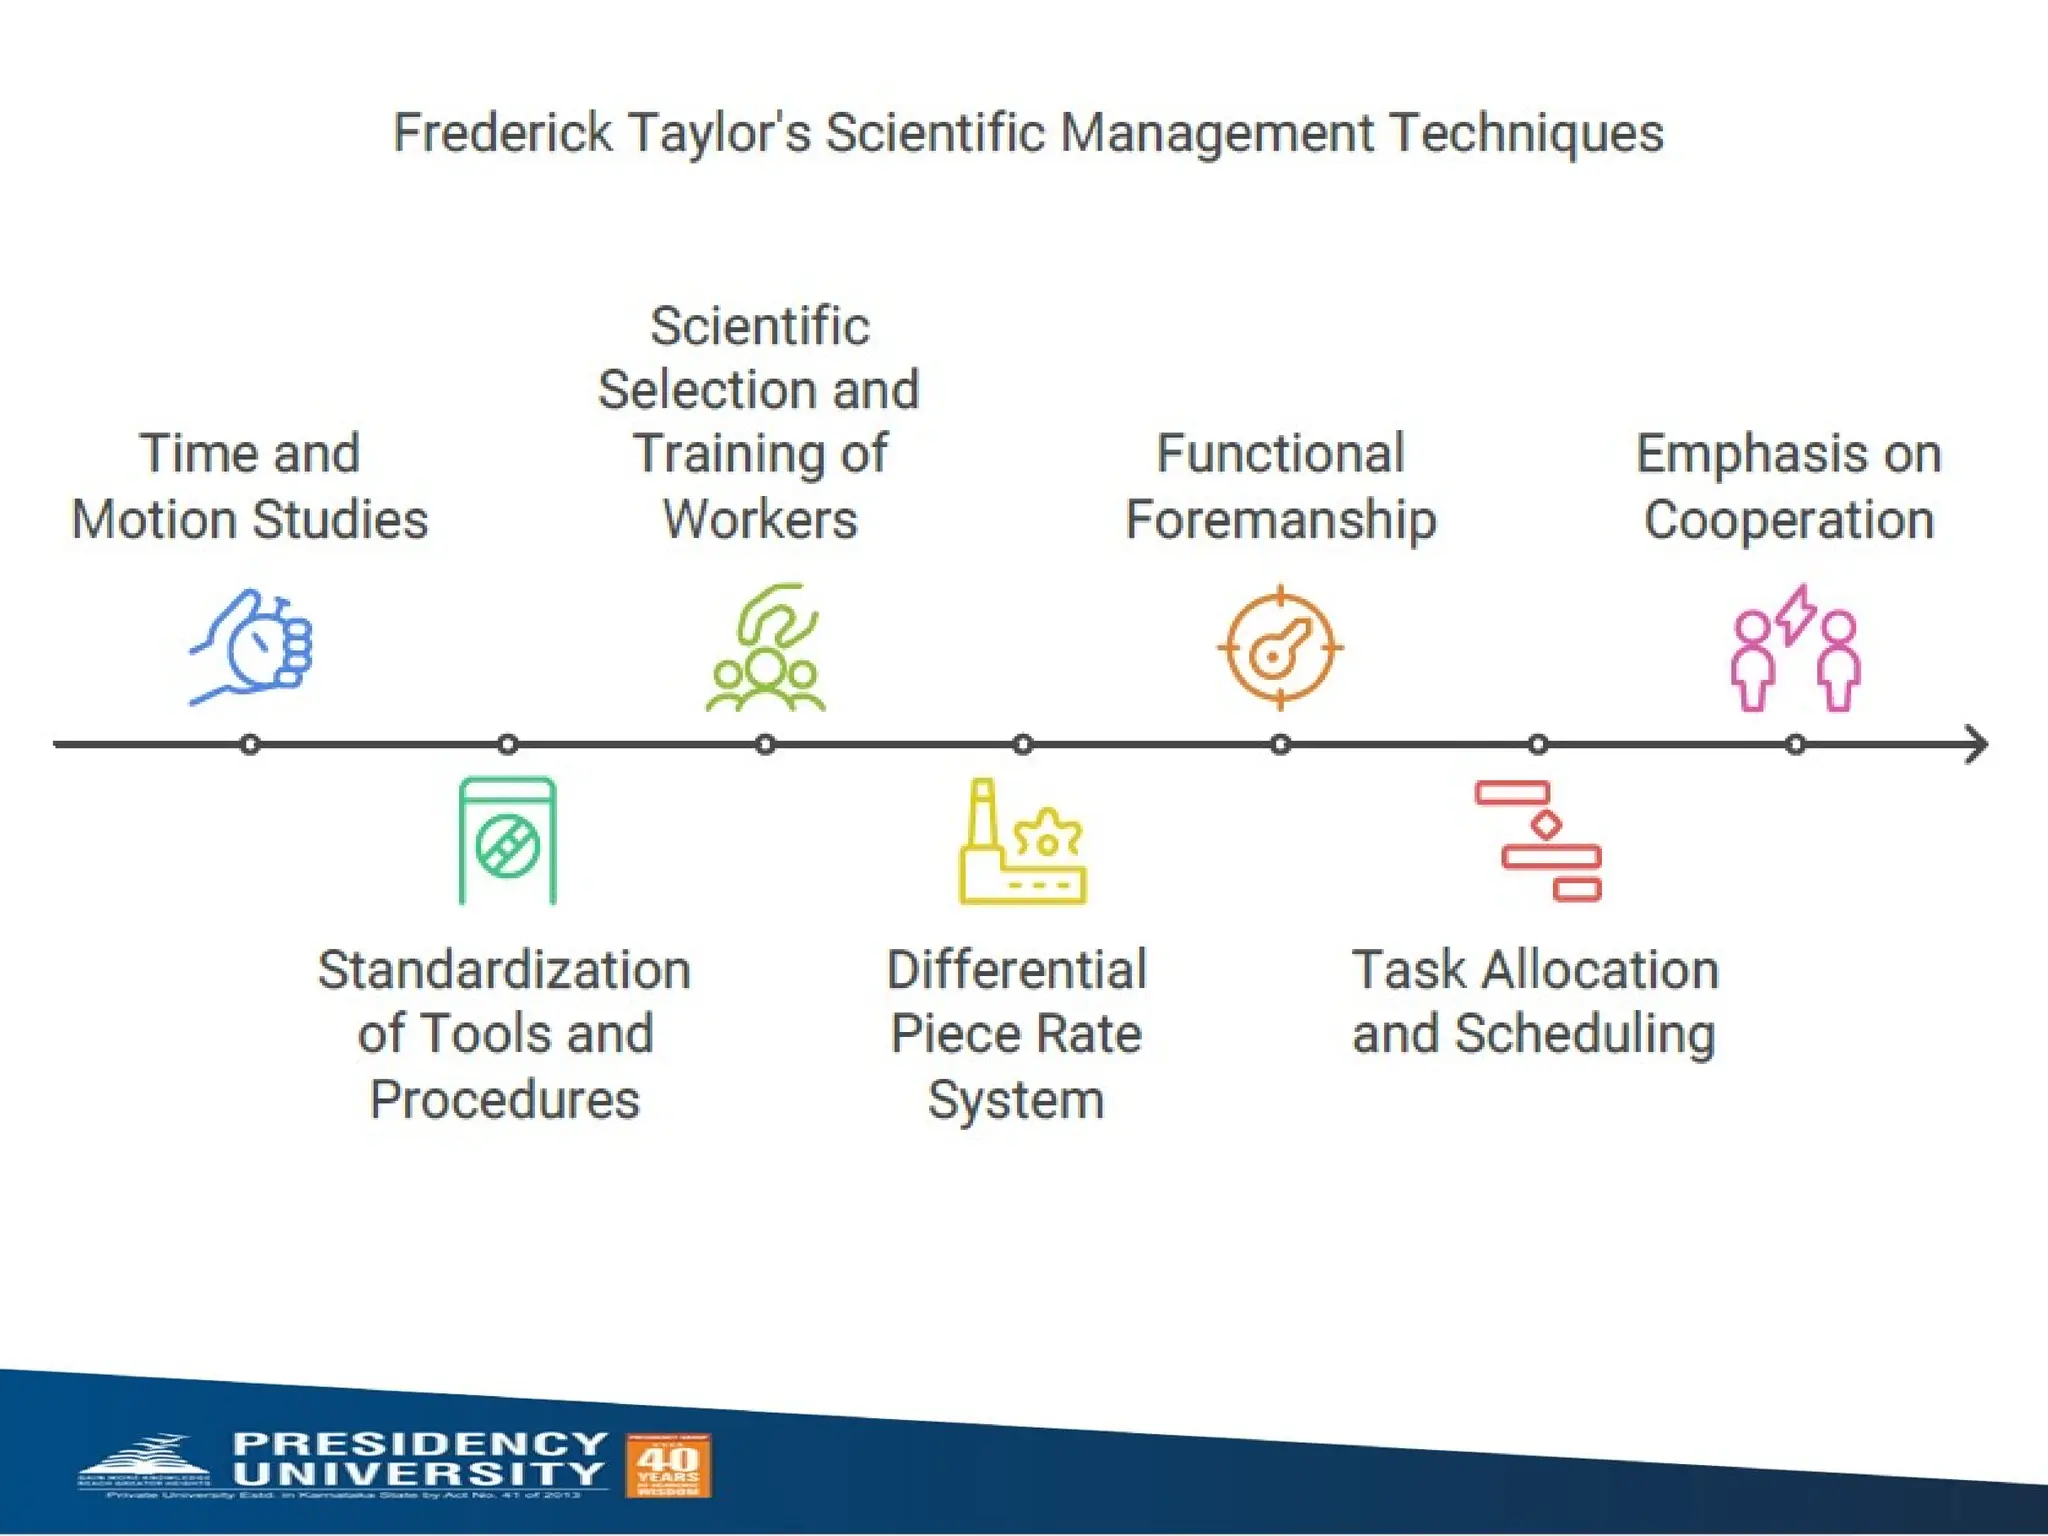
b. Scientific Management (Early 1900s)
• Principles developed by Frederick Taylor
• Time-and-motion studies
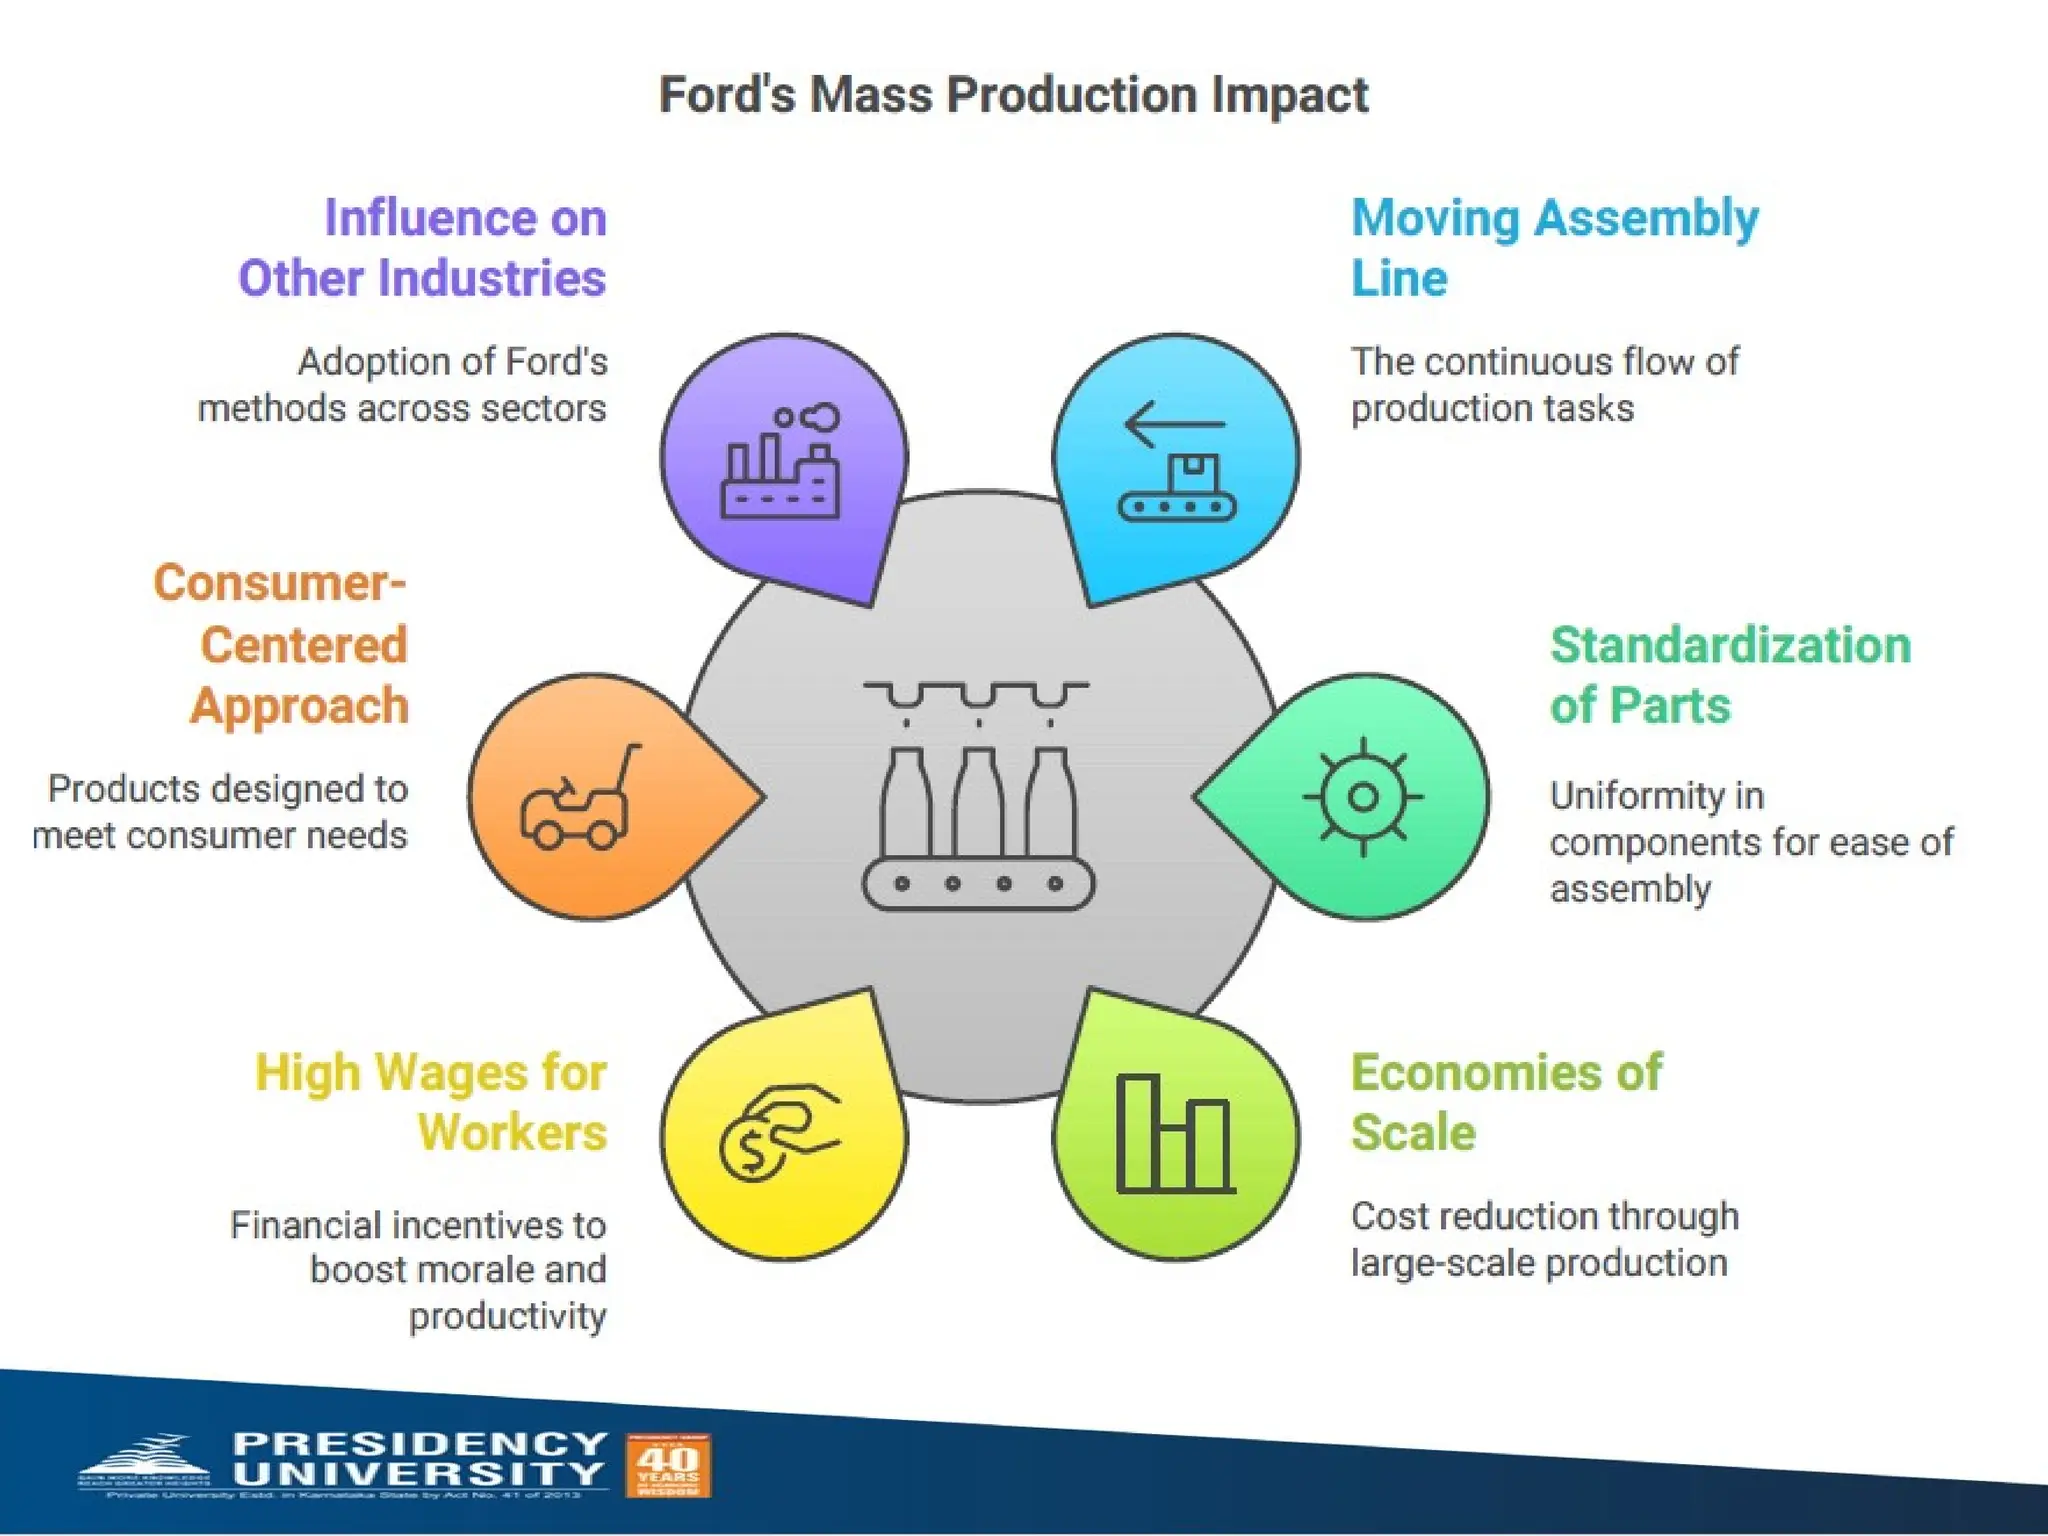
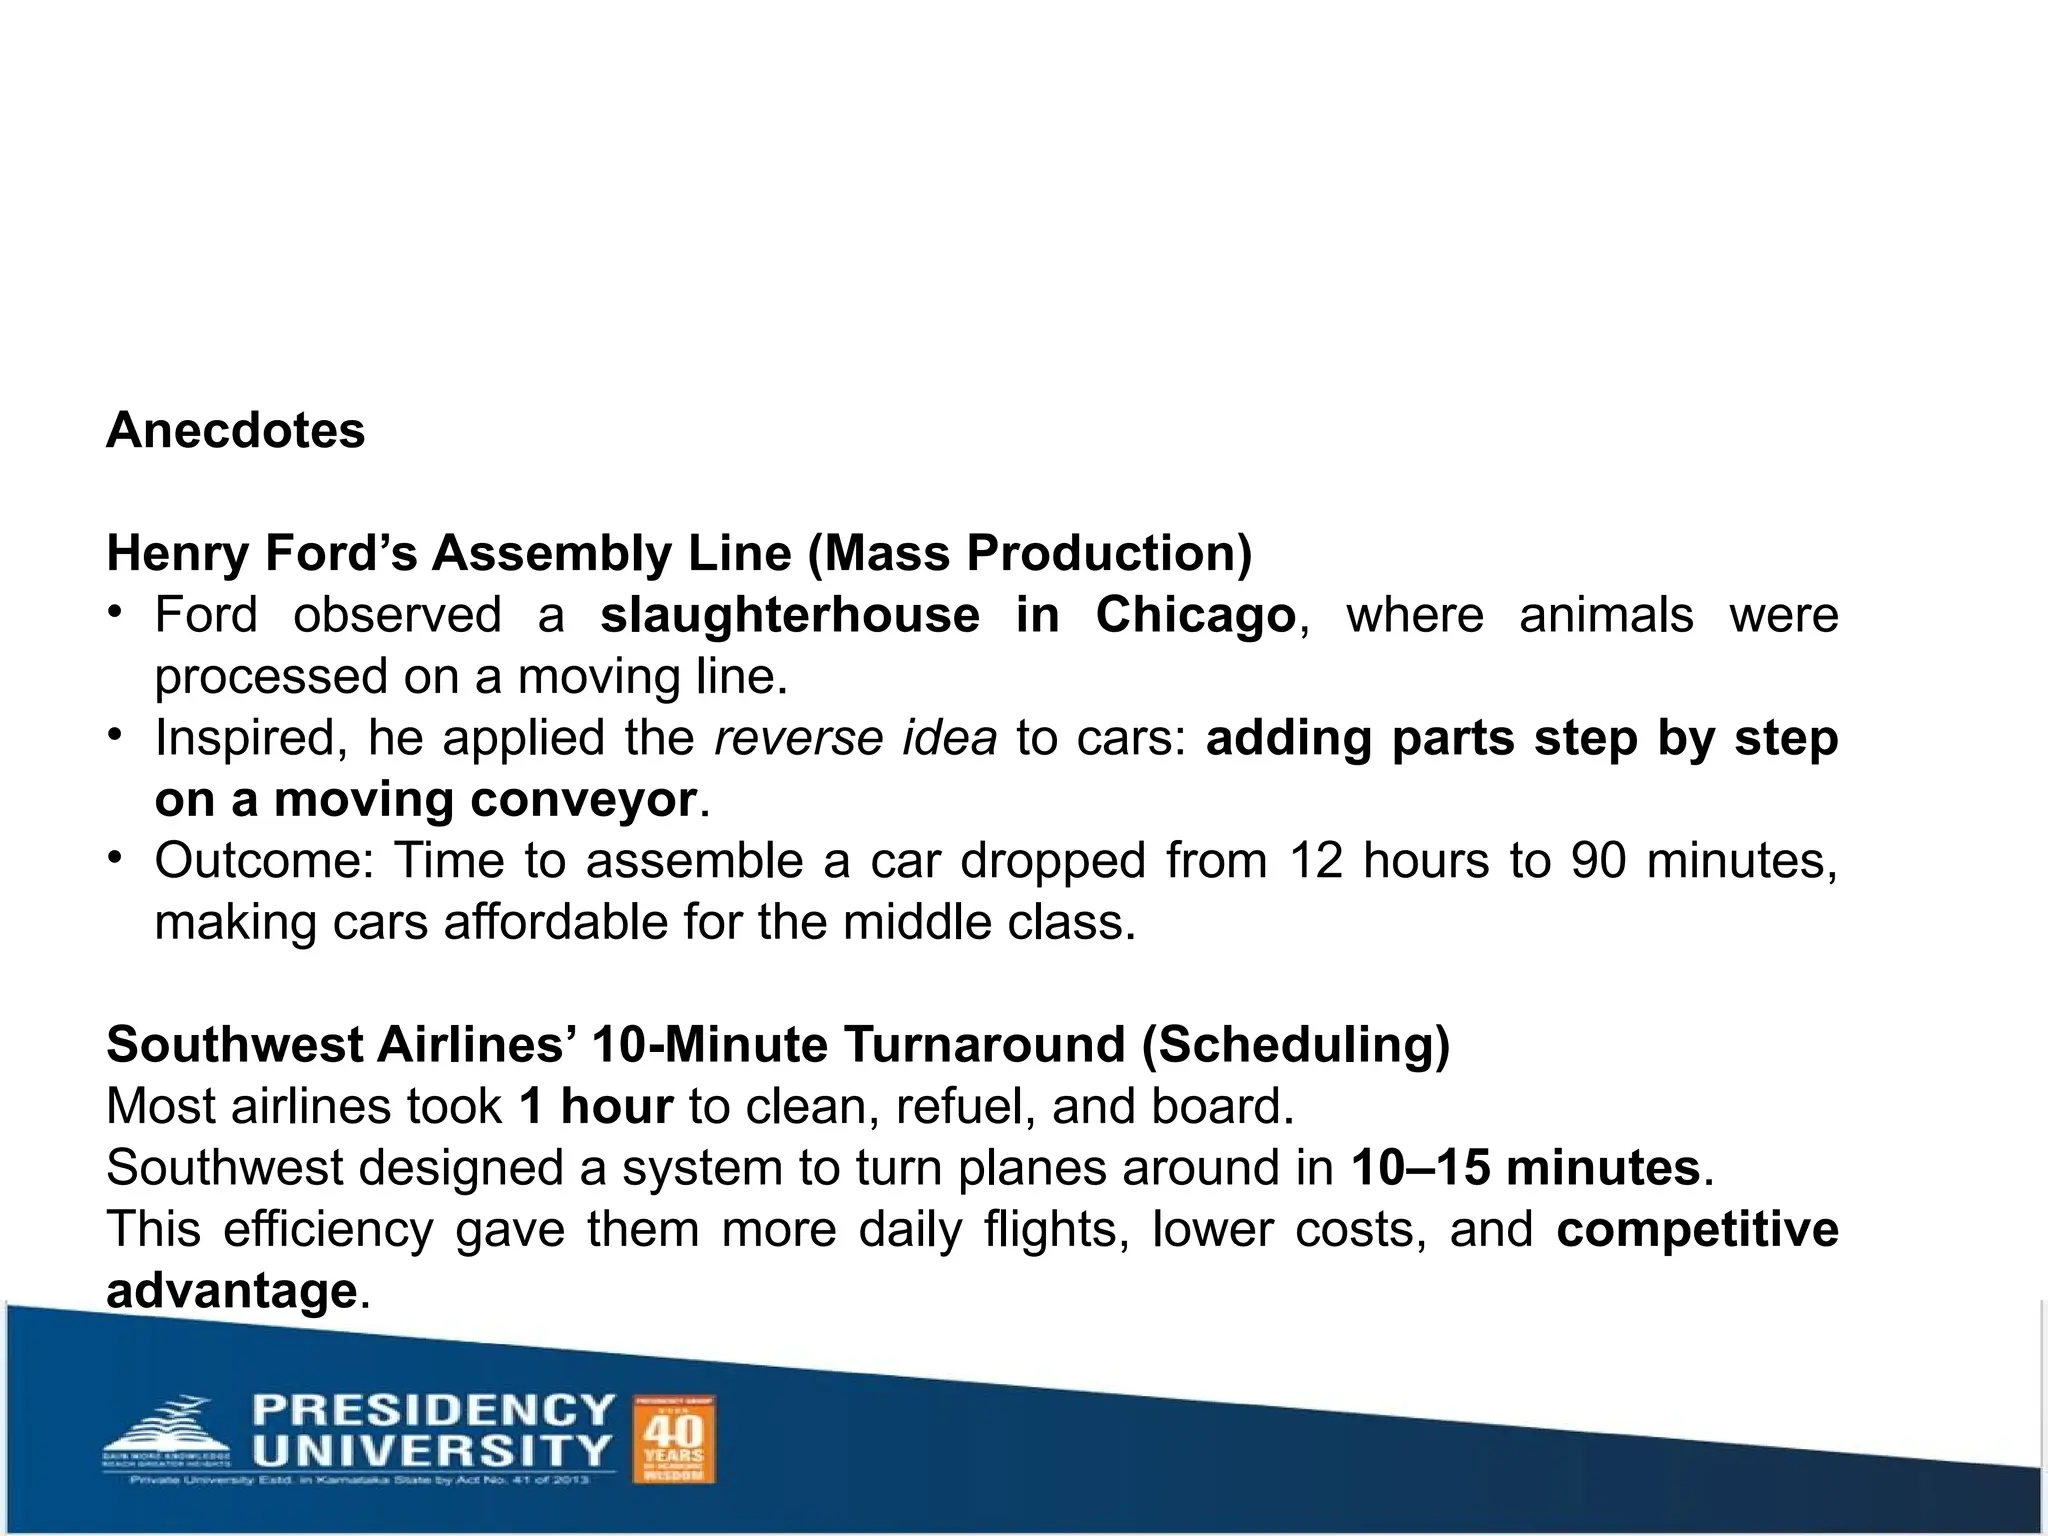
• Assembly line innovation (Henry Ford)
• Focus on efficiency
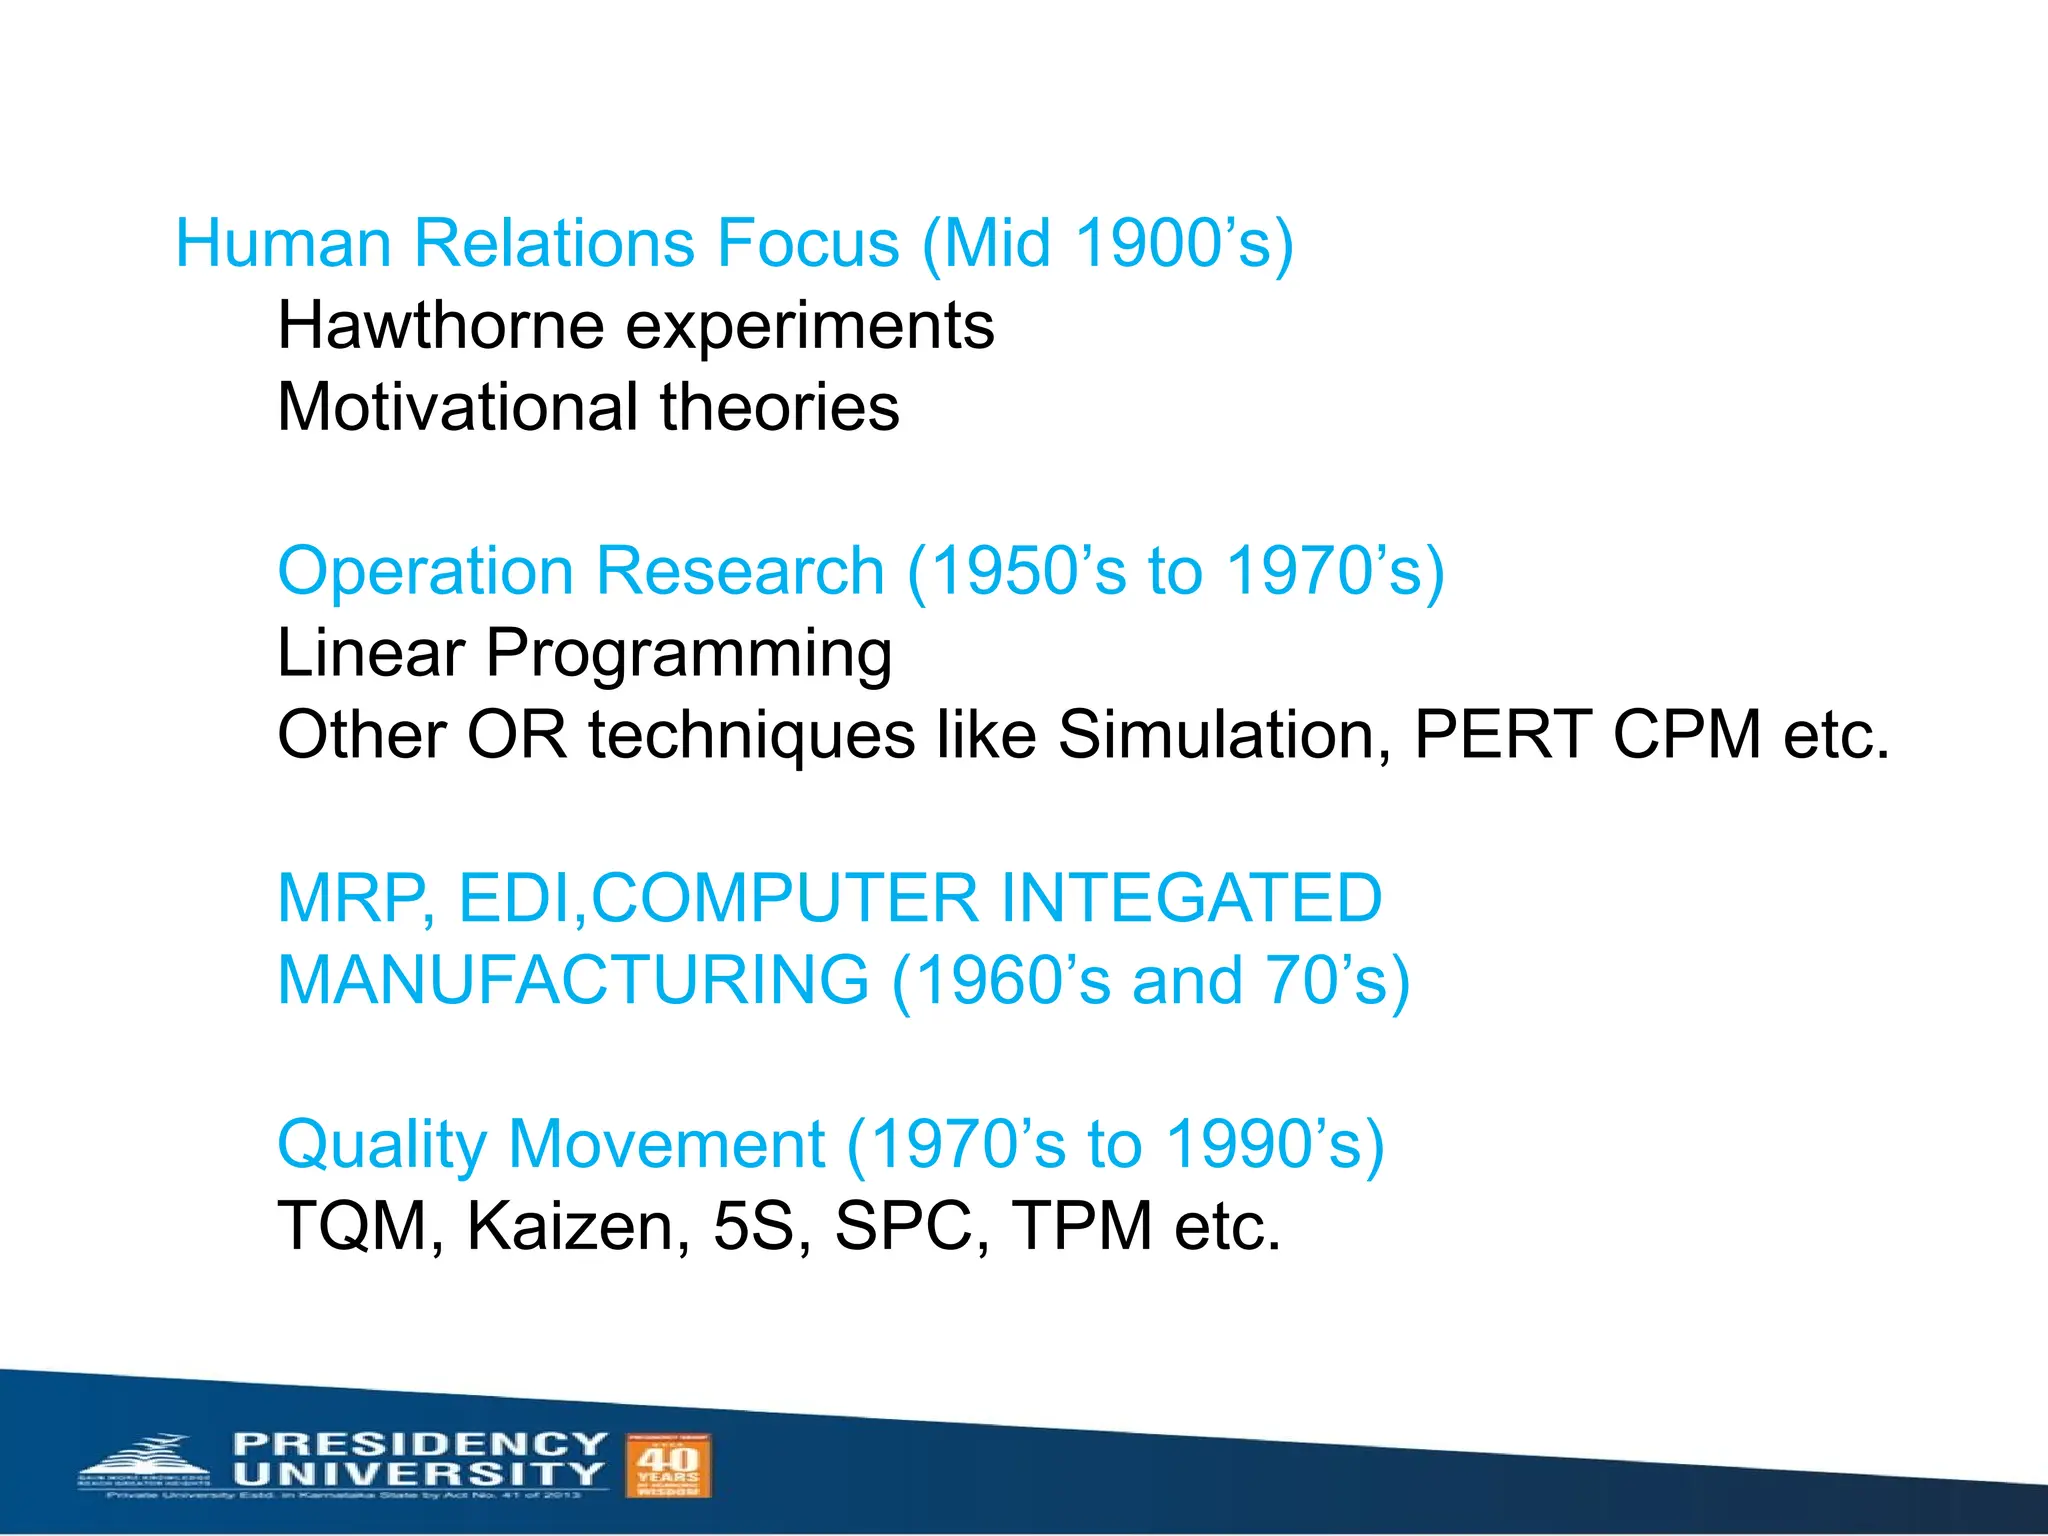
c. Human Relations Era (Mid-1900s)
• Hawthorne experiments
• Motivation and worker satisfaction
d. Operations Research (1950–1970)
• Linear programming
• PERT/CPM
• Simulation models
e. Computer-Integrated Manufacturing (1960–1980)
• MRP, EDI
• Automation
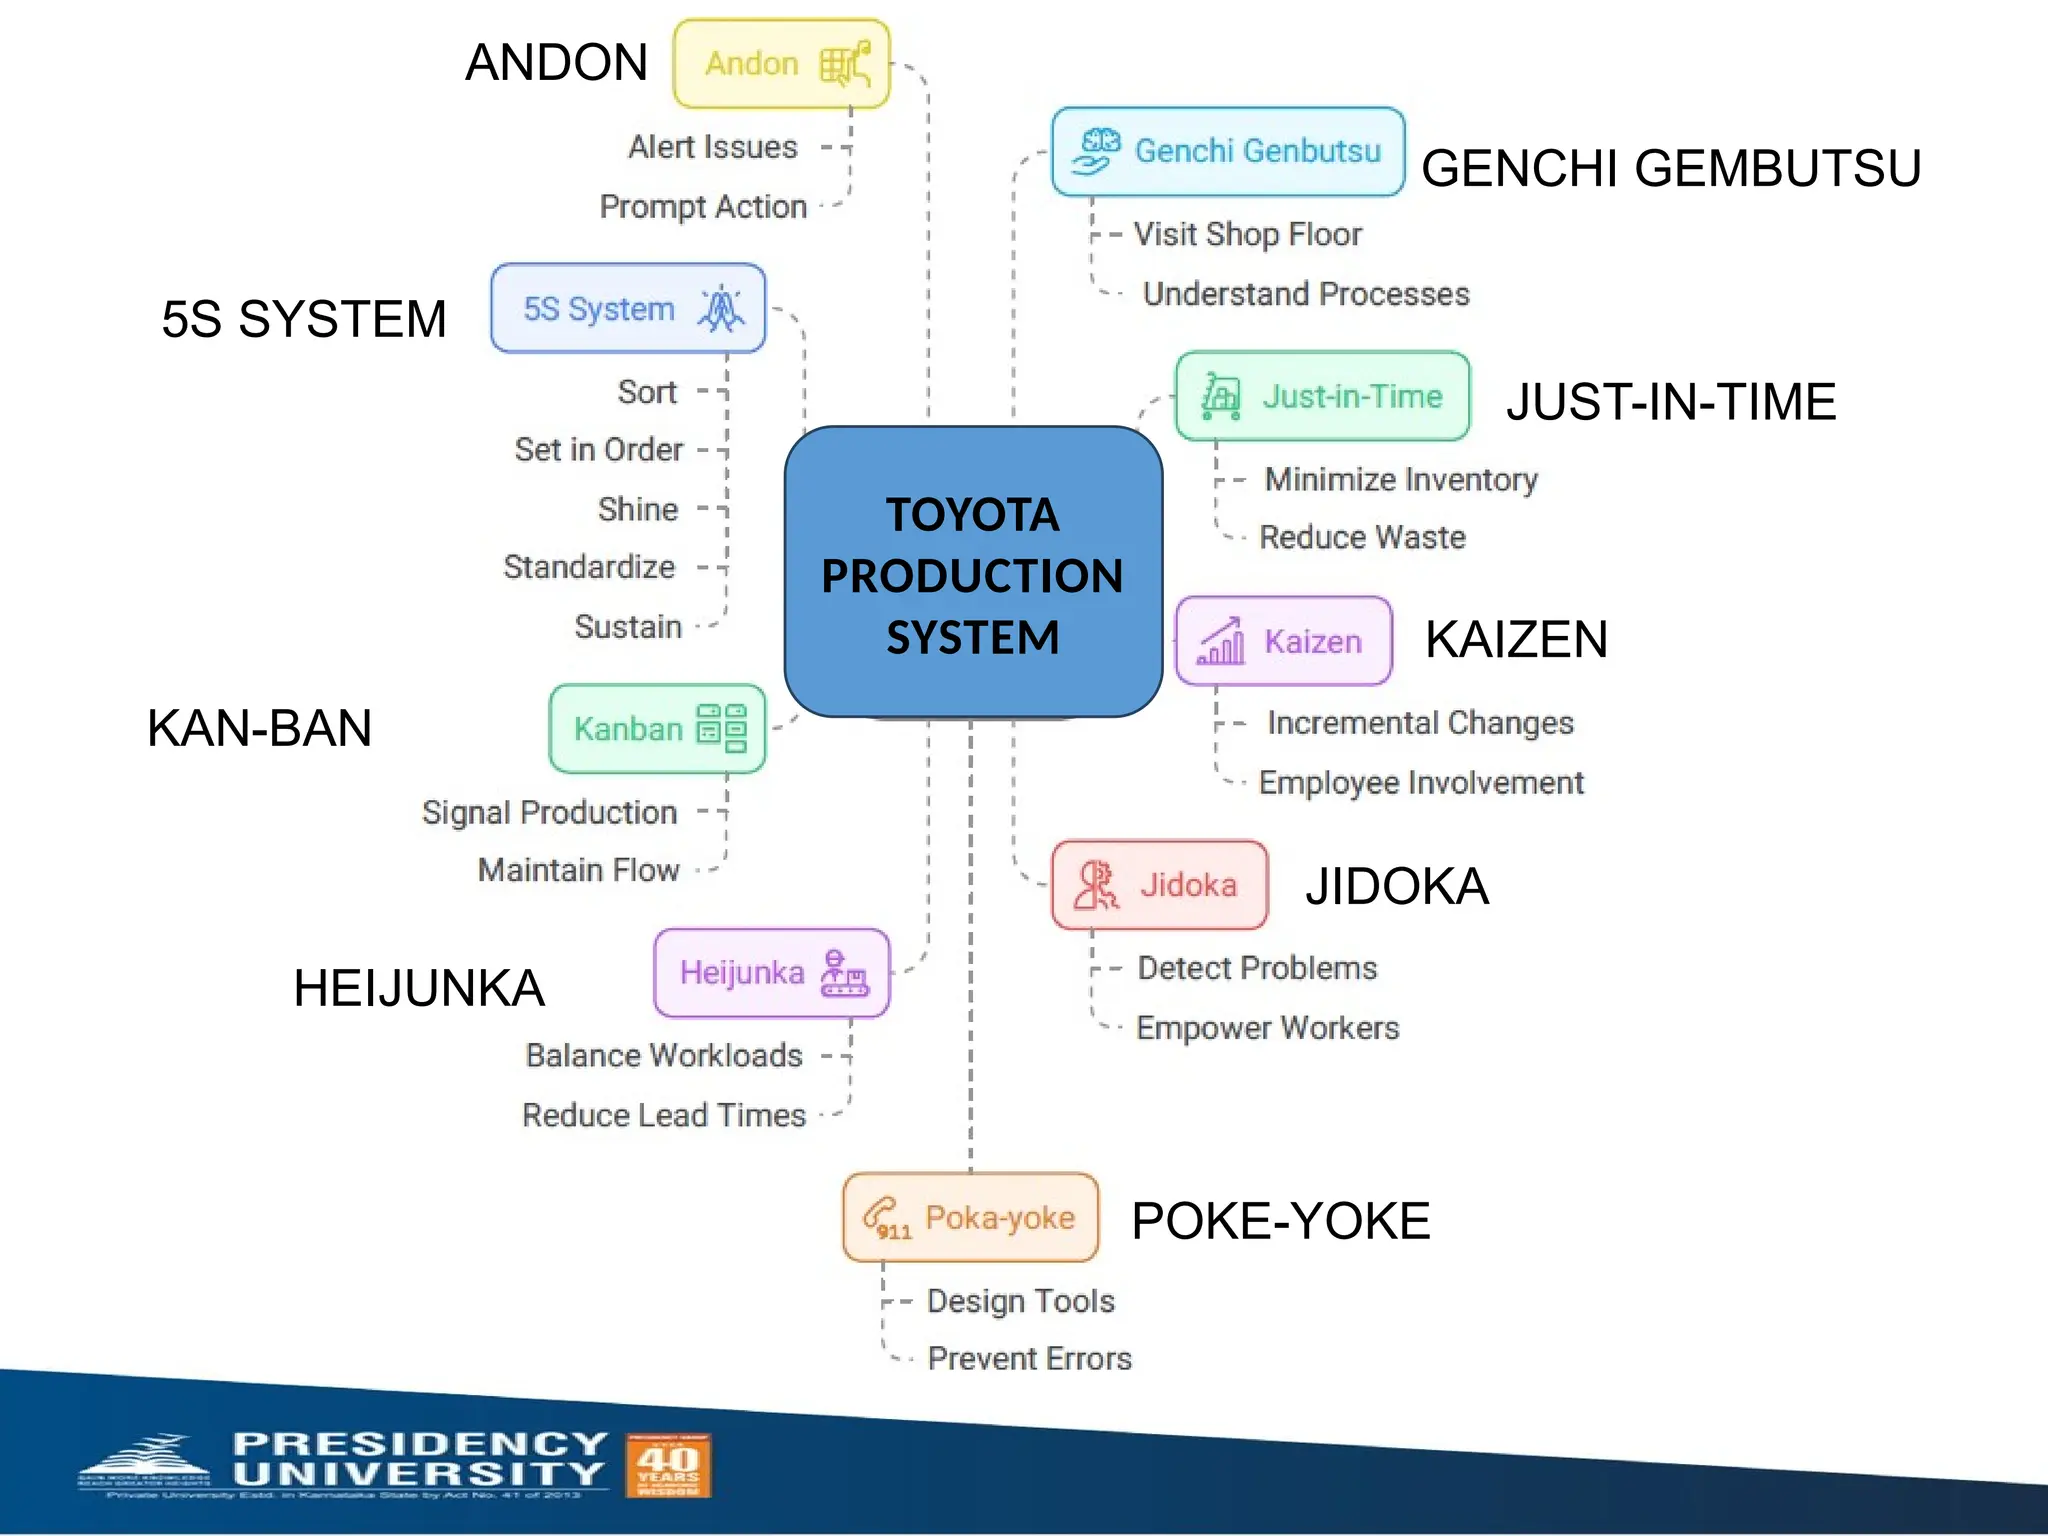
f. Quality Revolution (1970–1990)
• TQM, Kaizen, 5S, SPC, TPM
• Shift toward global competition
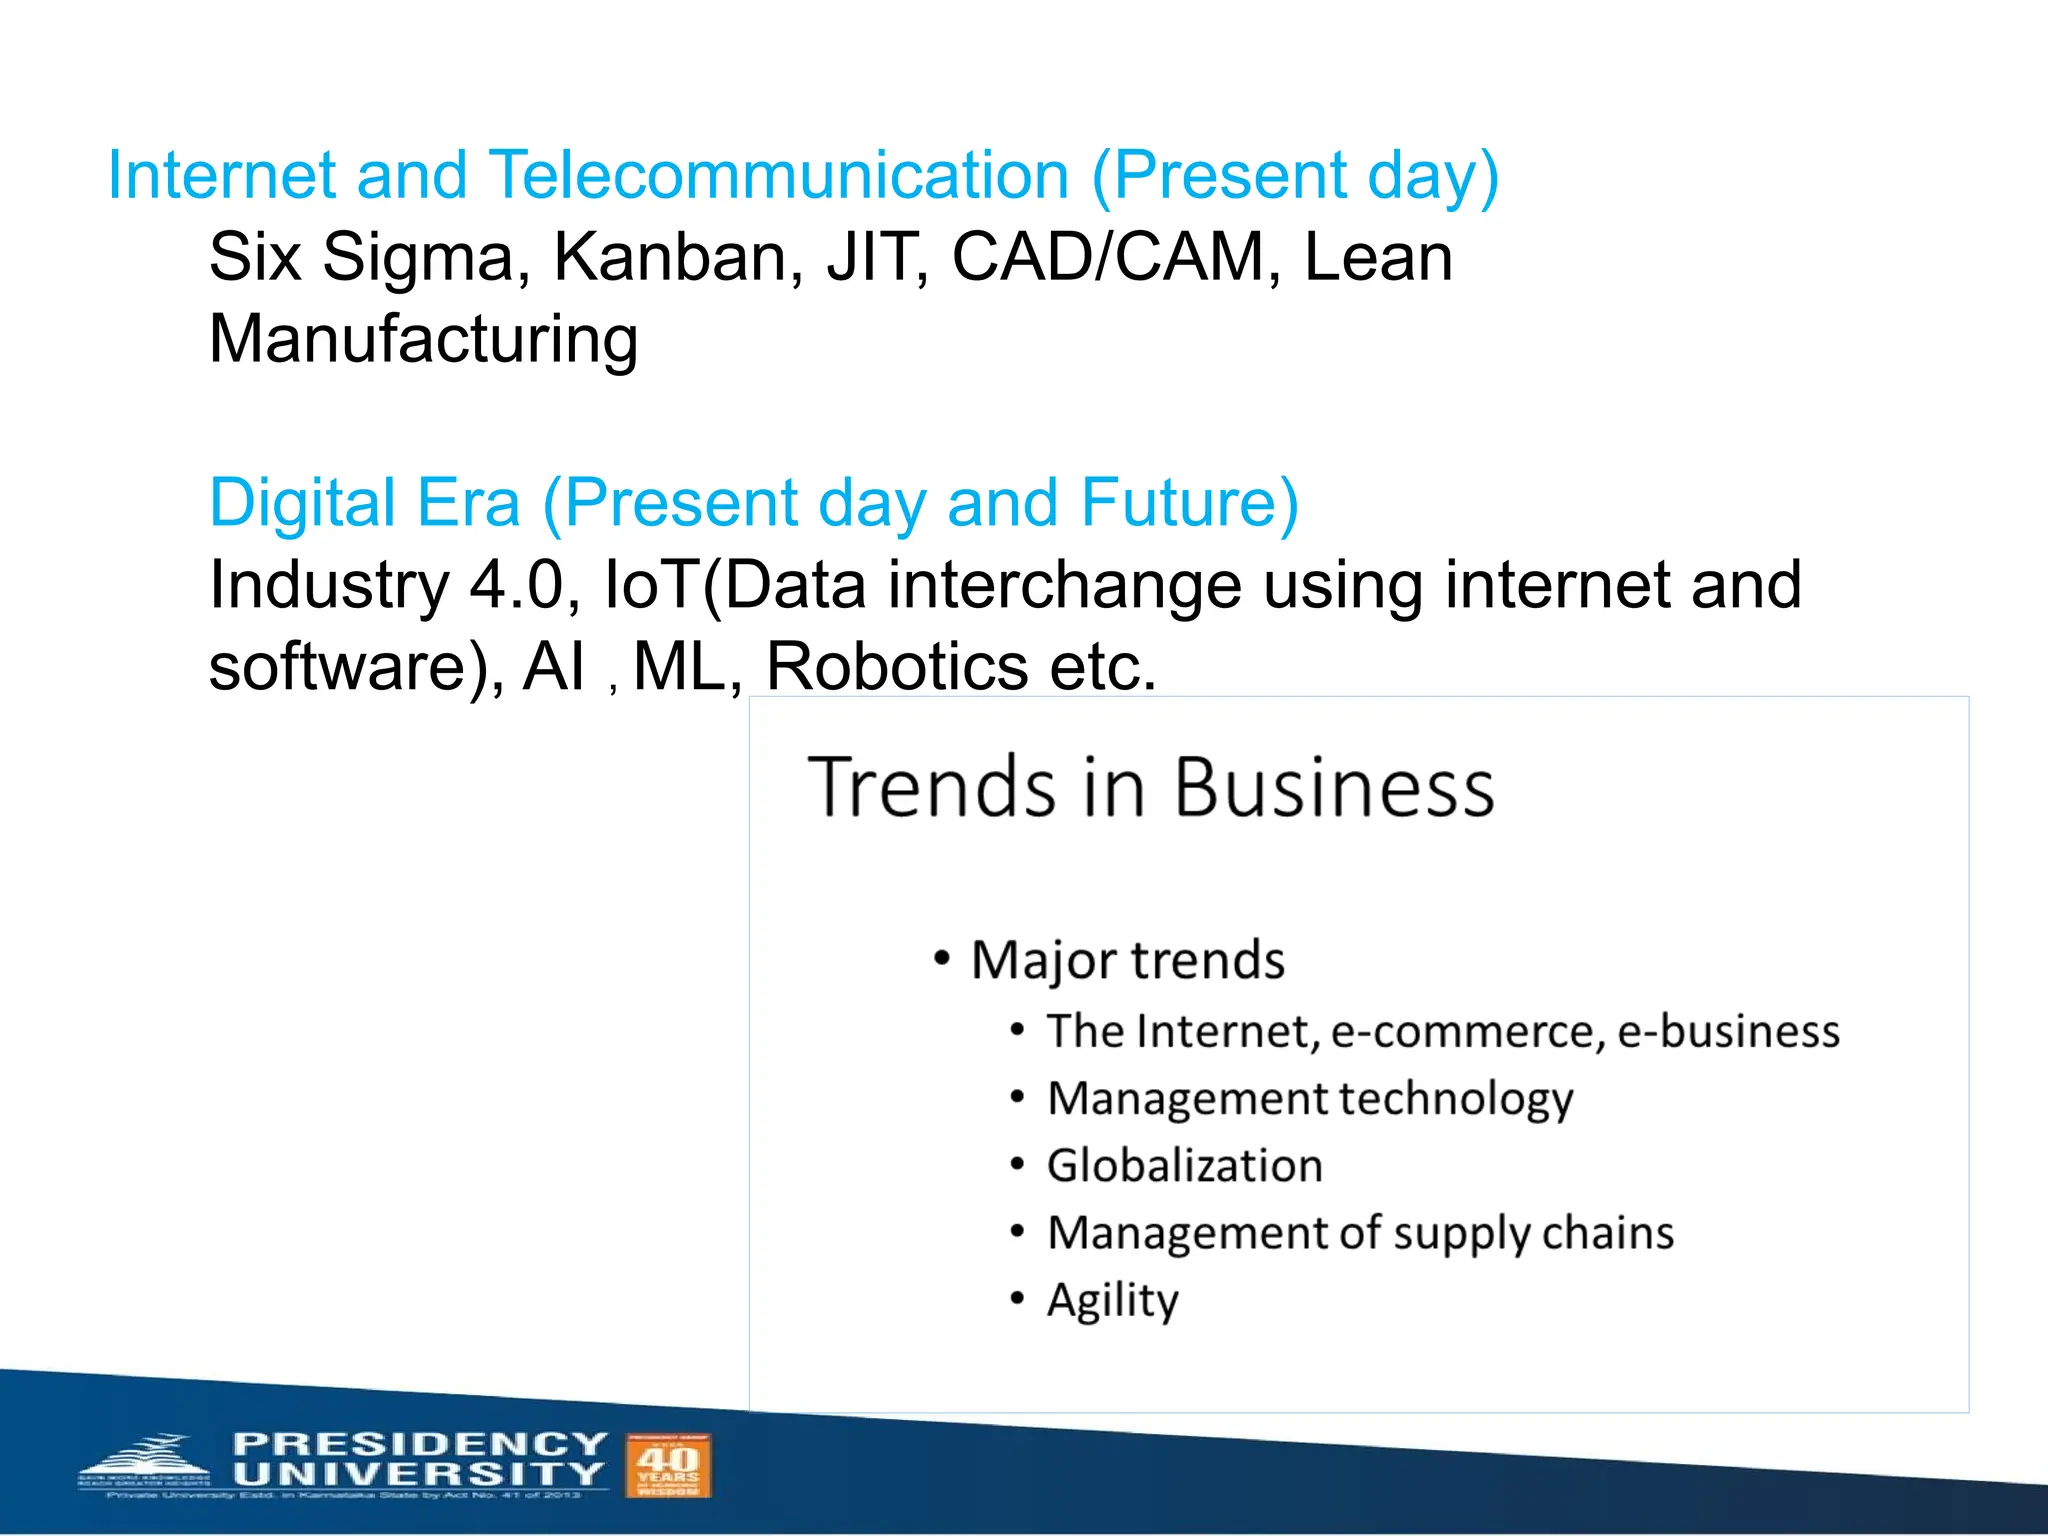
g. Internet & Telecom Era (1990–Present)
• Six Sigma, Lean, JIT
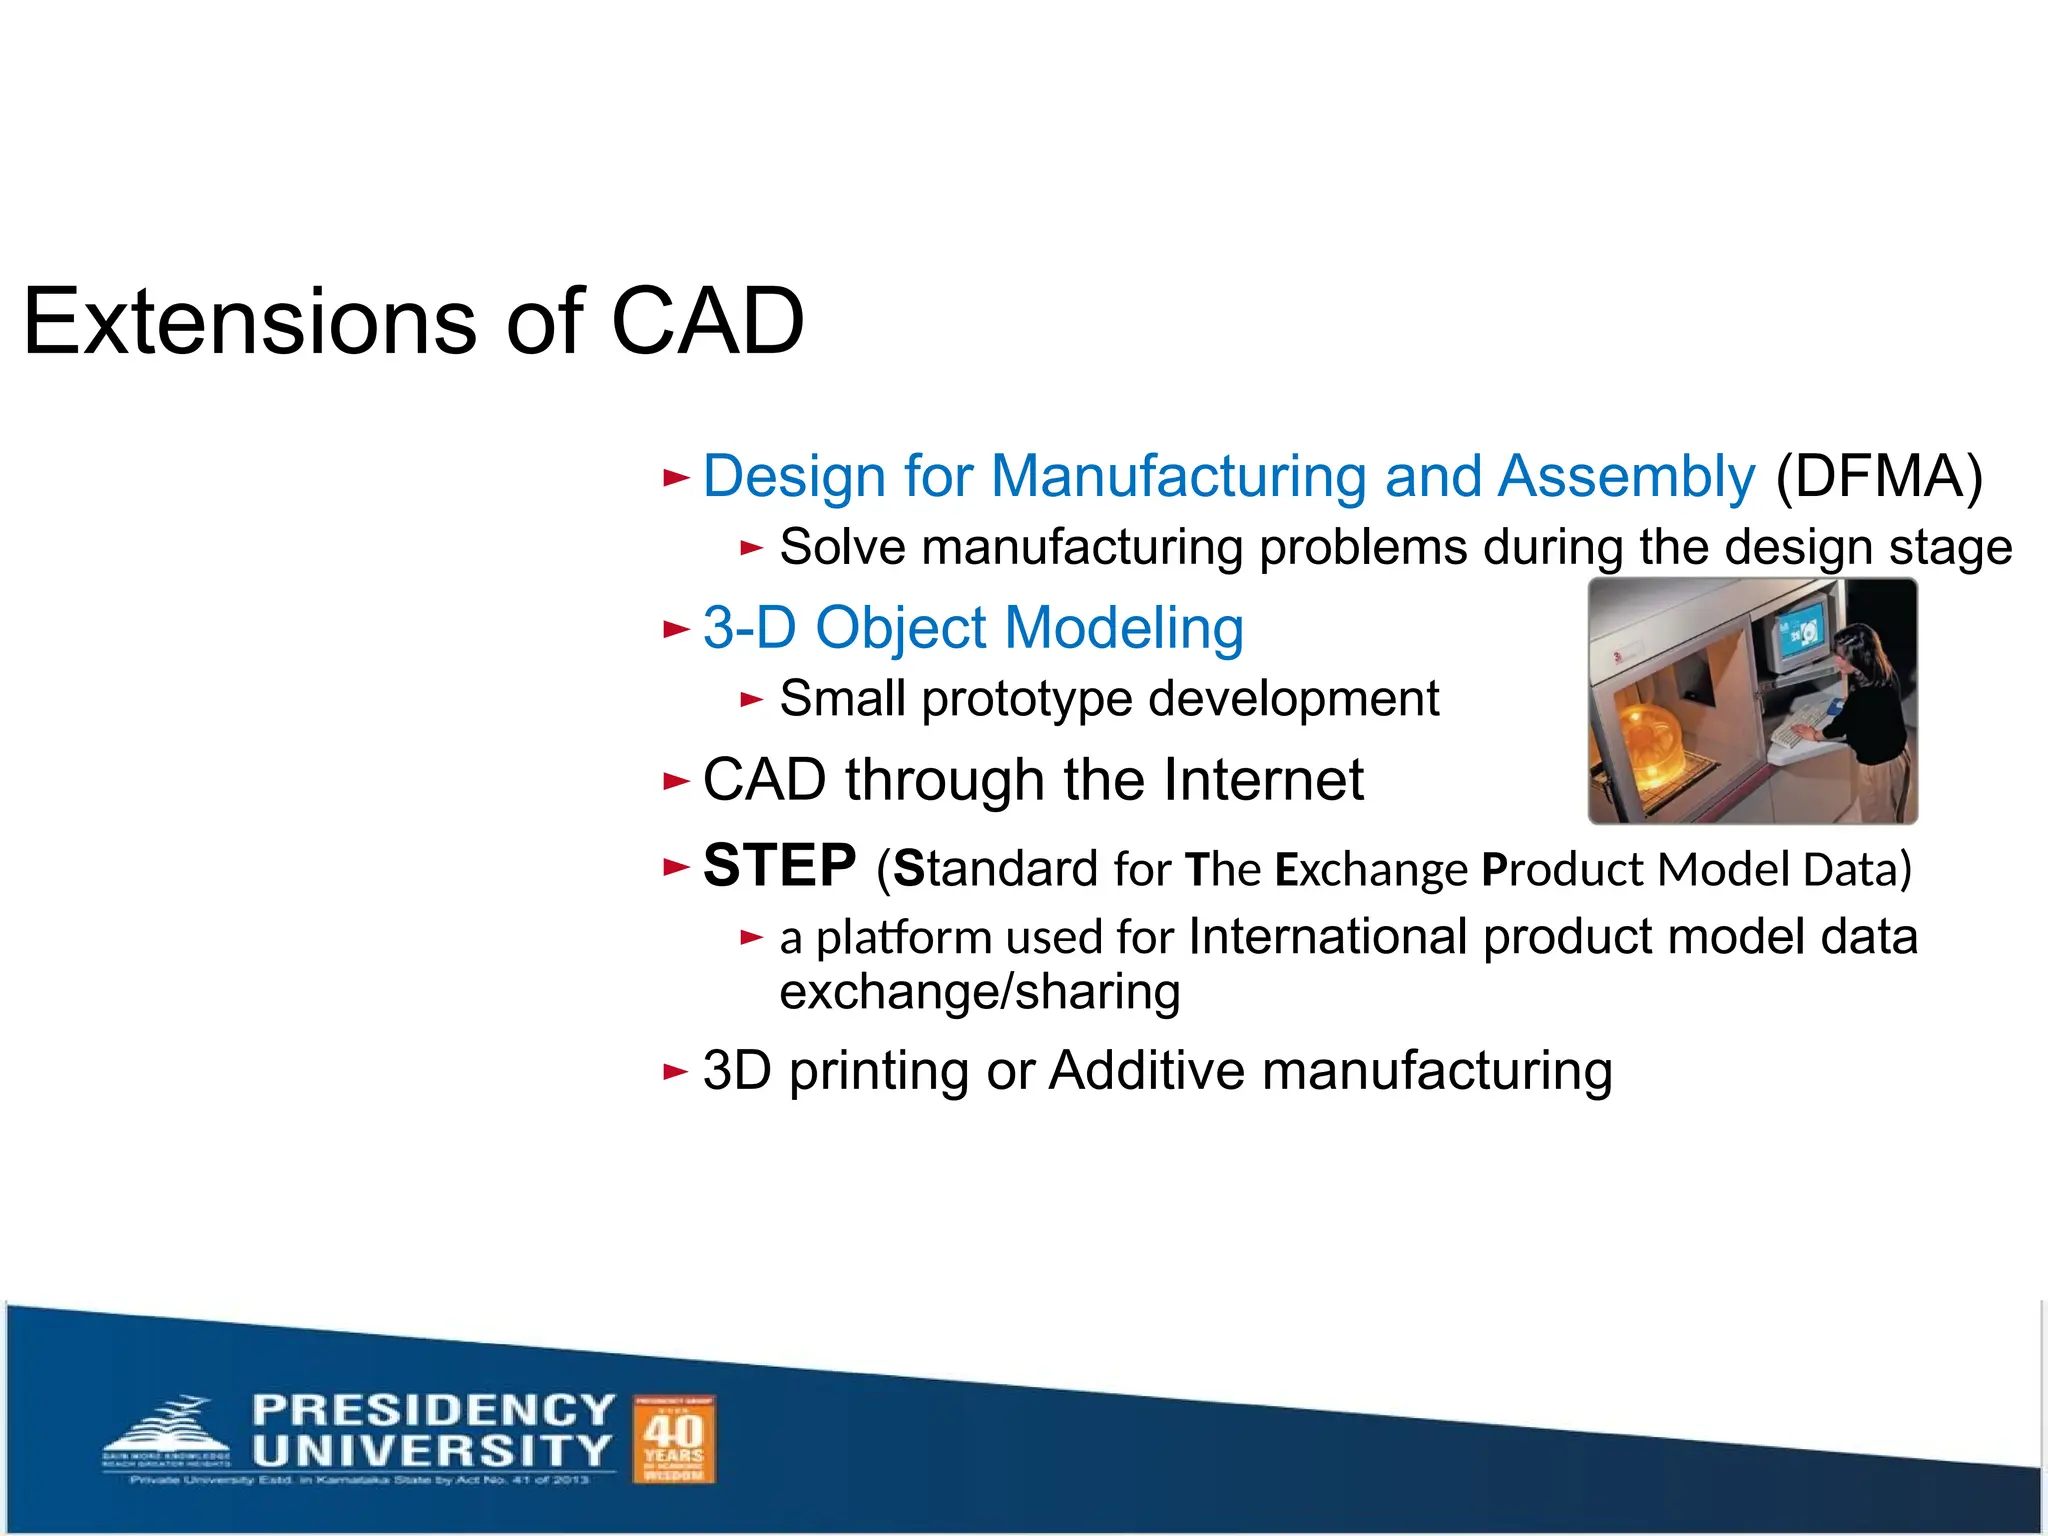
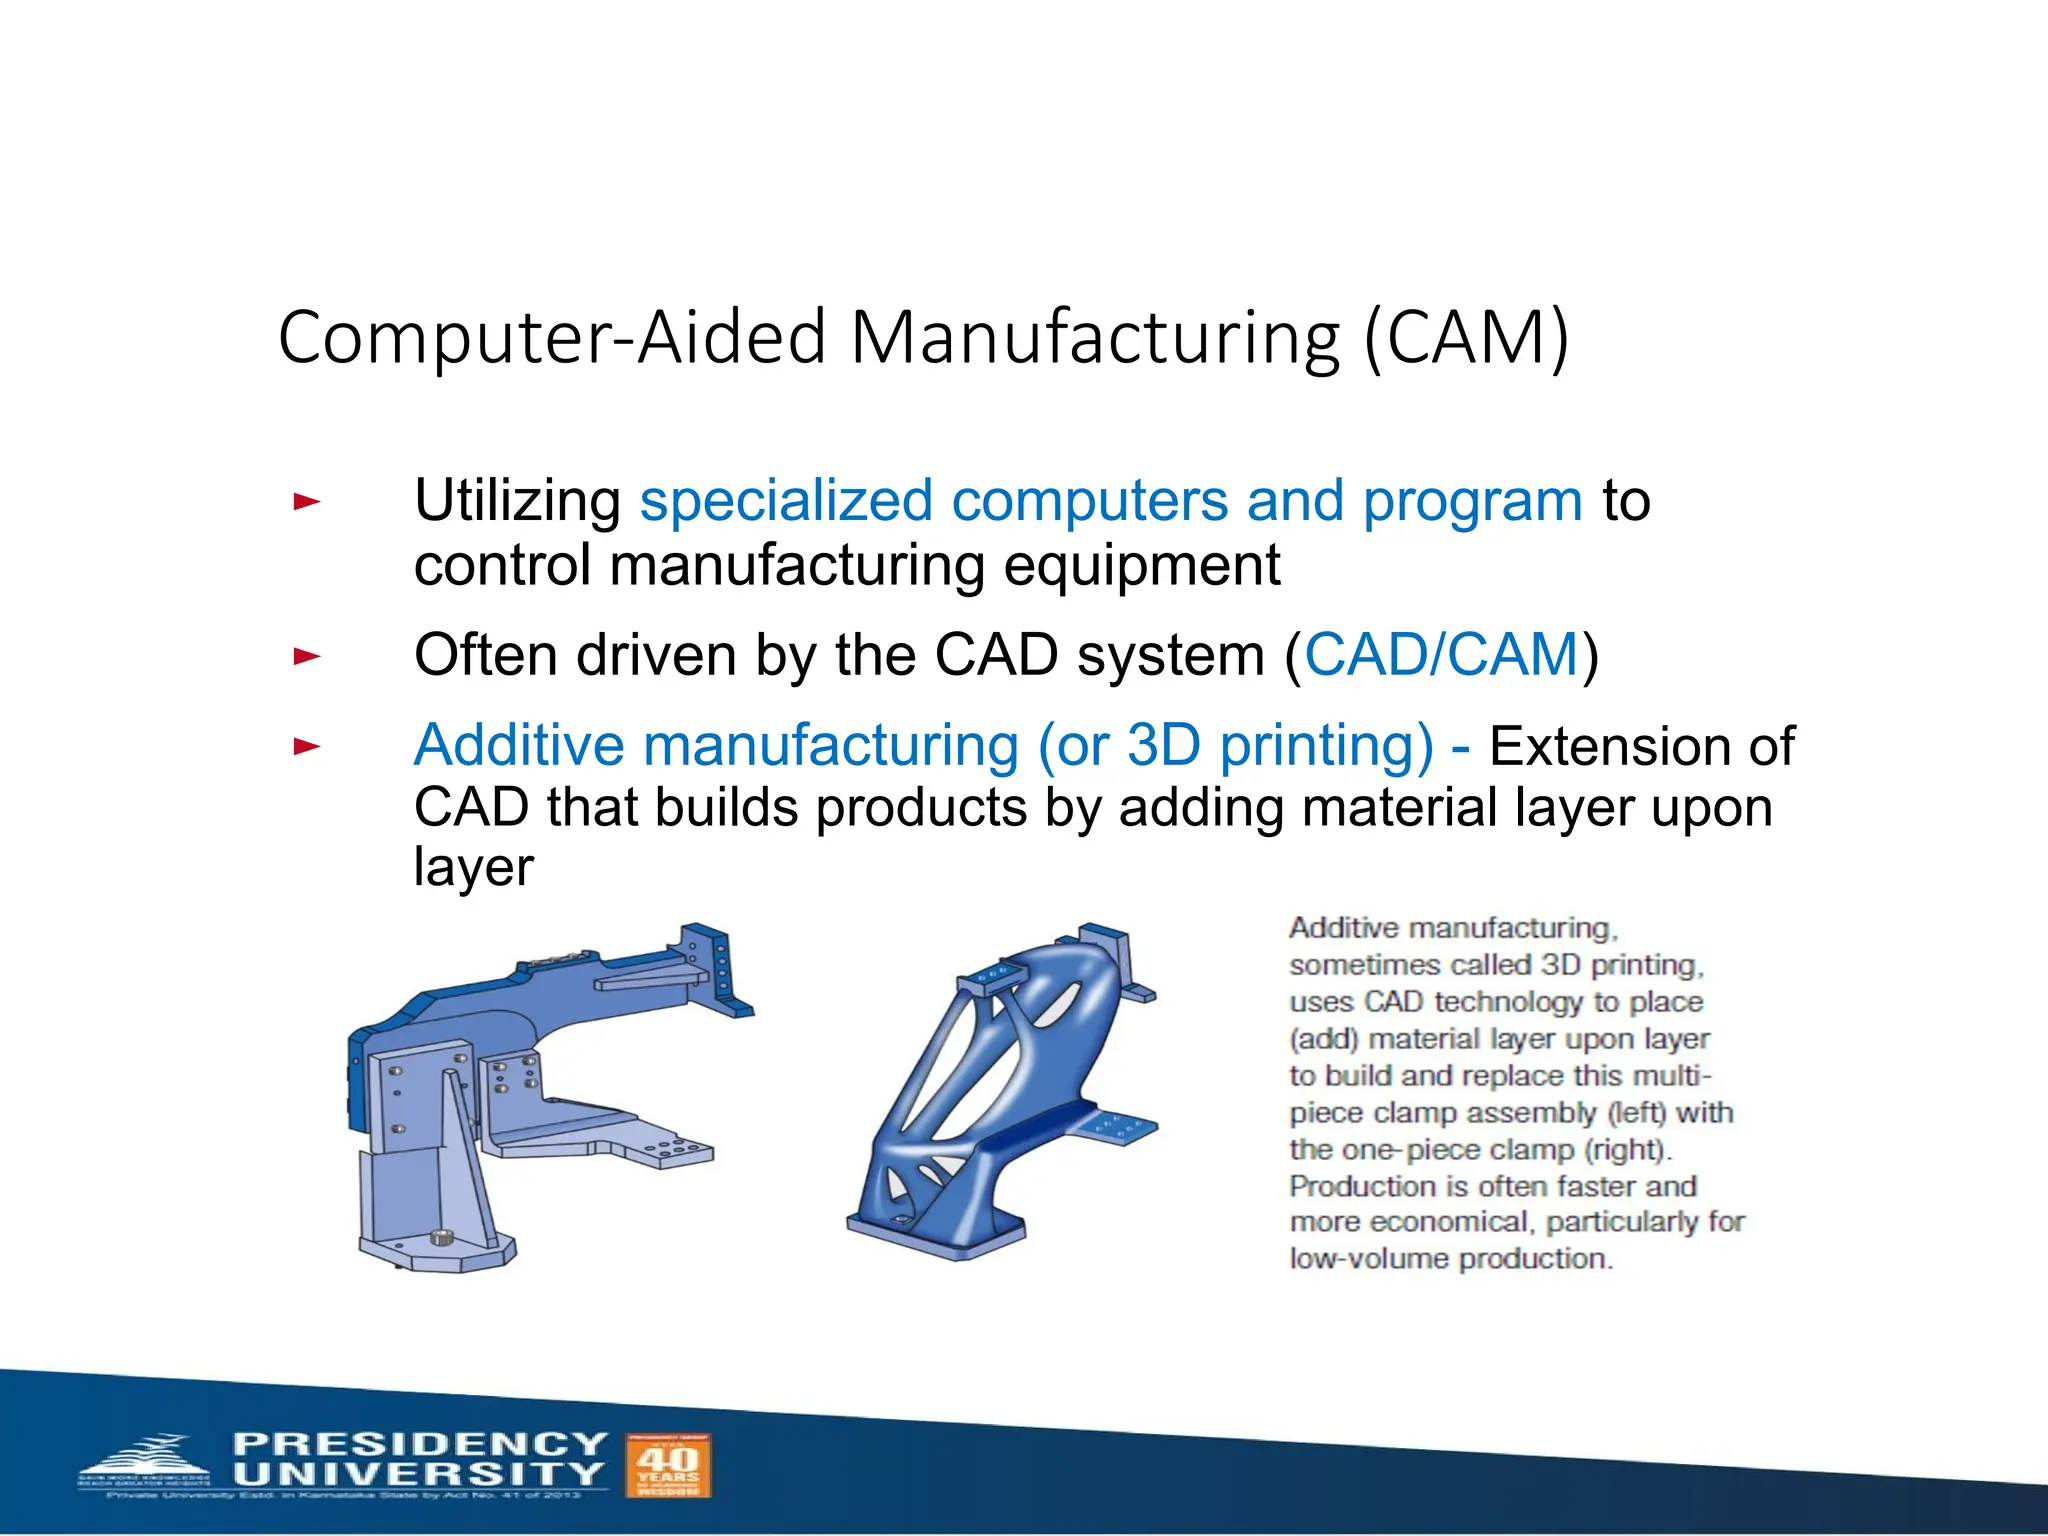
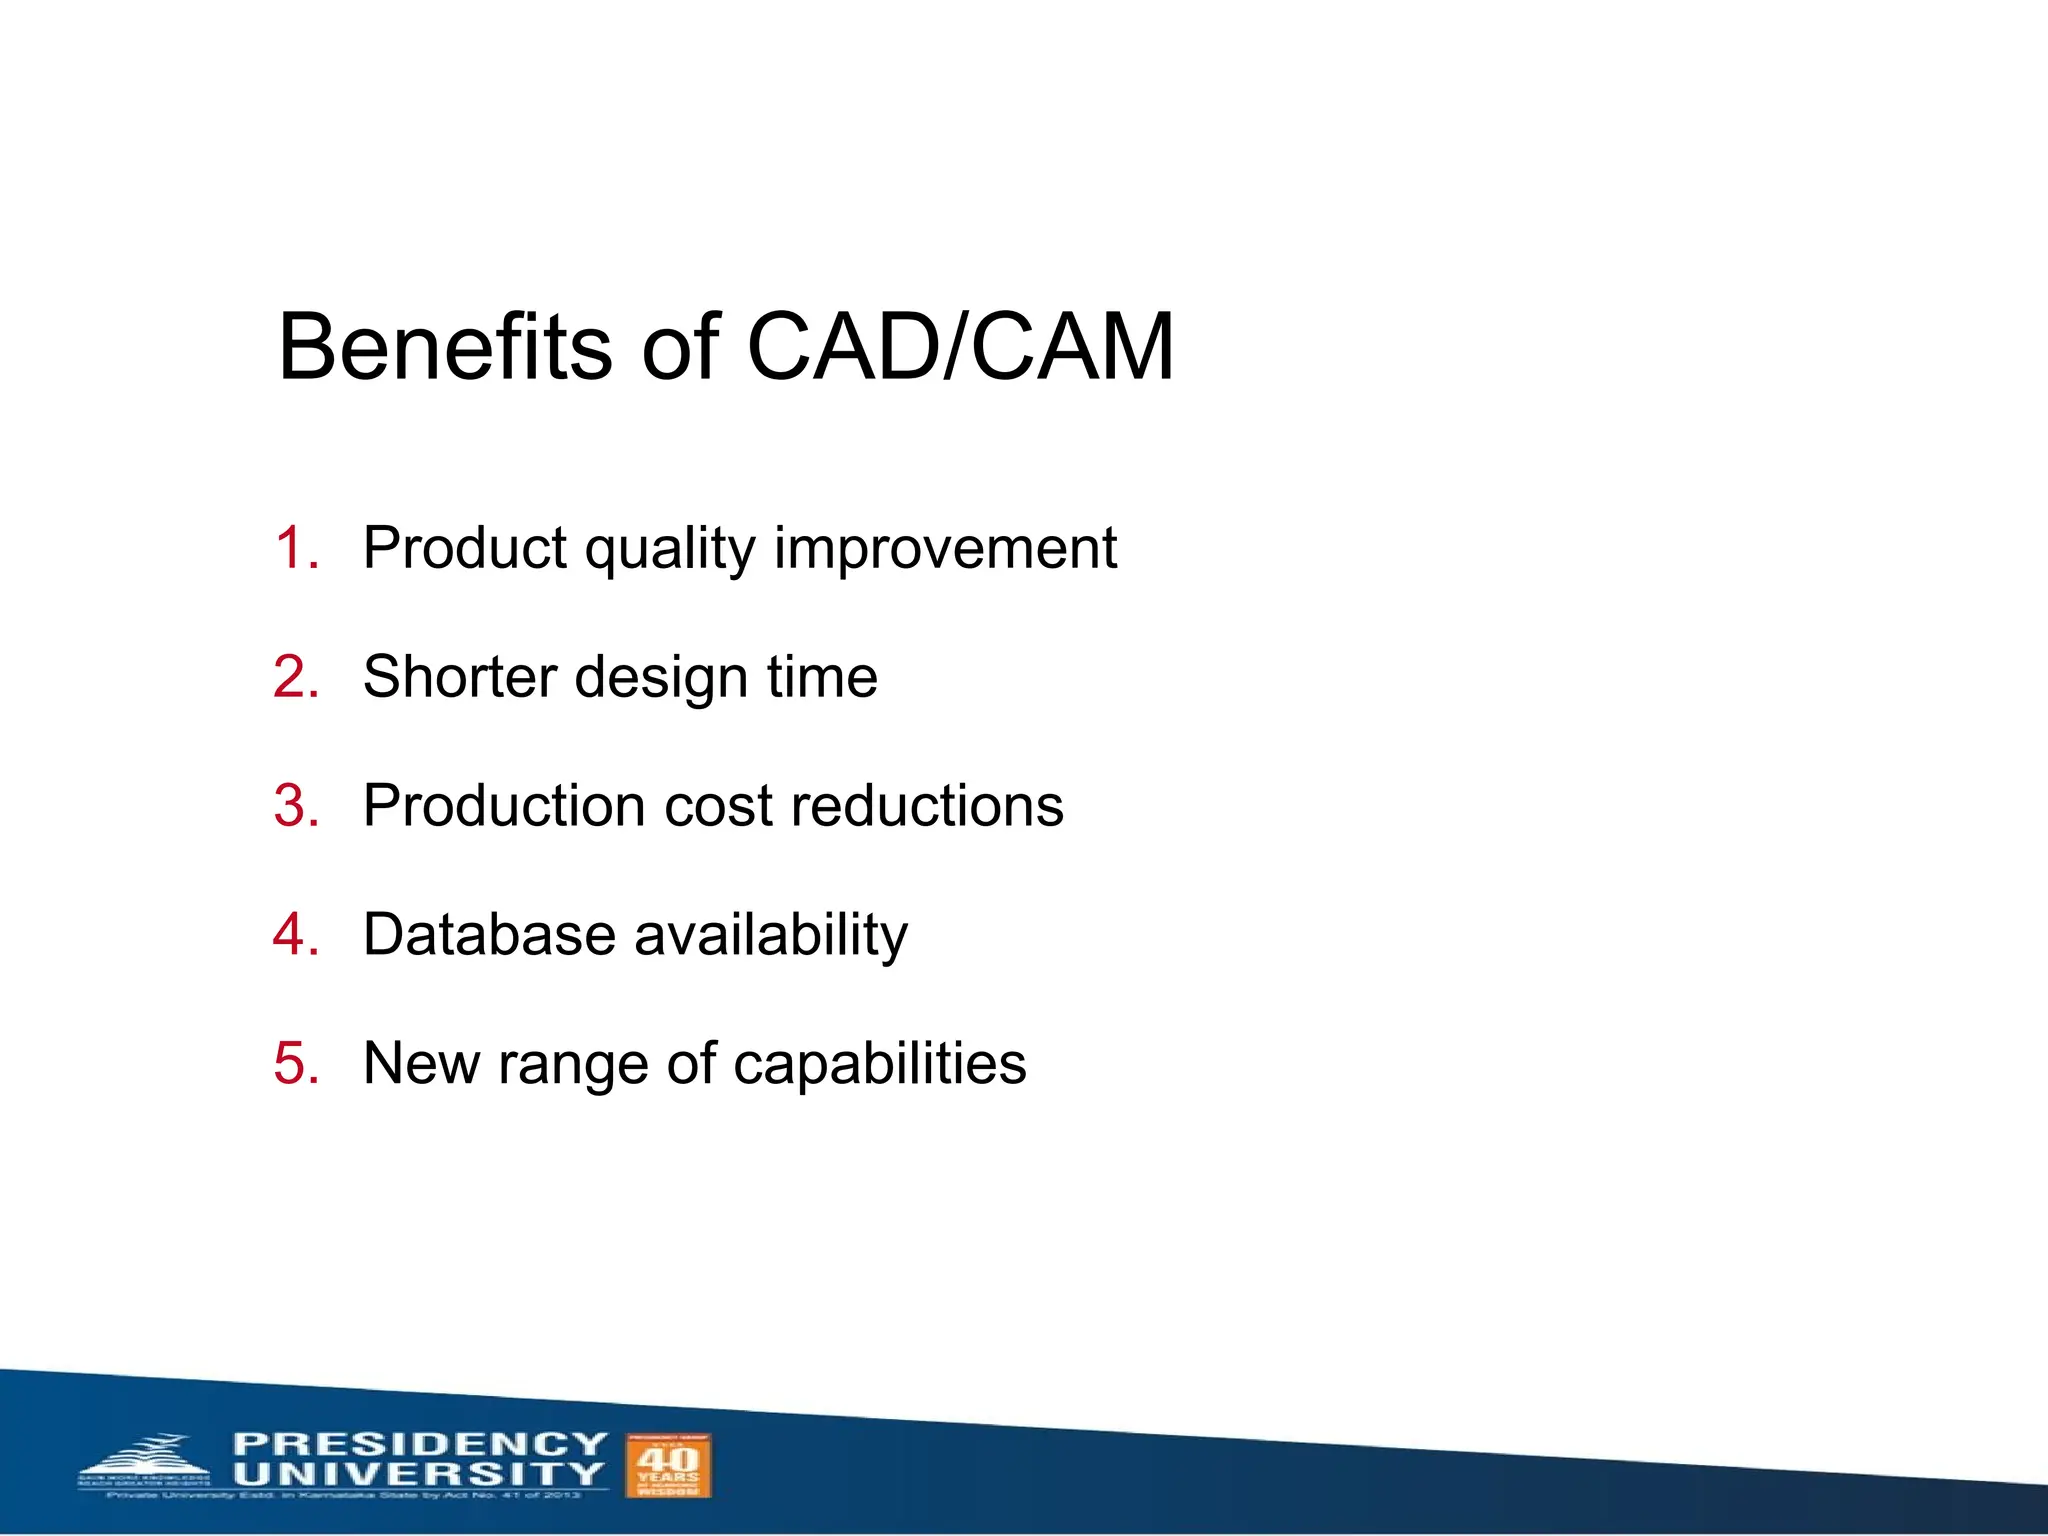
• CAD/CAM
• ERP systems
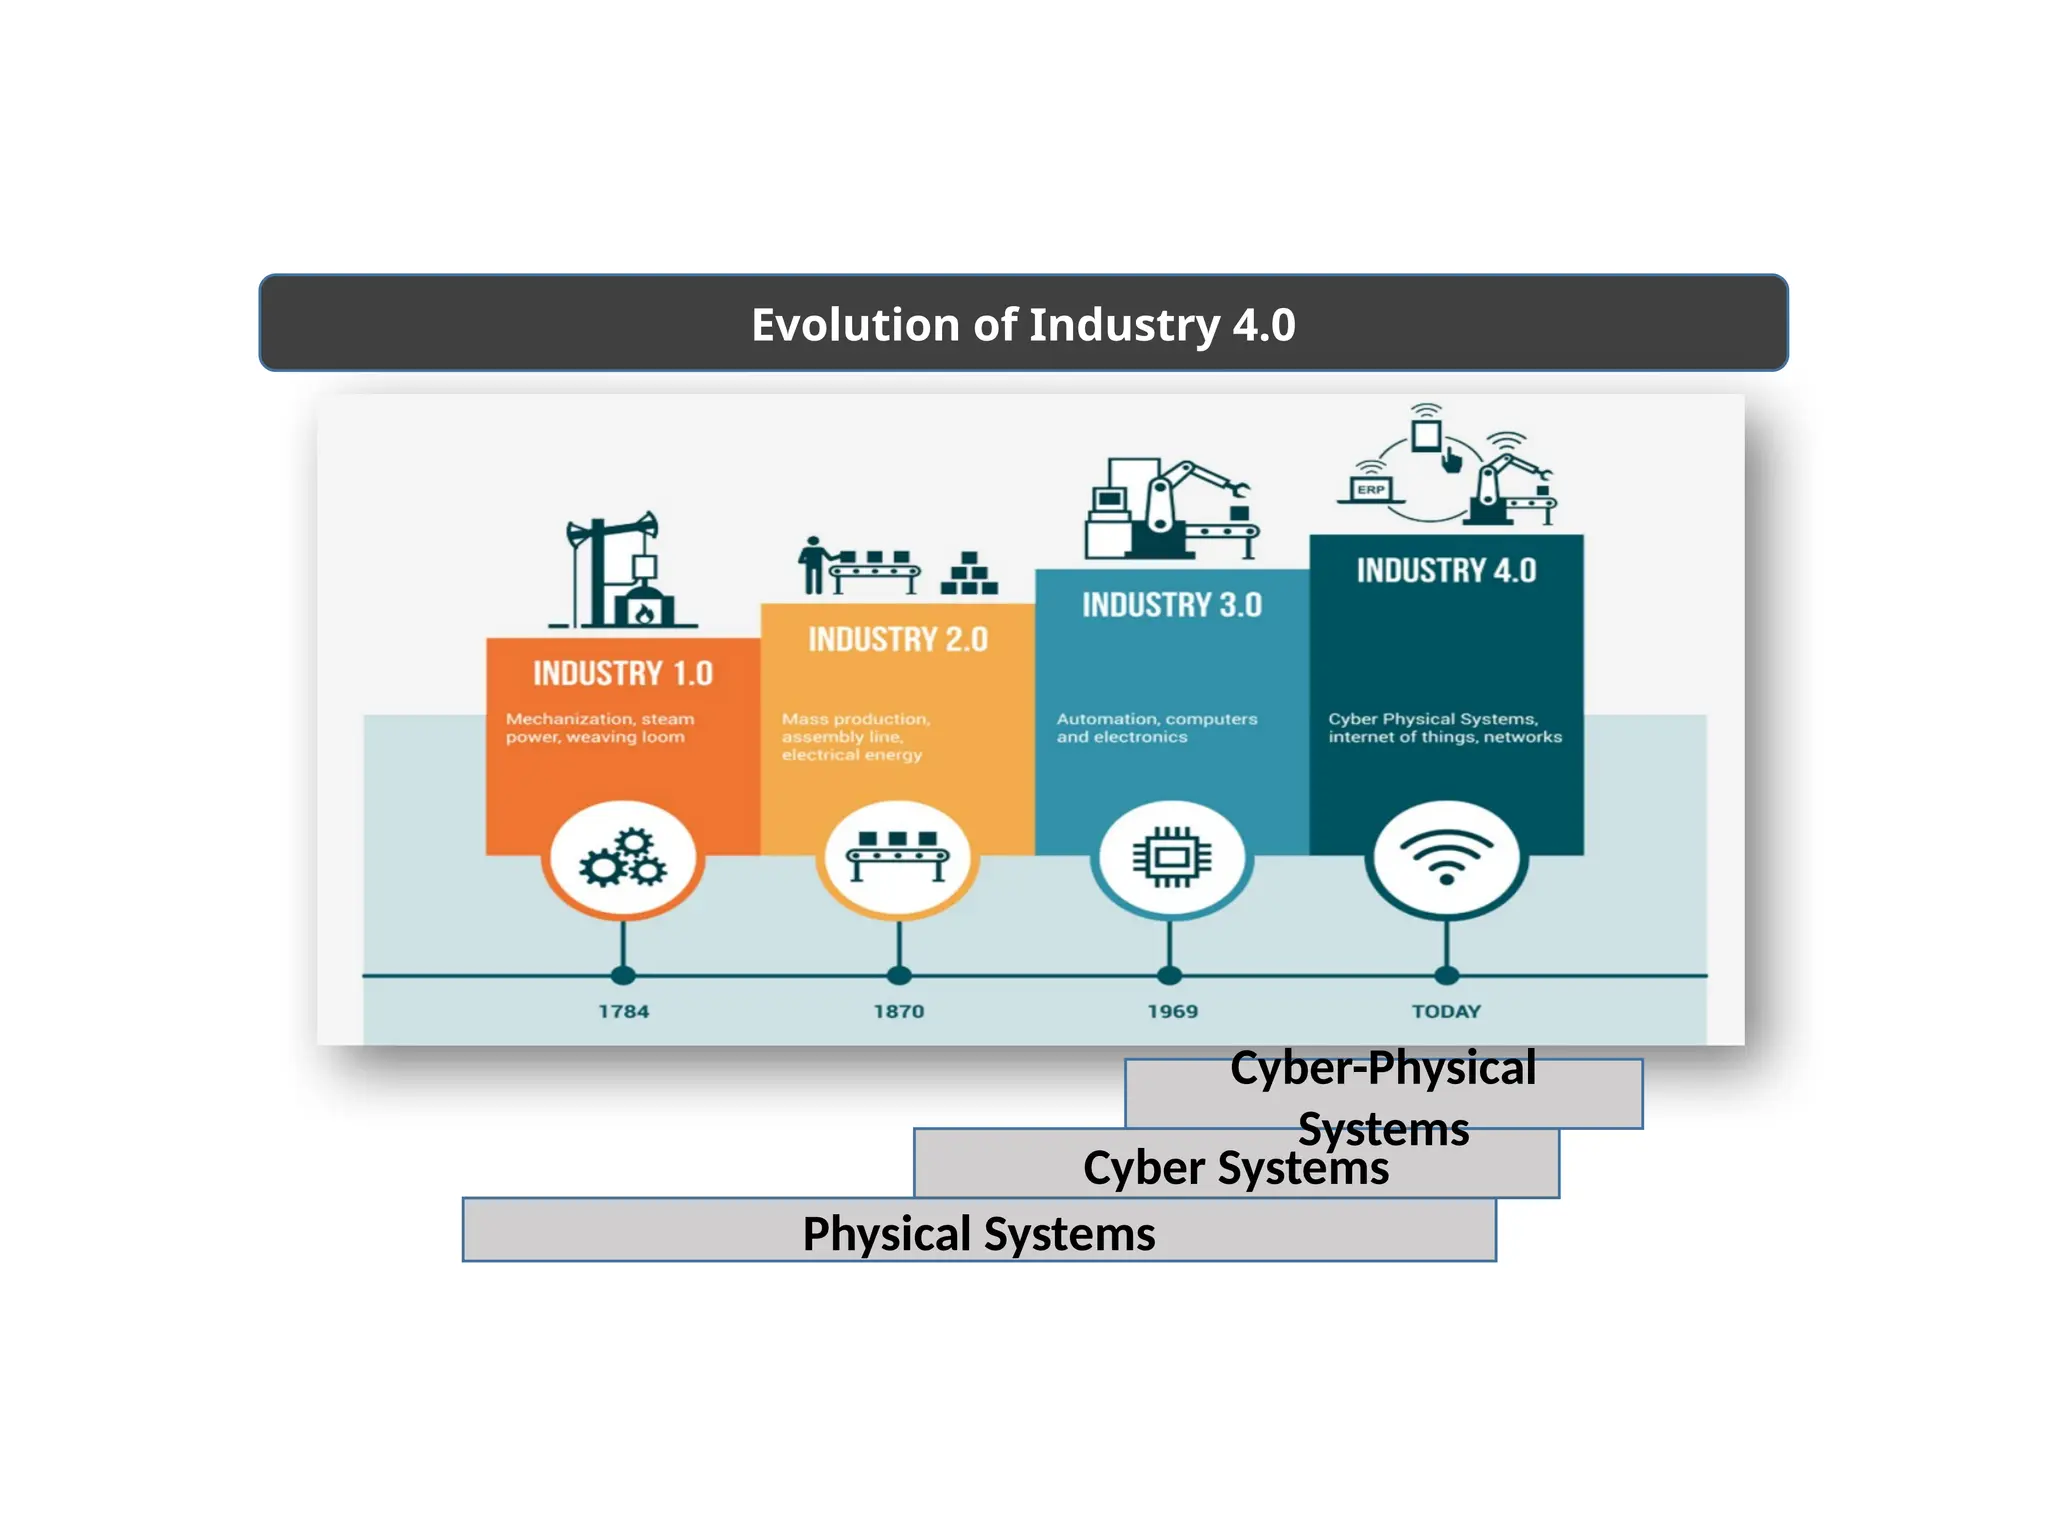
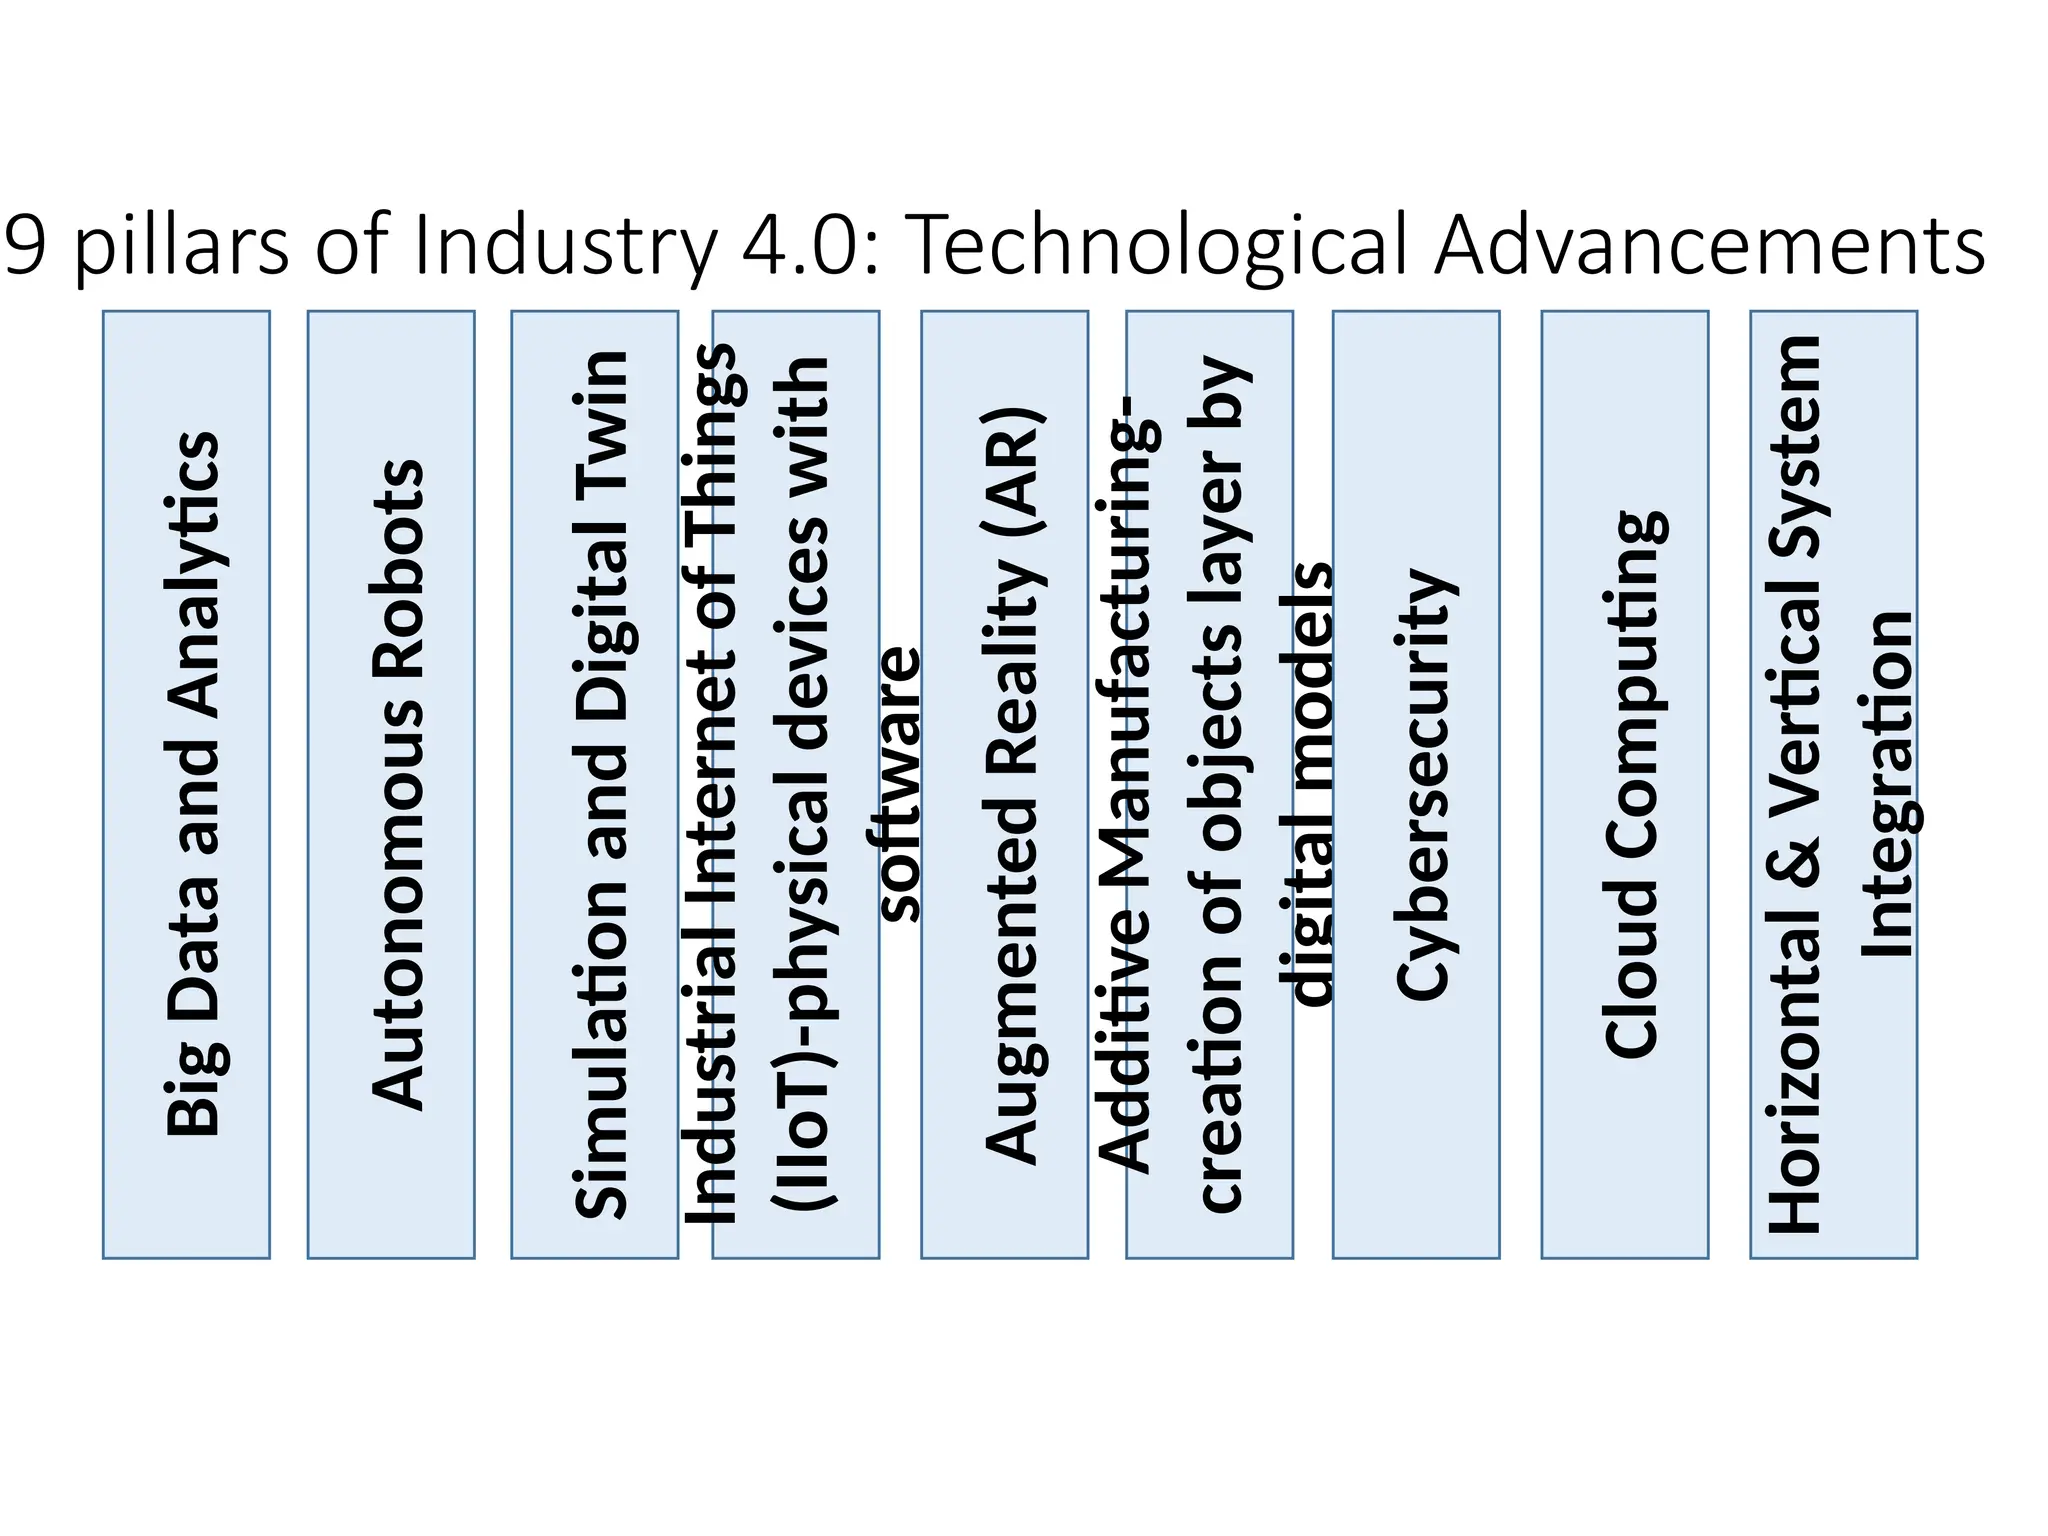
h. Digital & Industry 4.0 Era (Present & Future)
• Artificial Intelligence
• Machine Learning
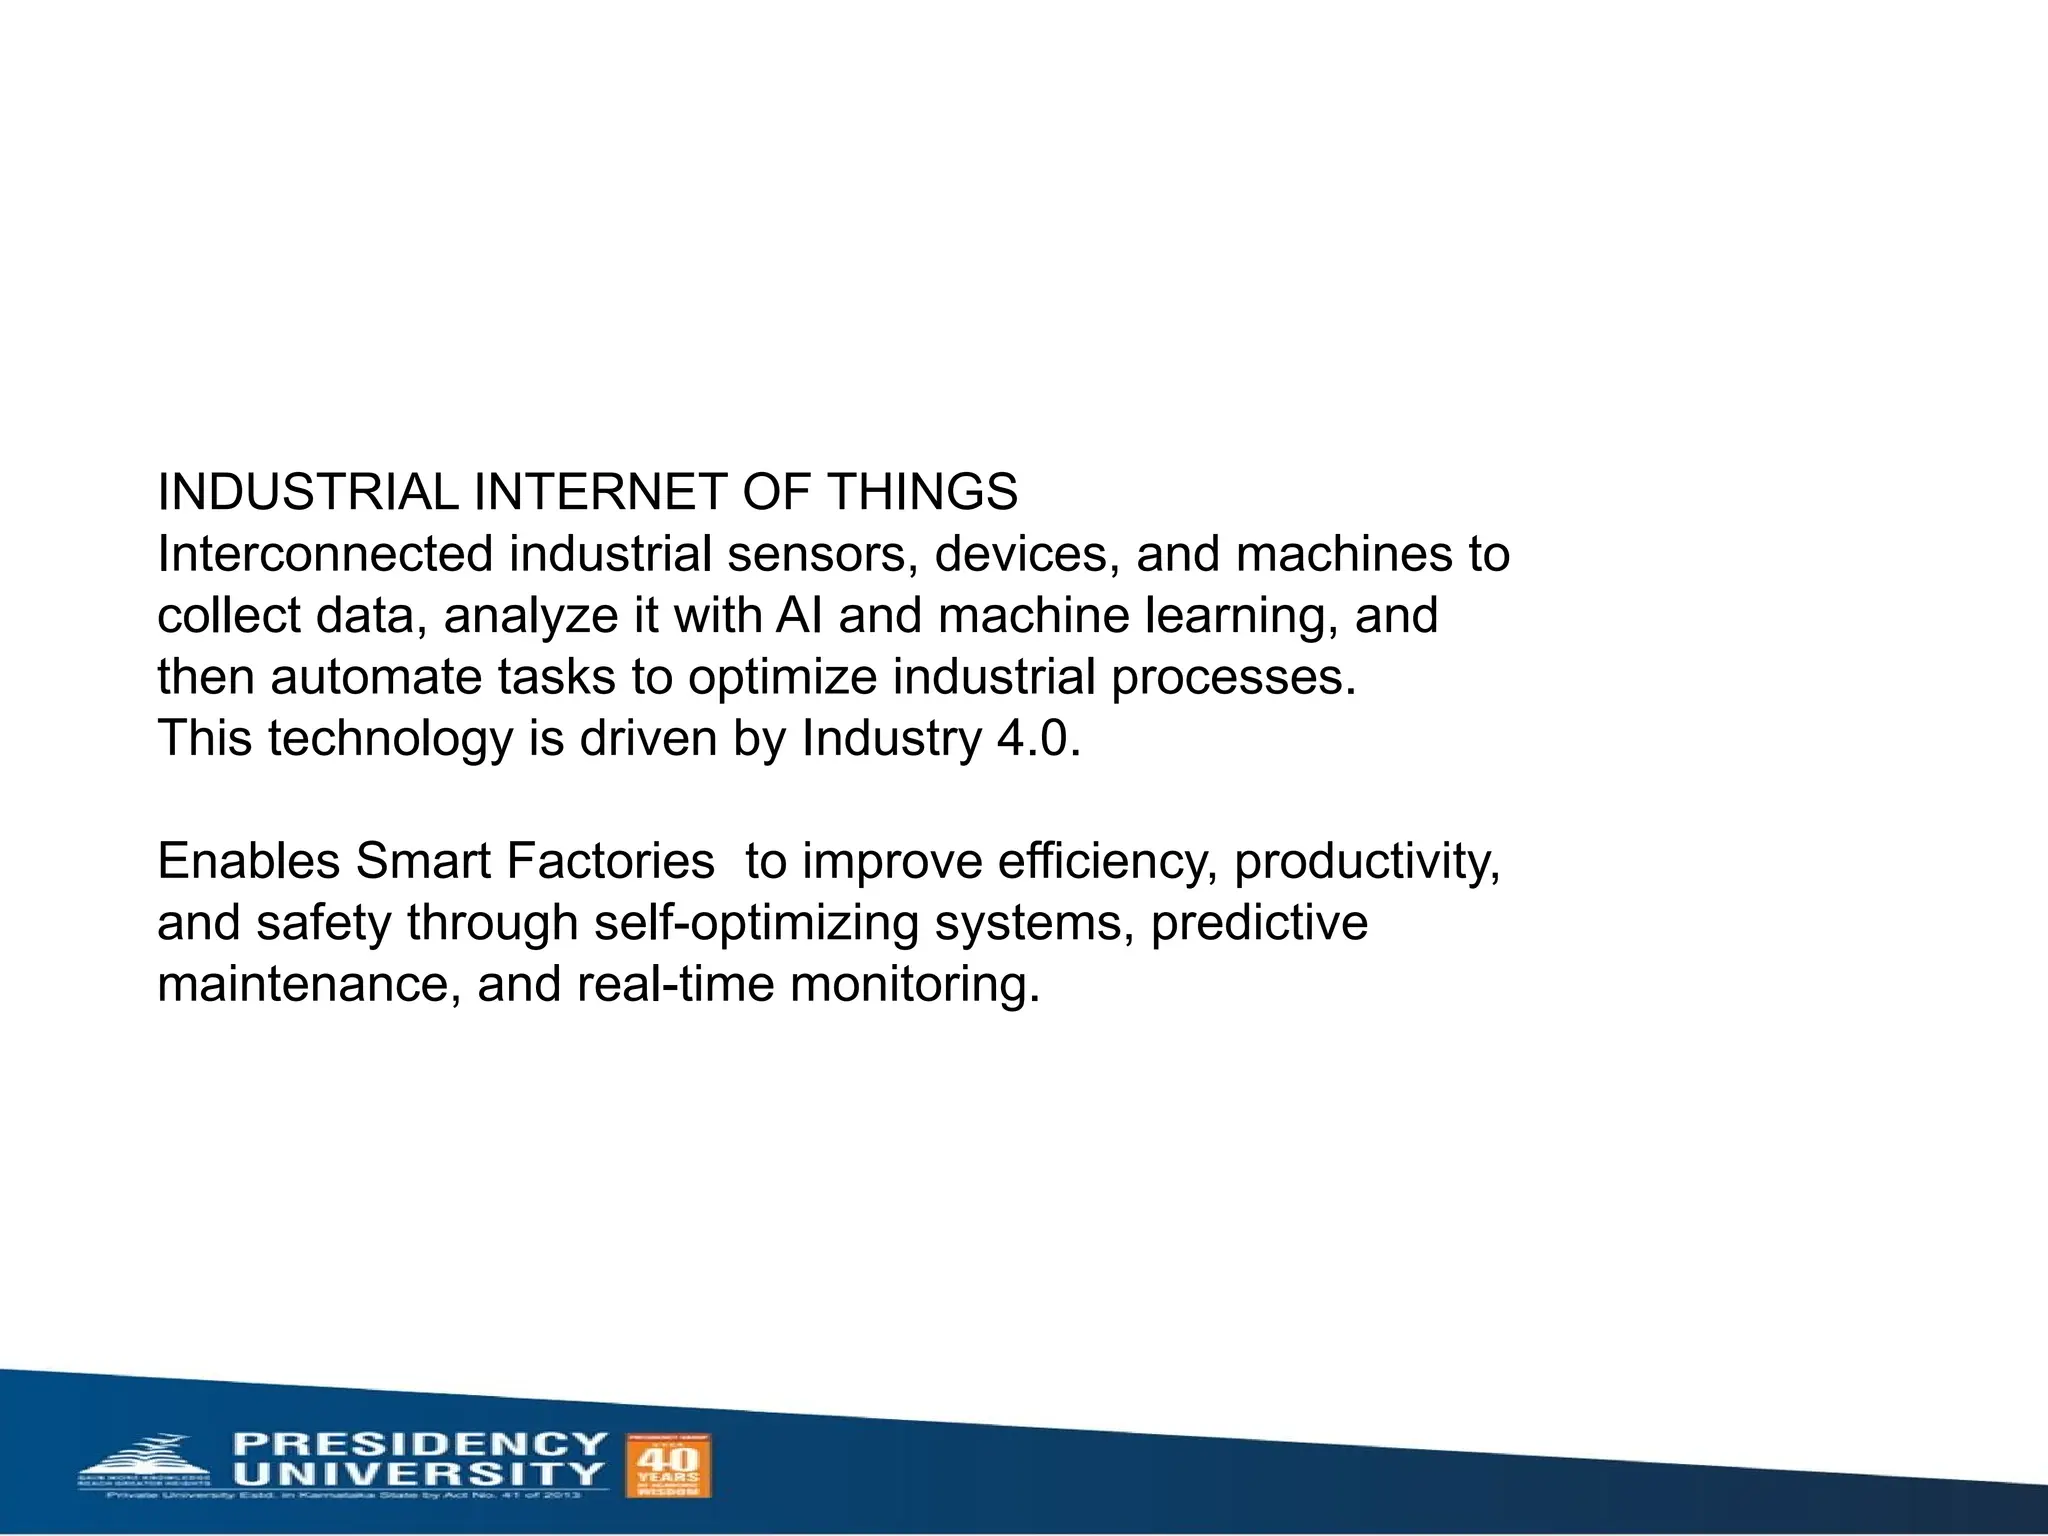
• IoT & IIoT
• Robotics & automation
• Cyber-Physical Systems (CPS)
This detailed evolution helps students understand how OM shifted from mechanical efficiency to digital transformation and data-driven operations.
⸻
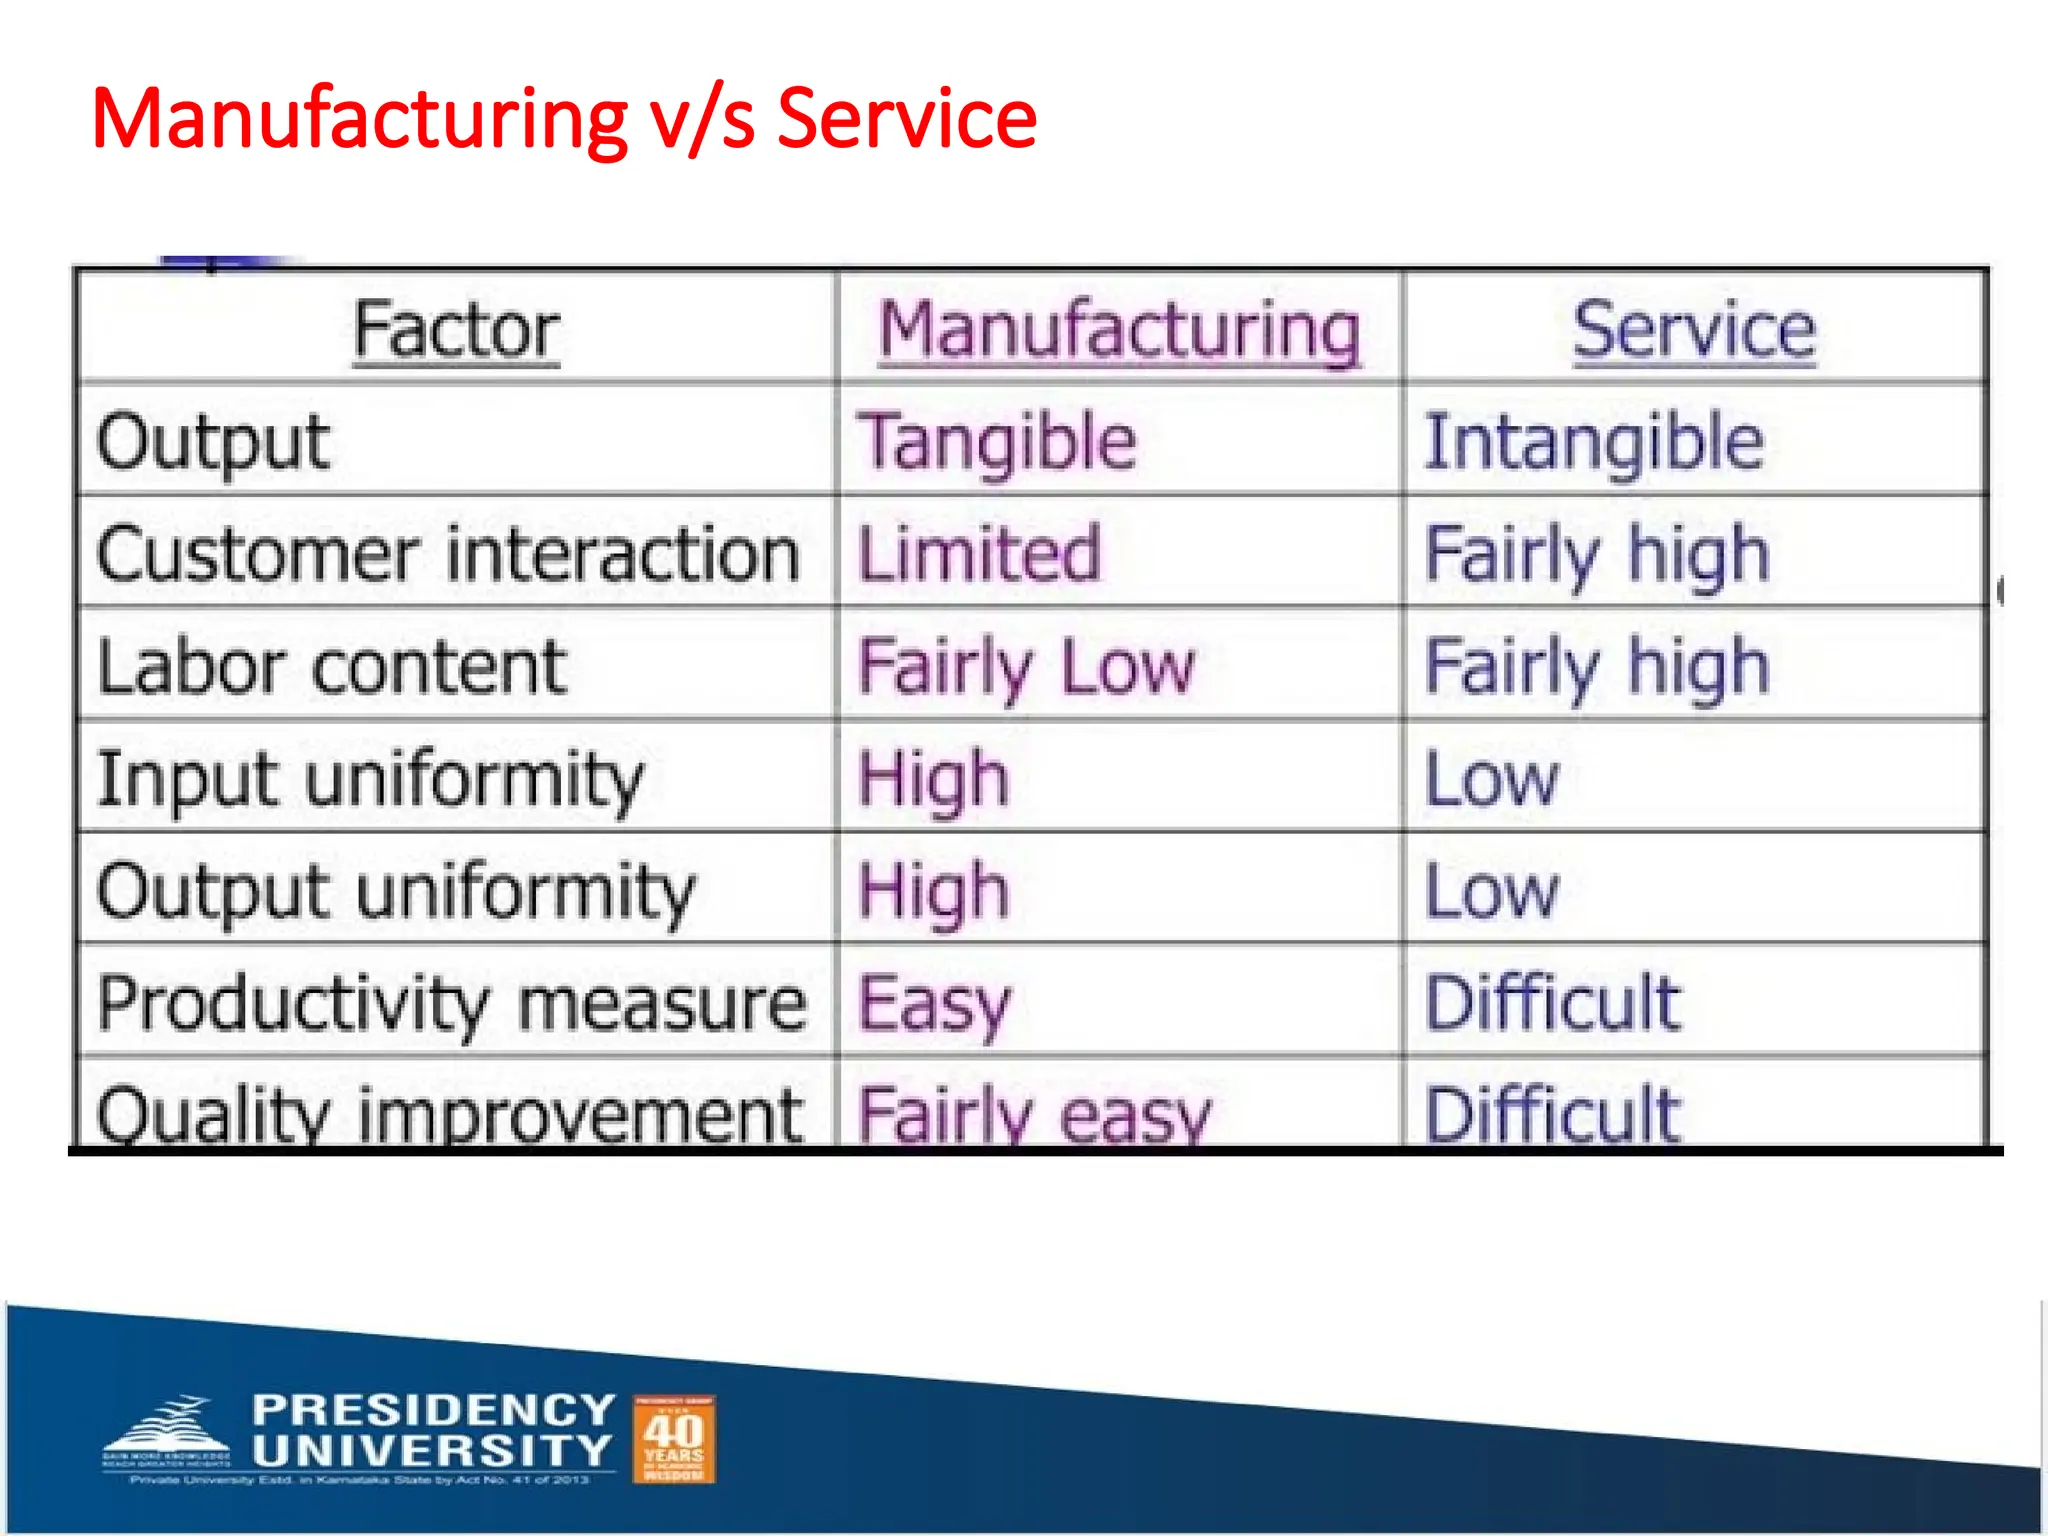
3. Key Concepts: Production vs. Operations
The presentation thoroughly differentiates:
Production
• Concerned with tangible goods
• Utilizes physical resources
• Output is measurable and storable
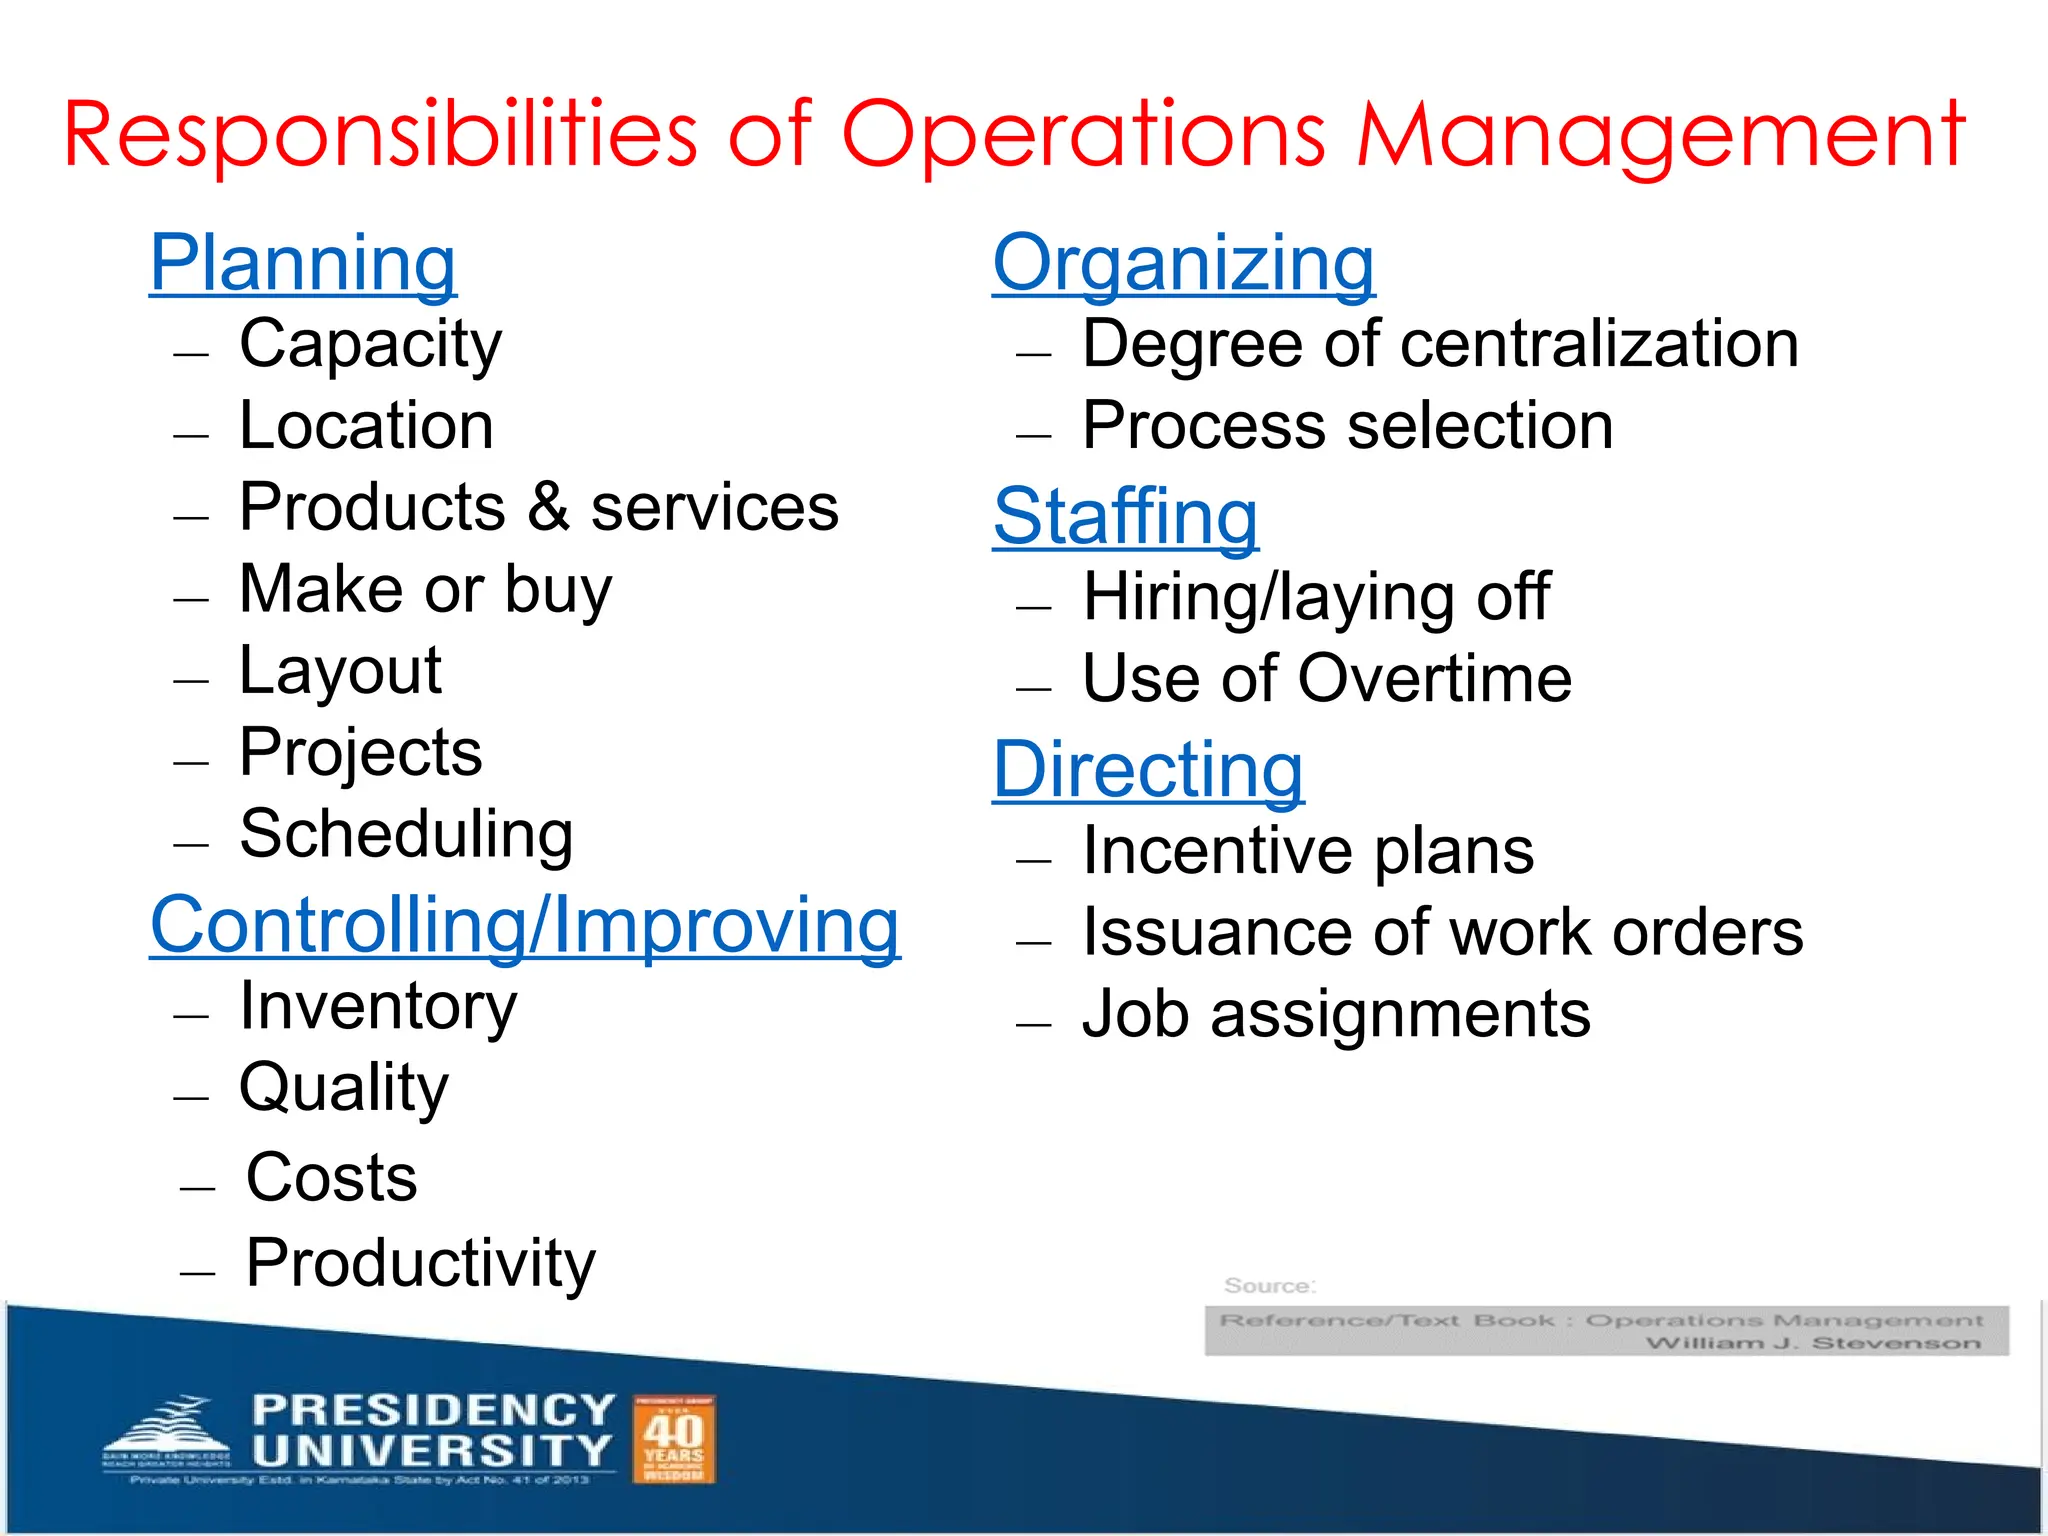
Operations
• Applies to goods and services
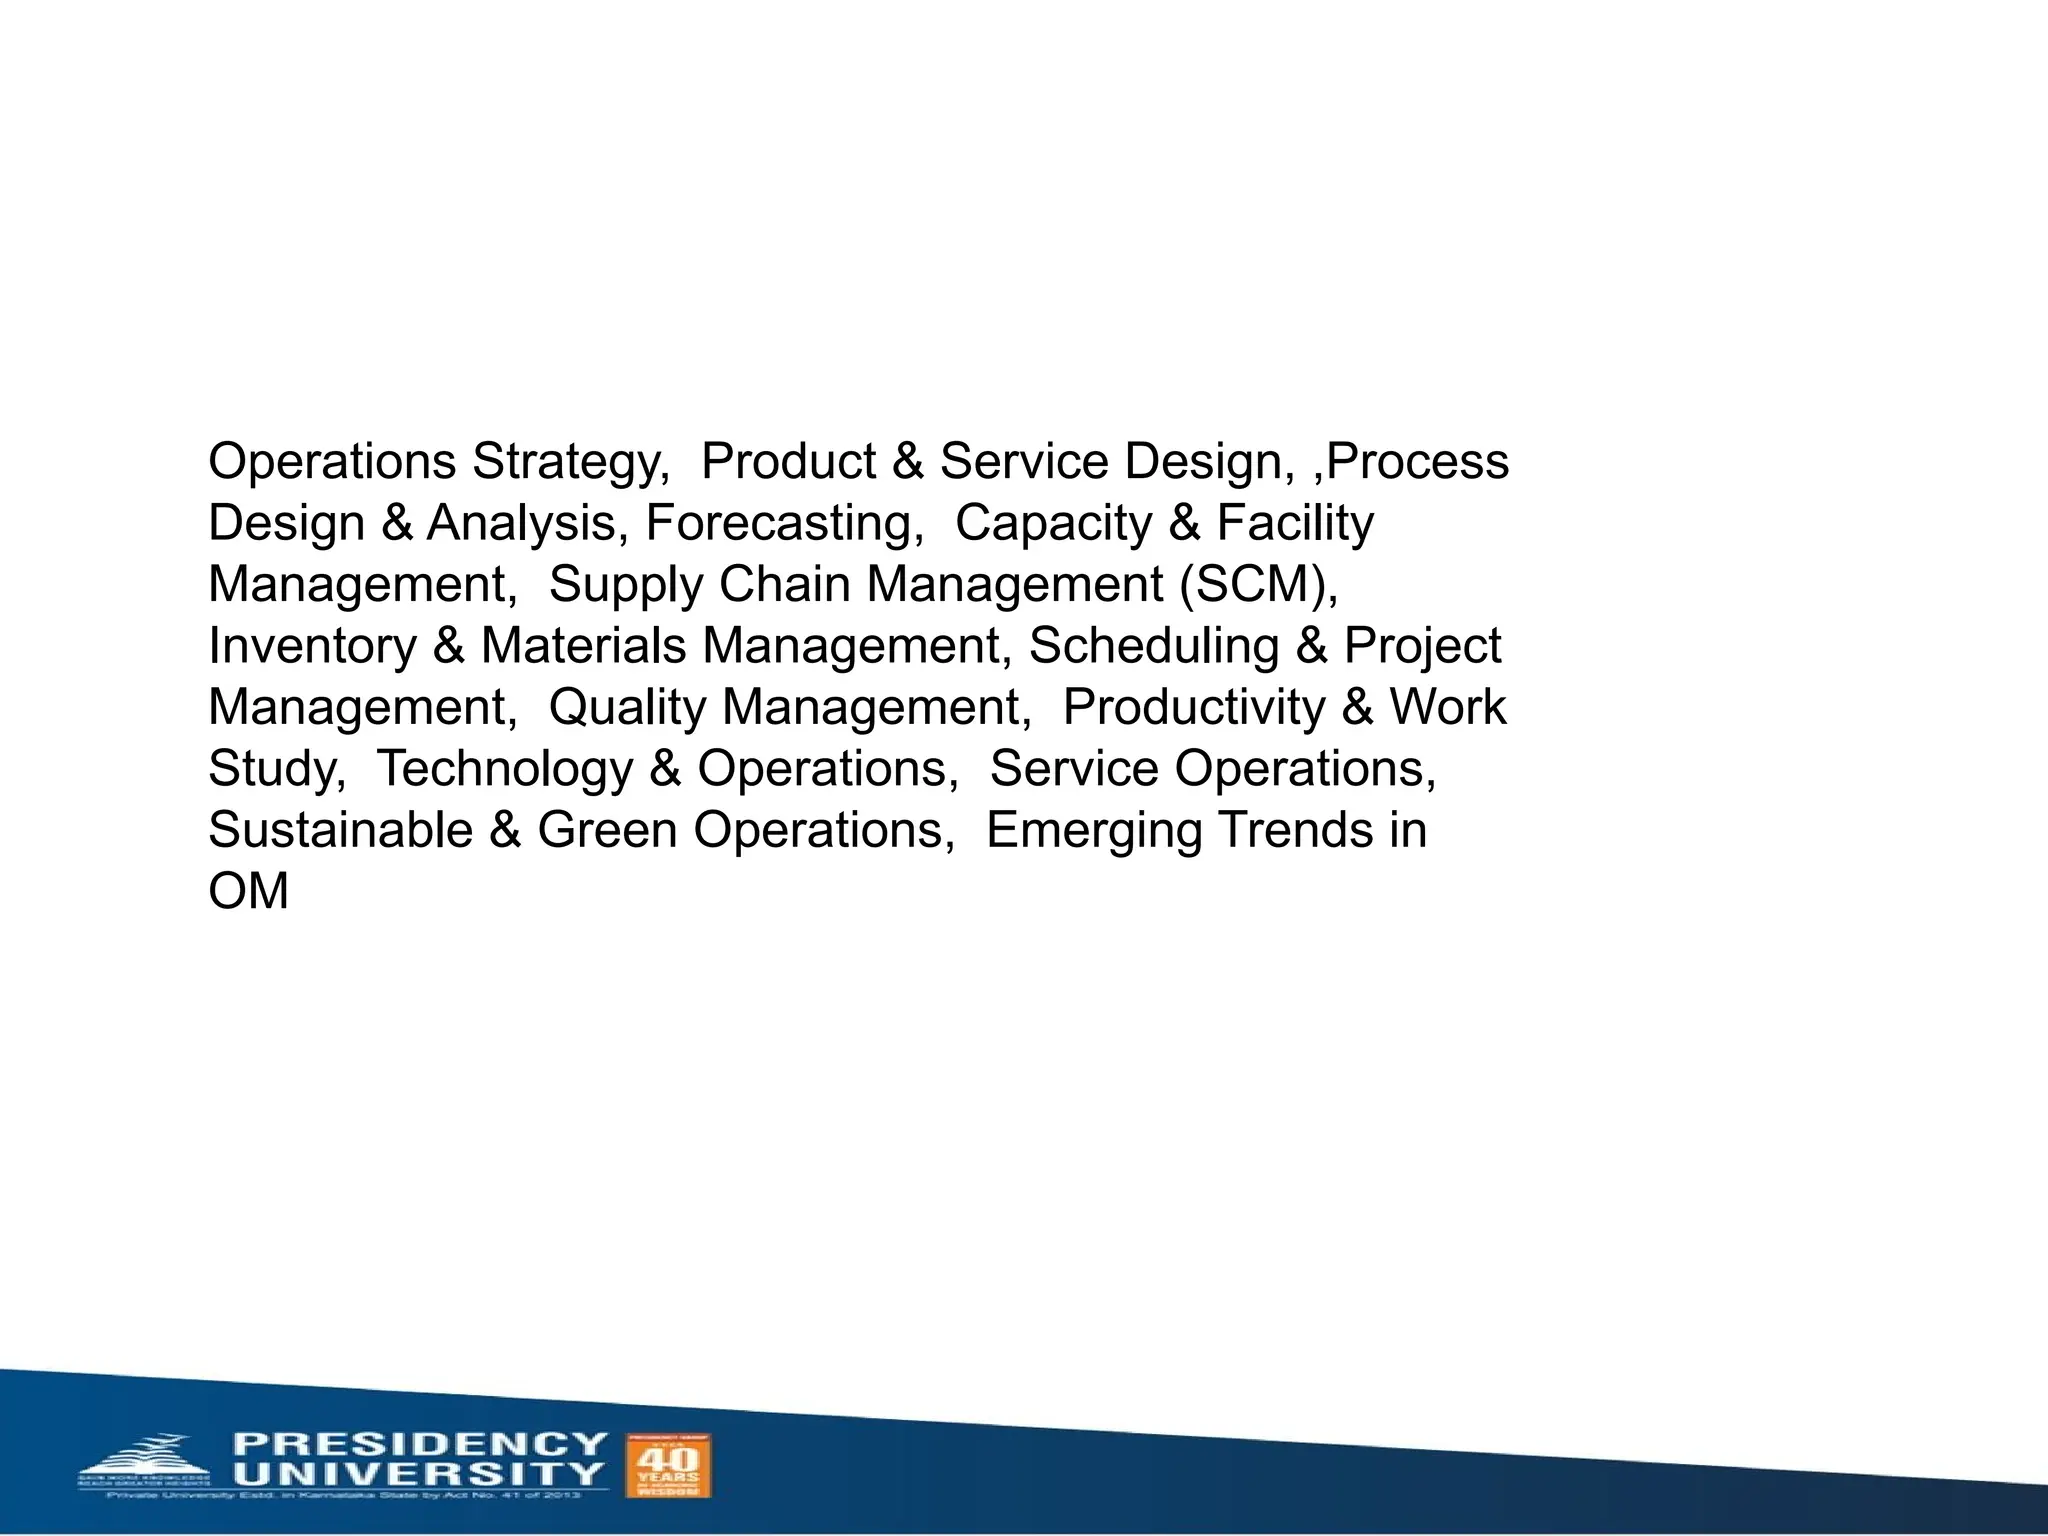
• Includes scheduling, quality, forecasting, layout, inventory, and process design
This clarity helps learners understand OM’s applicability
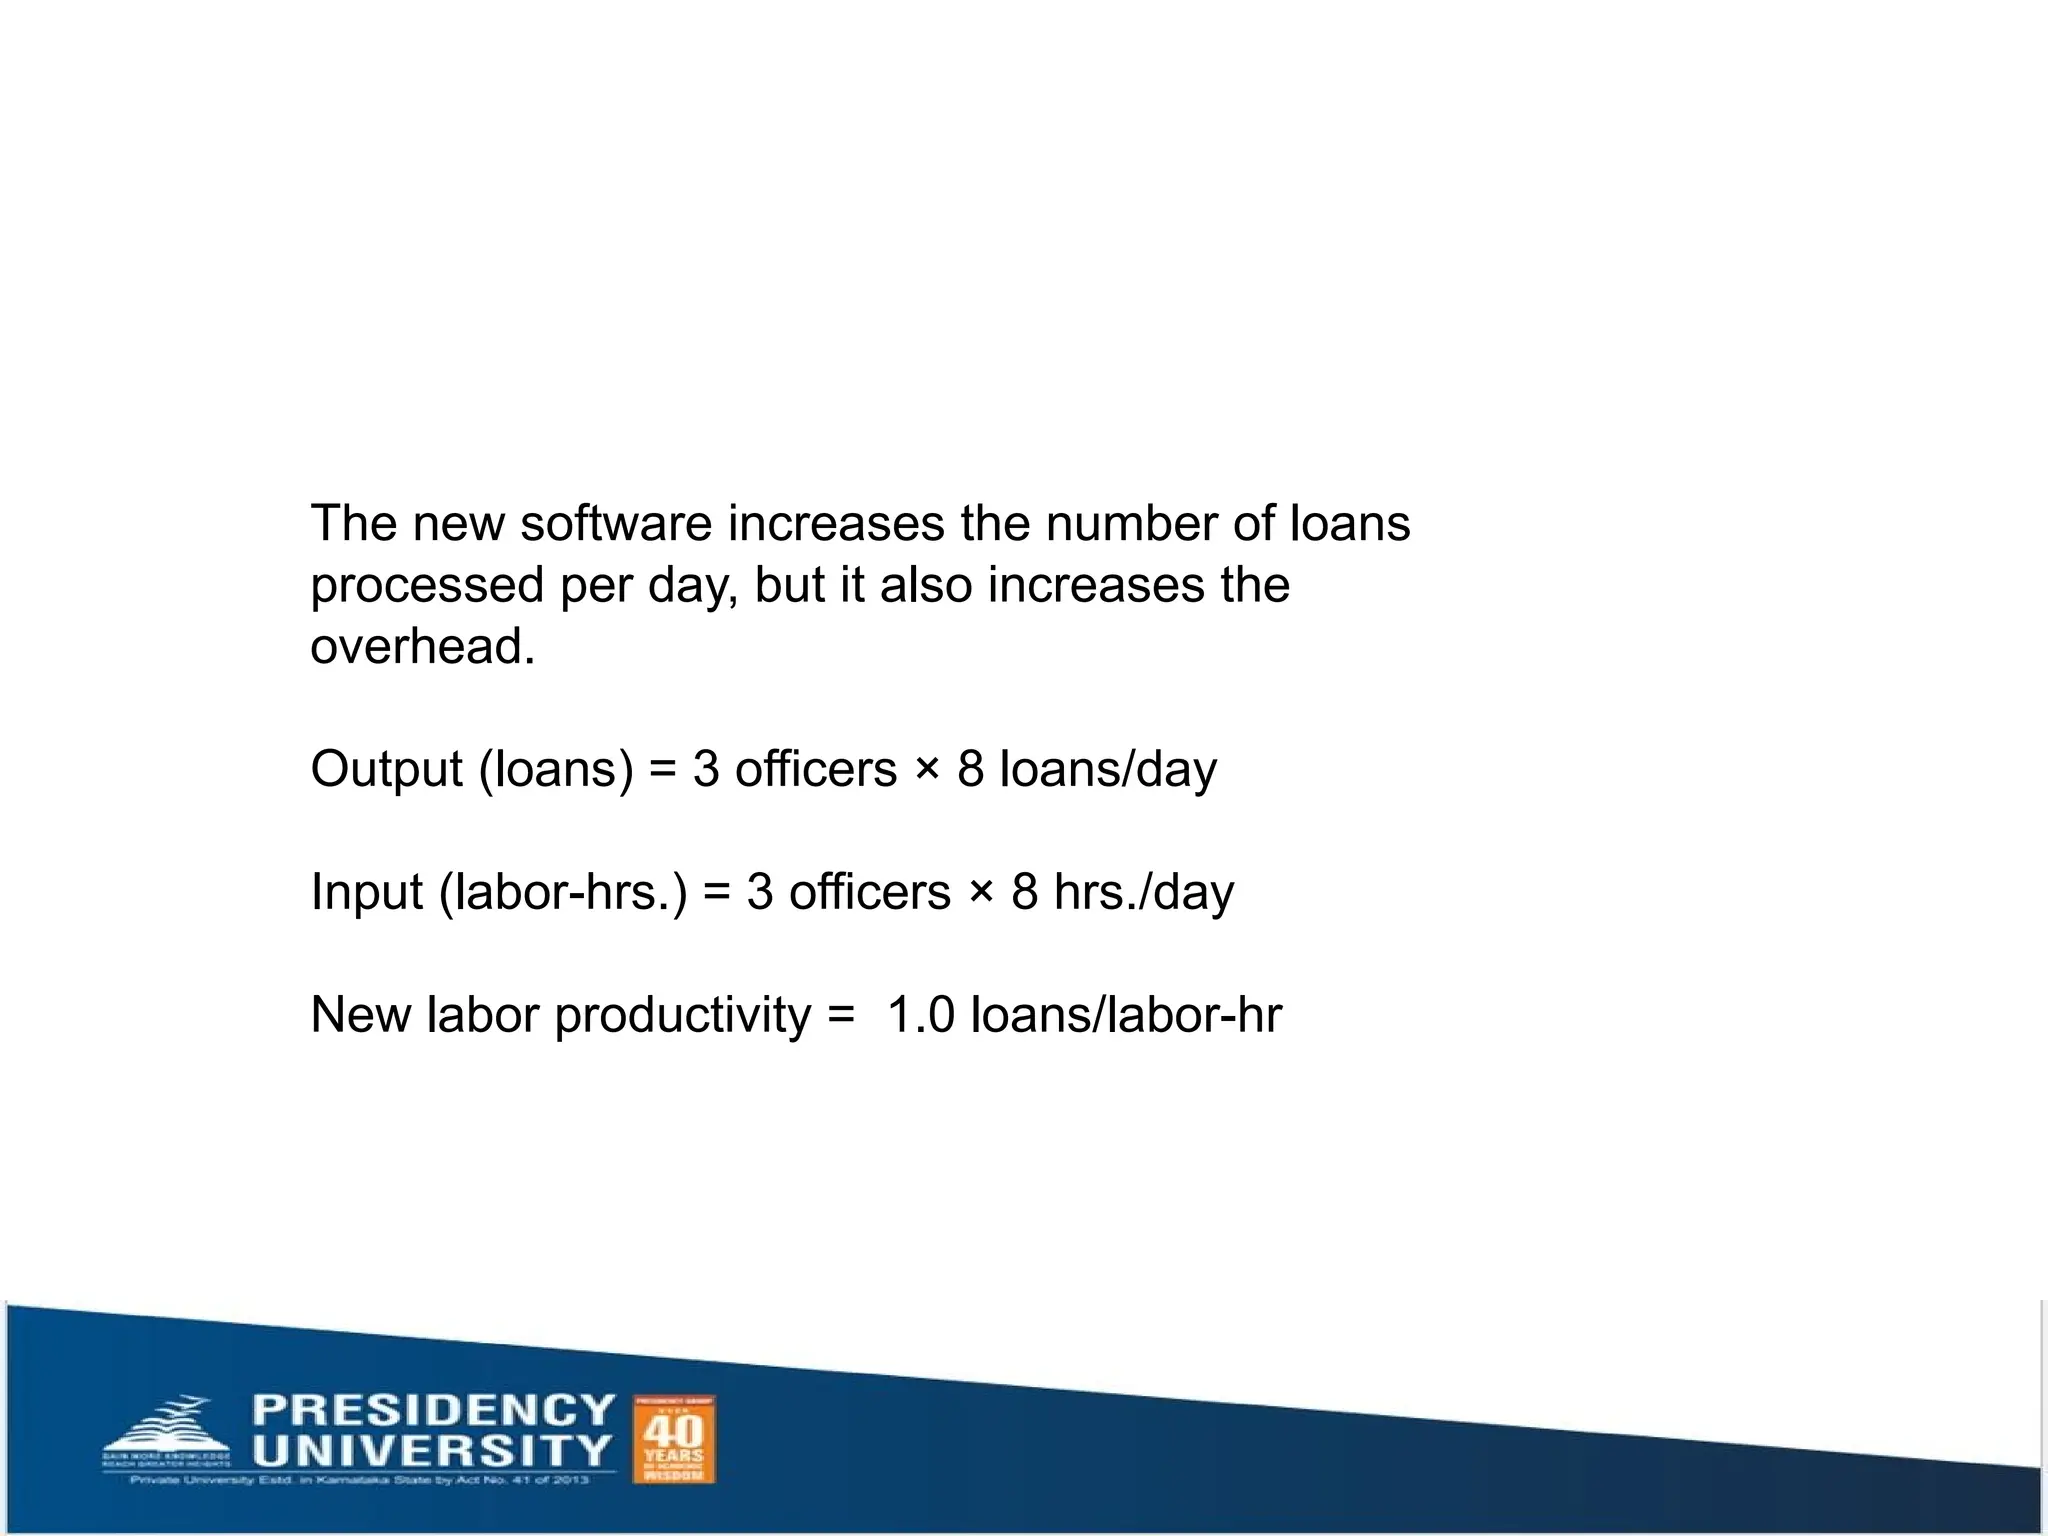
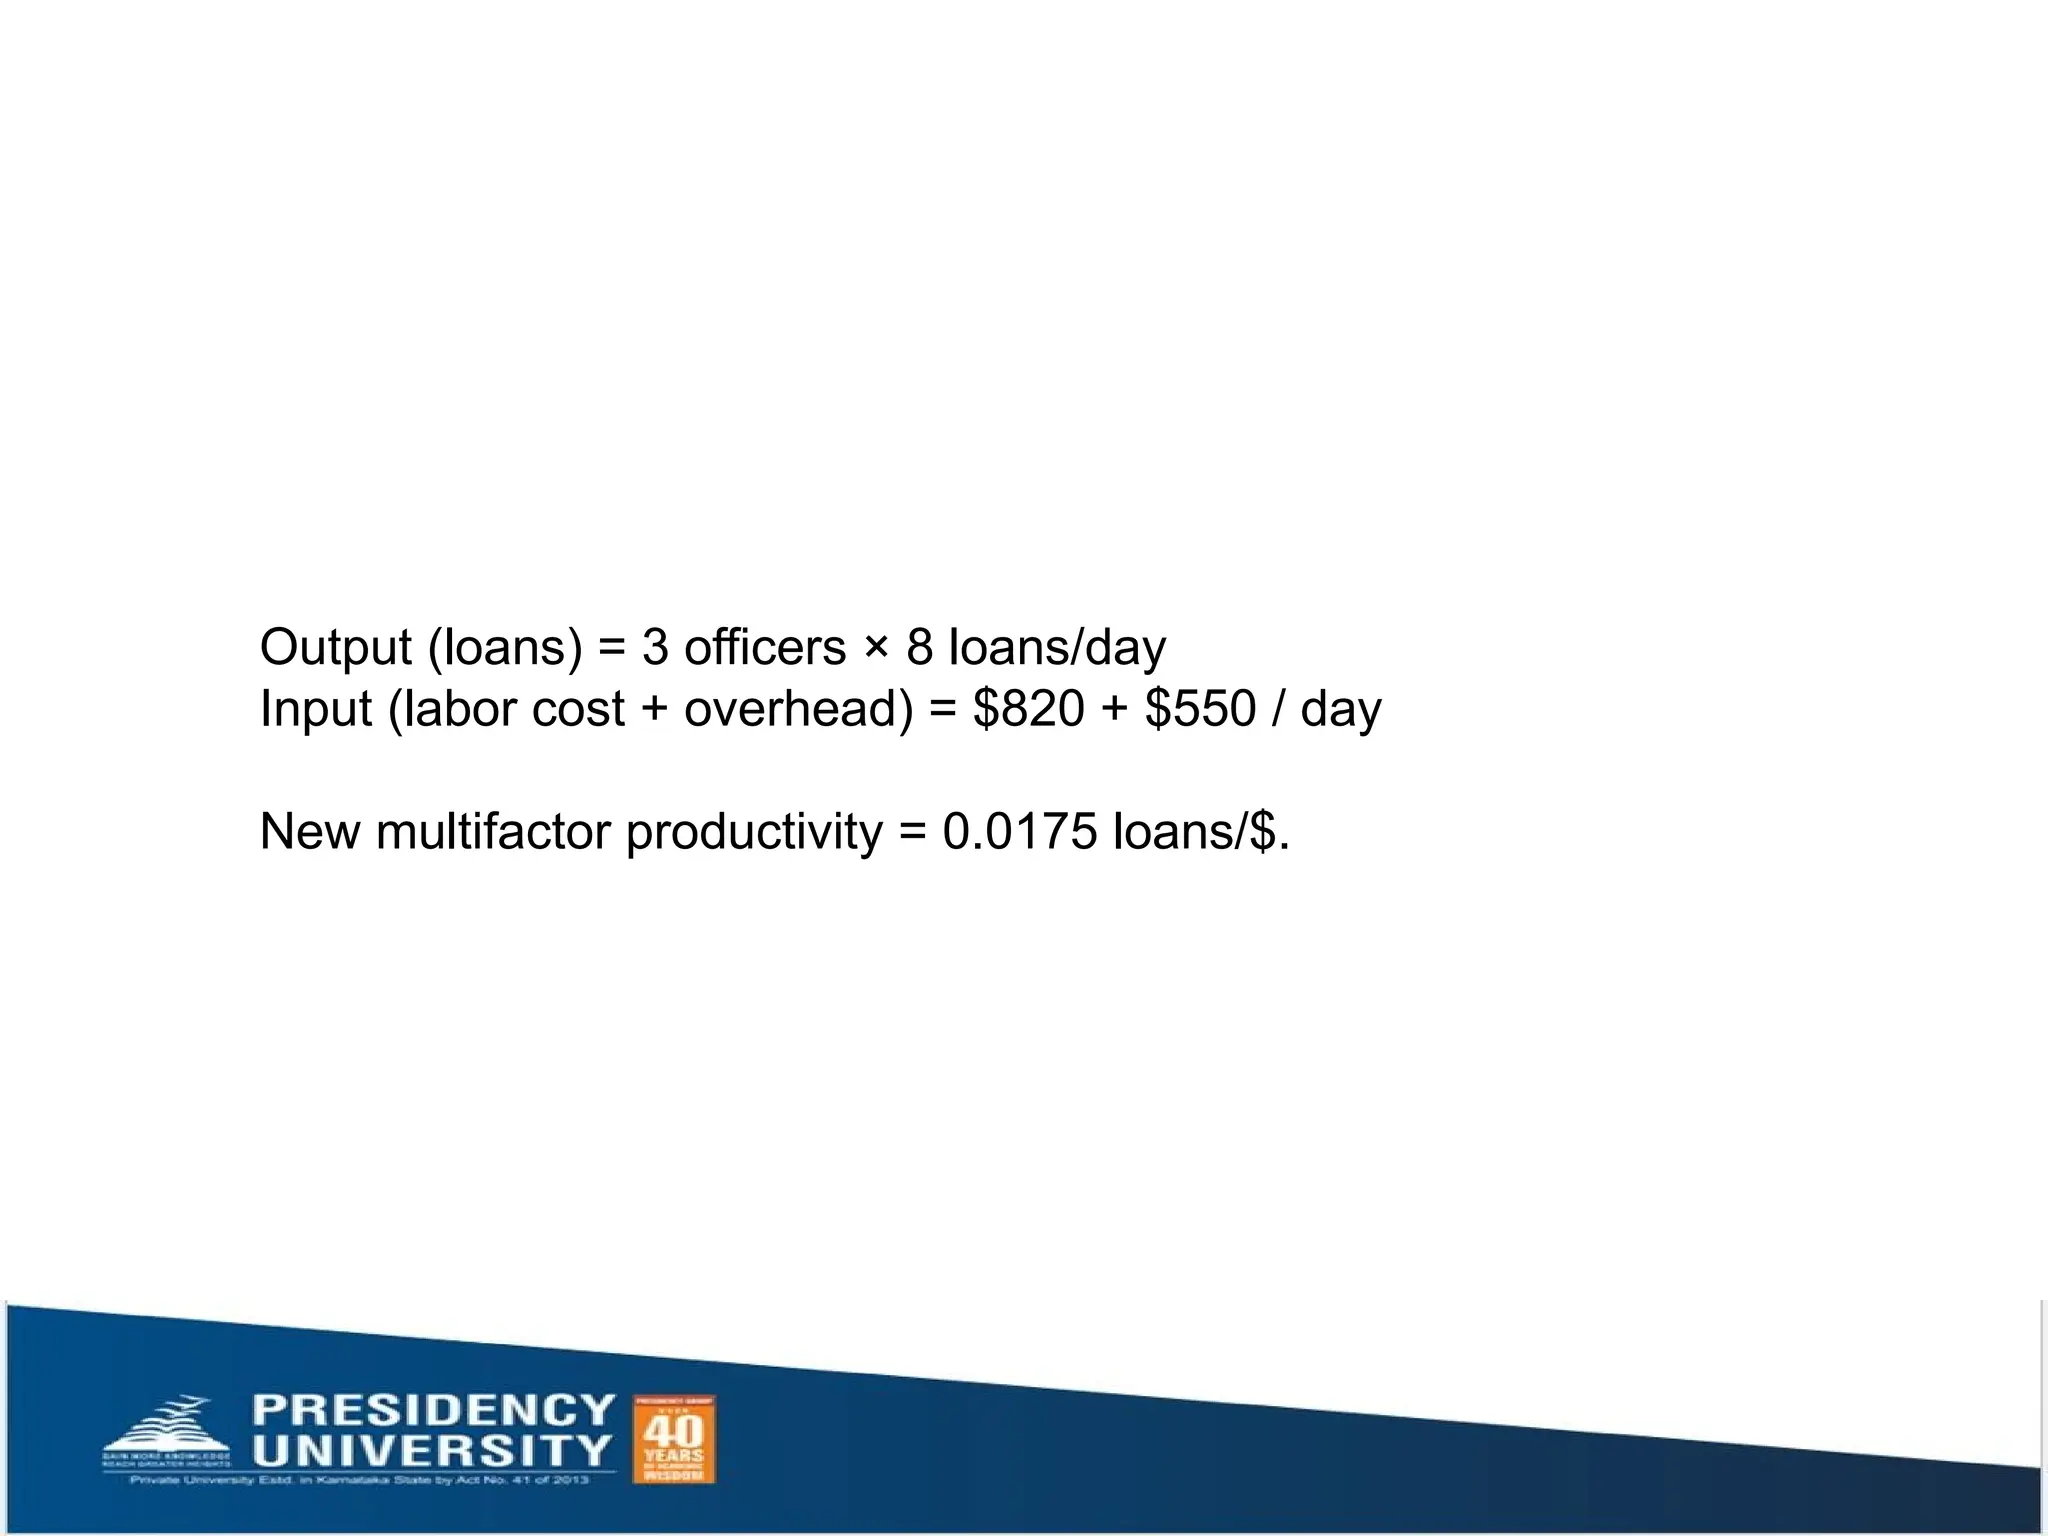
![Purchasing the new software would increase the labor
productivity by
( [1.0−0.625] / 0.625) x 100 = 60 %
It would increase the multifactor productivity (= [0.0175 −
0.0113]/0.0113) = 55 %
It is certainly worth the added overhead.](https://image.slidesharecdn.com/c974d243-94de-4a4a-8bc5-3ca9ba383d83-251203135616-354fd54d/75/c974d243-94de-4a4a-8bc5-3ca9ba383d83-ppt-84-2048.jpg)