6 PRINCIPLES OFTQM
Mark…
Leadership and Customer Service
Jon…
Employee Involvement and Continuous
Process Improvement
Karen…
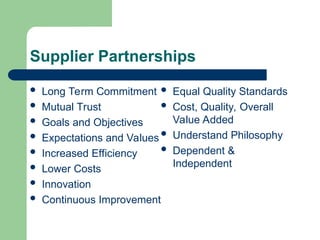
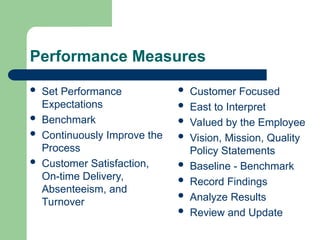
Supplier Partnerships and Performance
Measures
5.
LEADERSHIP
As organizations aresearching for new and/or better
ways to be successful, more attention and
accountability are being placed on those responsible
for charting the course, navigating the changes, and
keeping the organization afloat. The forces and factors
impacting organizations in the new millennium are
more interdependent, dramatic, fast paced, and
unpredictable. The complexity of what decision makers
in organizations must know and be able to do if
organizations survive and thrive is being influenced by
its leaders…
6.
Leadership…Why, What andHow?
Why…to motivate and inspire to a common
goal or purpose. Providing direction,
engagement, and encouragement
What…ethical, realistic, consistent,
responsible, courageous, visionary
How…”know where to go”. Have a vision
and create cohesion of the team
7.
Empower your employeesto allow them
to have the confidence, ability, and
commitment to take the responsibility
and ownership to improve the process
and initiate the necessary steps to satisfy
customer expectations – within well-
defined boundaries in order to achieve
organizational values and goals
8.
TEAM PROBLEM-SOLVING
Isa process that uses a group of people in a
team setting with the objective of resolving a
problem or improving an existing process at
any level of the organization
9.
Six Sigma
Refersto the number of standard deviations
found between the process central tendency
and the closest specifications.
Six Sigma Methodology
Disciplined team problem solving approach
using metrics and measurements to track
loss…statistical tools to ensure best results
10.
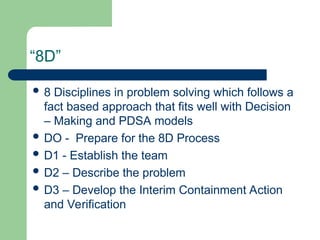
“8D”
8 Disciplinesin problem solving which follows a
fact based approach that fits well with Decision
– Making and PDSA models
DO - Prepare for the 8D Process
D1 - Establish the team
D2 – Describe the problem
D3 – Develop the Interim Containment Action
and Verification
11.
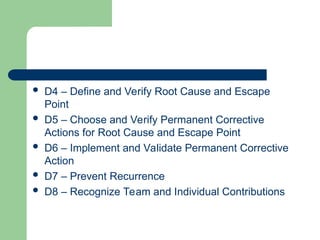
D4 –Define and Verify Root Cause and Escape
Point
D5 – Choose and Verify Permanent Corrective
Actions for Root Cause and Escape Point
D6 – Implement and Validate Permanent Corrective
Action
D7 – Prevent Recurrence
D8 – Recognize Team and Individual Contributions
12.
OTHER LEADERSHIP TOOLS
Psychological Type Theory (MBTI)
ORJI
Left – hand Column
Herman’s Brain Model
Dialogue
13.
MODELS and THEORIES
THE NORMATIVE DECISION MODEL
THE SITUATION LEADERSHIP THEORY
THE CONTINGENCY MODEL
THE PATH GOAL THEORY
POST-HEROIC LEADERSHIP
TRANSACTIONAL AND
TRANSFORMATIONAL LEADERSHIP
7 HABITS OF HIGHLY EFFECTIVE PEOPLE
14.
CUSTOMER SERVICE
CUSTOMER SERVICE
WHY FOCUS ON CUSTOMERS?
WHO ARE OUR CUSTOMERS?
WHAT DO CUSTOMERS WANT?
HOW DO WE BETTER UNDERSTAND OUR
CUSTOMERS?
HOW DO WE TRANSLATE CUSTOMER
NEEDS INTO
SPECIFICATIONS/STANDARDS?
15.
CUSTOMER SERVICE
CUSTOMER SERVICE
Why? Customers are the most important
asset. They determine the “bottom line”.
Who? External and Internal Customers
What? Quality, durability, and price.
Most critical or important…
function or reliability
How? Standards such as ISO 9000
16.
HOW DO WEBETTER UNDERSTAND
OUR CUSTOMER
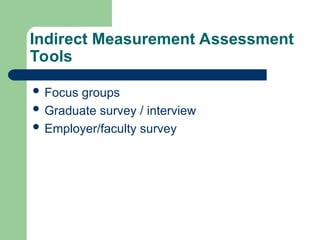
Comment cards
Surveys
Focus Groups
Telephone
Customer Visits
Report Cards
Internet
Employee Feedback
What is AcademicAssessment?
(Employee involvement)
A continuous improvement tool
Involving all employees and management
Not a method to grade student work
Students and employees grade course or
program
20.
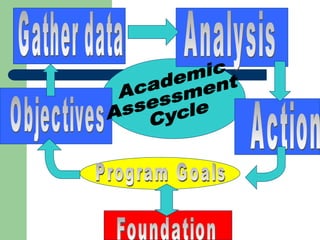
How do weassess academics
(Continuous improvement cycle)
Review mission and purpose statement
Review program goals
Identify assessment methods / intended
outcomes
Gather data – or make the measurement
Analyze the information
Take Action
22.
Review of missionand purpose /
Program goals
Courses and programs must be aligned with
mission and purpose of the entire
organization
Changes should be made at this level if
alignment is not found
23.
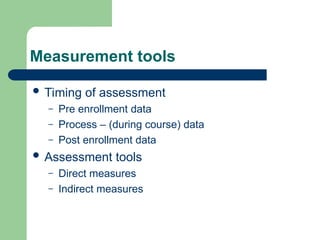
Measurement tools
Timingof assessment
– Pre enrollment data
– Process – (during course) data
– Post enrollment data
Assessment tools
– Direct measures
– Indirect measures
24.
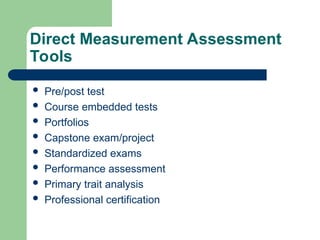
Direct Measurement Assessment
Tools
Pre/post test
Course embedded tests
Portfolios
Capstone exam/project
Standardized exams
Performance assessment
Primary trait analysis
Professional certification
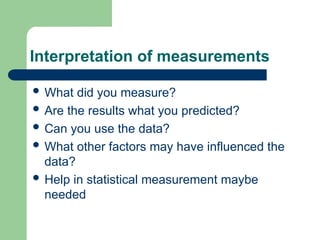
Interpretation of measurements
What did you measure?
Are the results what you predicted?
Can you use the data?
What other factors may have influenced the
data?
Help in statistical measurement maybe
needed
27.
Use the datato make changes
Slight variation may require small changes
Larger variations require new curriculum or
further study
Repeated large variations may require new
focus in mission or purpose.
28.
Variations of assessmentplans
Plans and methods will vary between
institutions
Plans and methods will vary internal to the
institution
Plans will vary based on needs and
resources
29.
How to besure assessment
successful
Why is assessment being done?
Management must support and provide resources for
assessment
Employees must understand the benefits and use
the method
Multiple sections of a course and multiple instructors
will complicate method
Communication is vital
Success should be rewarded
30.
Review
Assessment (PSDA)cycles are not just for
manufacturing business
Assessment methods can be used on small
scale projects or large scale operations
Find a process and follow it.
Several cycles will be needed to have valid
data
31.
Tools for SolvingProblems
and Making Decisions
Supplier Partnerships
and Performance Measures
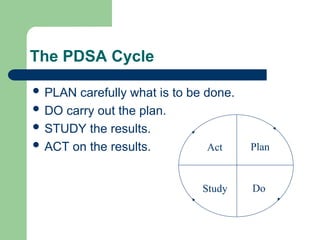
The PDSA Cycle
PLAN carefully what is to be done.
DO carry out the plan.
STUDY the results.
ACT on the results. Act Plan
Do
Study
36.
Act Plan
Do
Study
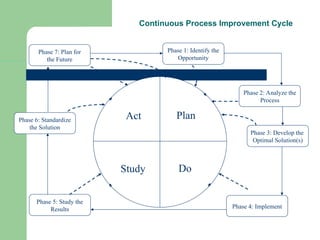
Continuous ProcessImprovement Cycle
Phase 1: Identify the
Opportunity
Phase 7: Plan for
the Future
Phase 6: Standardize
the Solution
Phase 5: Study the
Results Phase 4: Implement
Phase 3: Develop the
Optimal Solution(s)
Phase 2: Analyze the
Process
37.
Using a systematic,orderly approach will yield
the highest probability of success.