


![Power Consumption
• In 2006
• The energy consumed by IT infrastructures was
about 61 billion kWh, corresponding to 1.5% of
all the produced electricity.
• 2% of the global carbon emissions, equal to the
aviation industry.
• These figures are expected to double every 5
years. [1]
9](https://image.slidesharecdn.com/probabilisticconsolidationofvirtualmachinesinself-organizingclouddatacenters-140527042316-phpapp02/75/Probabilistic-consolidation-of-virtual-machines-in-self-organizing-cloud-data-centers-9-2048.jpg)
![• Most of the time servers
operate at 10-50% of their
full capacity. [2], [3]
• Caused by the changing
variability of VMs’ workload.
[4],[5]
• The DC is planned to sustain
the peaks of load, while for
long periods of time the load
is much lower.
12
Utilization of each server](https://image.slidesharecdn.com/probabilisticconsolidationofvirtualmachinesinself-organizingclouddatacenters-140527042316-phpapp02/75/Probabilistic-consolidation-of-virtual-machines-in-self-organizing-cloud-data-centers-12-2048.jpg)
![• An active but idle server
consumes 50-70% of the
power consumed when fully
utilized. [6]
• Although the power is used
in the computing as much as
possible, the utilization rate
for each server itself does
not achieve the best.
13
Utilization of each server](https://image.slidesharecdn.com/probabilisticconsolidationofvirtualmachinesinself-organizingclouddatacenters-140527042316-phpapp02/75/Probabilistic-consolidation-of-virtual-machines-in-self-organizing-cloud-data-centers-13-2048.jpg)

![Consolidation
• Allocate the max number of VMs in the min
number of physical machines [7].
• Allows unneeded servers to be put into
• A low-power state or switched off
• Devoted to the execution of incremental workload.
15](https://image.slidesharecdn.com/probabilisticconsolidationofvirtualmachinesinself-organizingclouddatacenters-140527042316-phpapp02/75/Probabilistic-consolidation-of-virtual-machines-in-self-organizing-cloud-data-centers-15-2048.jpg)
![The complexity of the problem
• The optimal assignment of VMs to PM is analogous
to the NP-hard “Bin Packing Problem” [17], [1], [28]
• Assigning a given set of items of variable size to the min
number of bins taken from a given set.
16](https://image.slidesharecdn.com/probabilisticconsolidationofvirtualmachinesinself-organizingclouddatacenters-140527042316-phpapp02/75/Probabilistic-consolidation-of-virtual-machines-in-self-organizing-cloud-data-centers-16-2048.jpg)
![Forecast the load?
• [27] and [13]—try to forecast the processing
load and aim at determining the min number of
servers that should be switched on to satisfy the
demand.
• How to correctly set the server’s number?
• How to predict the processing load precisely?
• How the VMs map to servers in a dynamic
environment?
21](https://image.slidesharecdn.com/probabilisticconsolidationofvirtualmachinesinself-organizingclouddatacenters-140527042316-phpapp02/75/Probabilistic-consolidation-of-virtual-machines-in-self-organizing-cloud-data-centers-21-2048.jpg)
![Heuristic approaches?
• The heuristic approaches presented are use
• the Best Fit Decreasing algorithms. [1]
• the First Fit Decreasing algorithms. [28]
• the Constraint Programming paradigm. [30]
• They use lower and upper utilization thresholds
to decide when execute migration. [29]
23](https://image.slidesharecdn.com/probabilisticconsolidationofvirtualmachinesinself-organizingclouddatacenters-140527042316-phpapp02/75/Probabilistic-consolidation-of-virtual-machines-in-self-organizing-cloud-data-centers-23-2048.jpg)

![P2P Model?
• The data center is modeled as a P2P network. [33]
• Server explore the network to collect information that
can later be used to migrate VMs.
• The V-MAN system[34] uses a gossip protocol to
communicate their state to each other.
• The complete absence of centralized control can be
seen as an obstacle by the data center administrator.
25](https://image.slidesharecdn.com/probabilisticconsolidationofvirtualmachinesinself-organizingclouddatacenters-140527042316-phpapp02/75/Probabilistic-consolidation-of-virtual-machines-in-self-organizing-cloud-data-centers-25-2048.jpg)
![In the multi-resource problem
• Based on the first-fit approximation. [38]
• Using an LP formulation[39].
• Performs dynamic consolidation based on
constraint programming. [41]
• But they all need to use any complex centralized
algorithm.
26](https://image.slidesharecdn.com/probabilisticconsolidationofvirtualmachinesinself-organizingclouddatacenters-140527042316-phpapp02/75/Probabilistic-consolidation-of-virtual-machines-in-self-organizing-cloud-data-centers-26-2048.jpg)


![Power Consume
• As the CPU utilization increases, the consumed
power can be assumed increase linearly.[13][14]
• In analytical and simulation experiments
presented in this study, the power consumed by
a single server is expressed as:
55](https://image.slidesharecdn.com/probabilisticconsolidationofvirtualmachinesinself-organizingclouddatacenters-140527042316-phpapp02/75/Probabilistic-consolidation-of-virtual-machines-in-self-organizing-cloud-data-centers-55-2048.jpg)


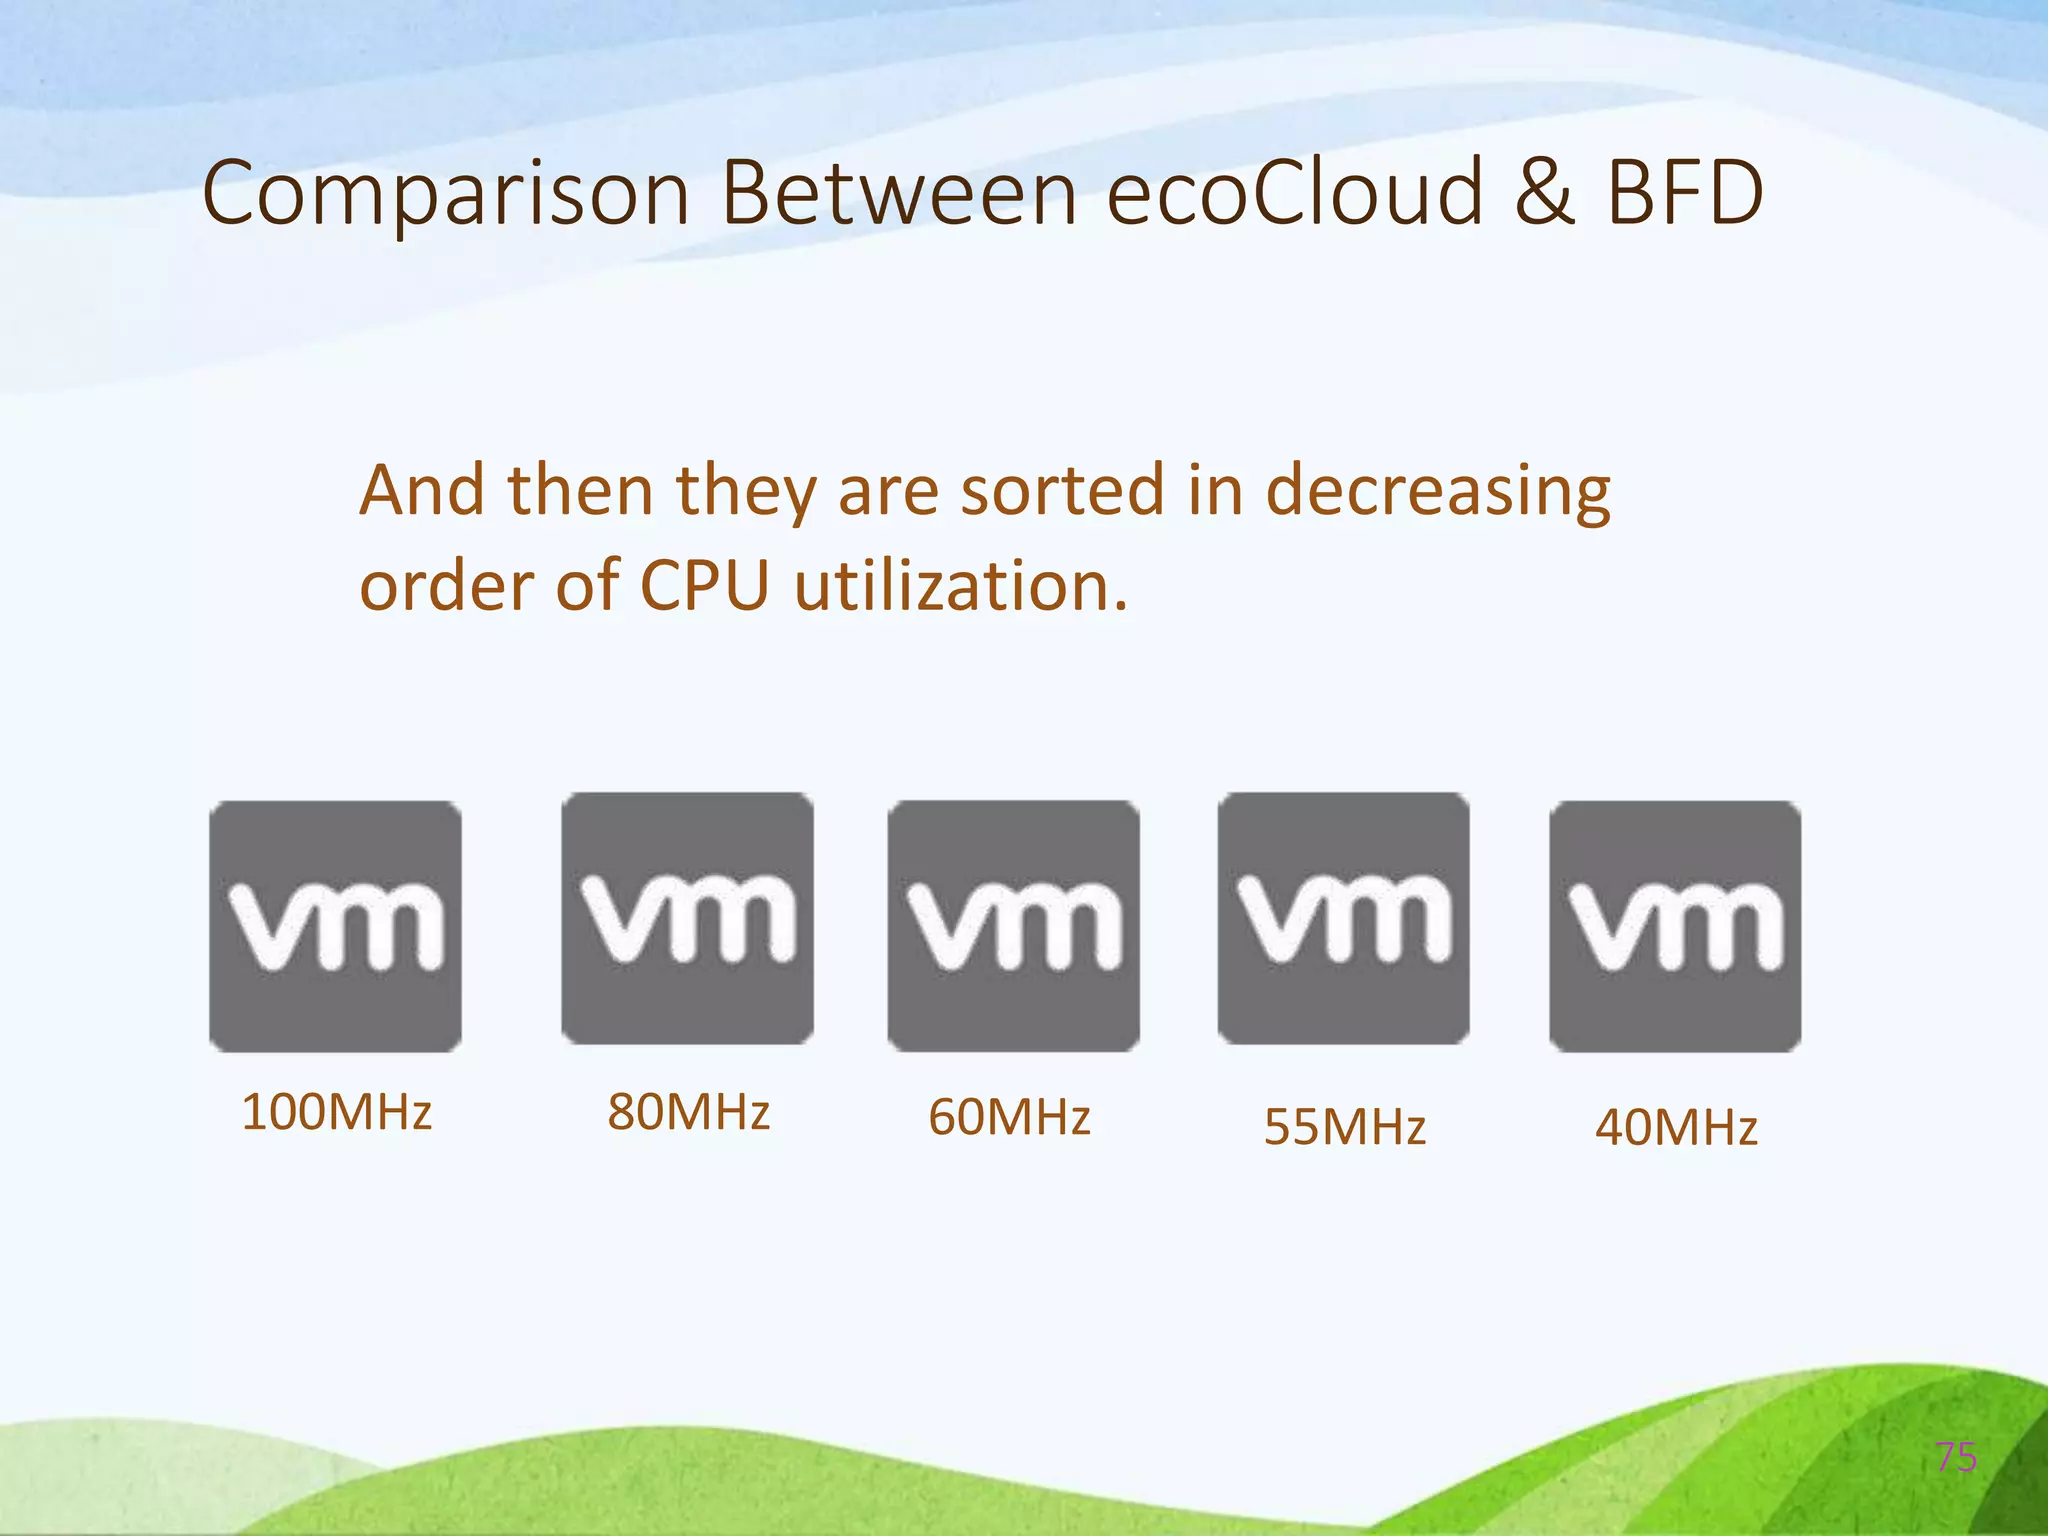
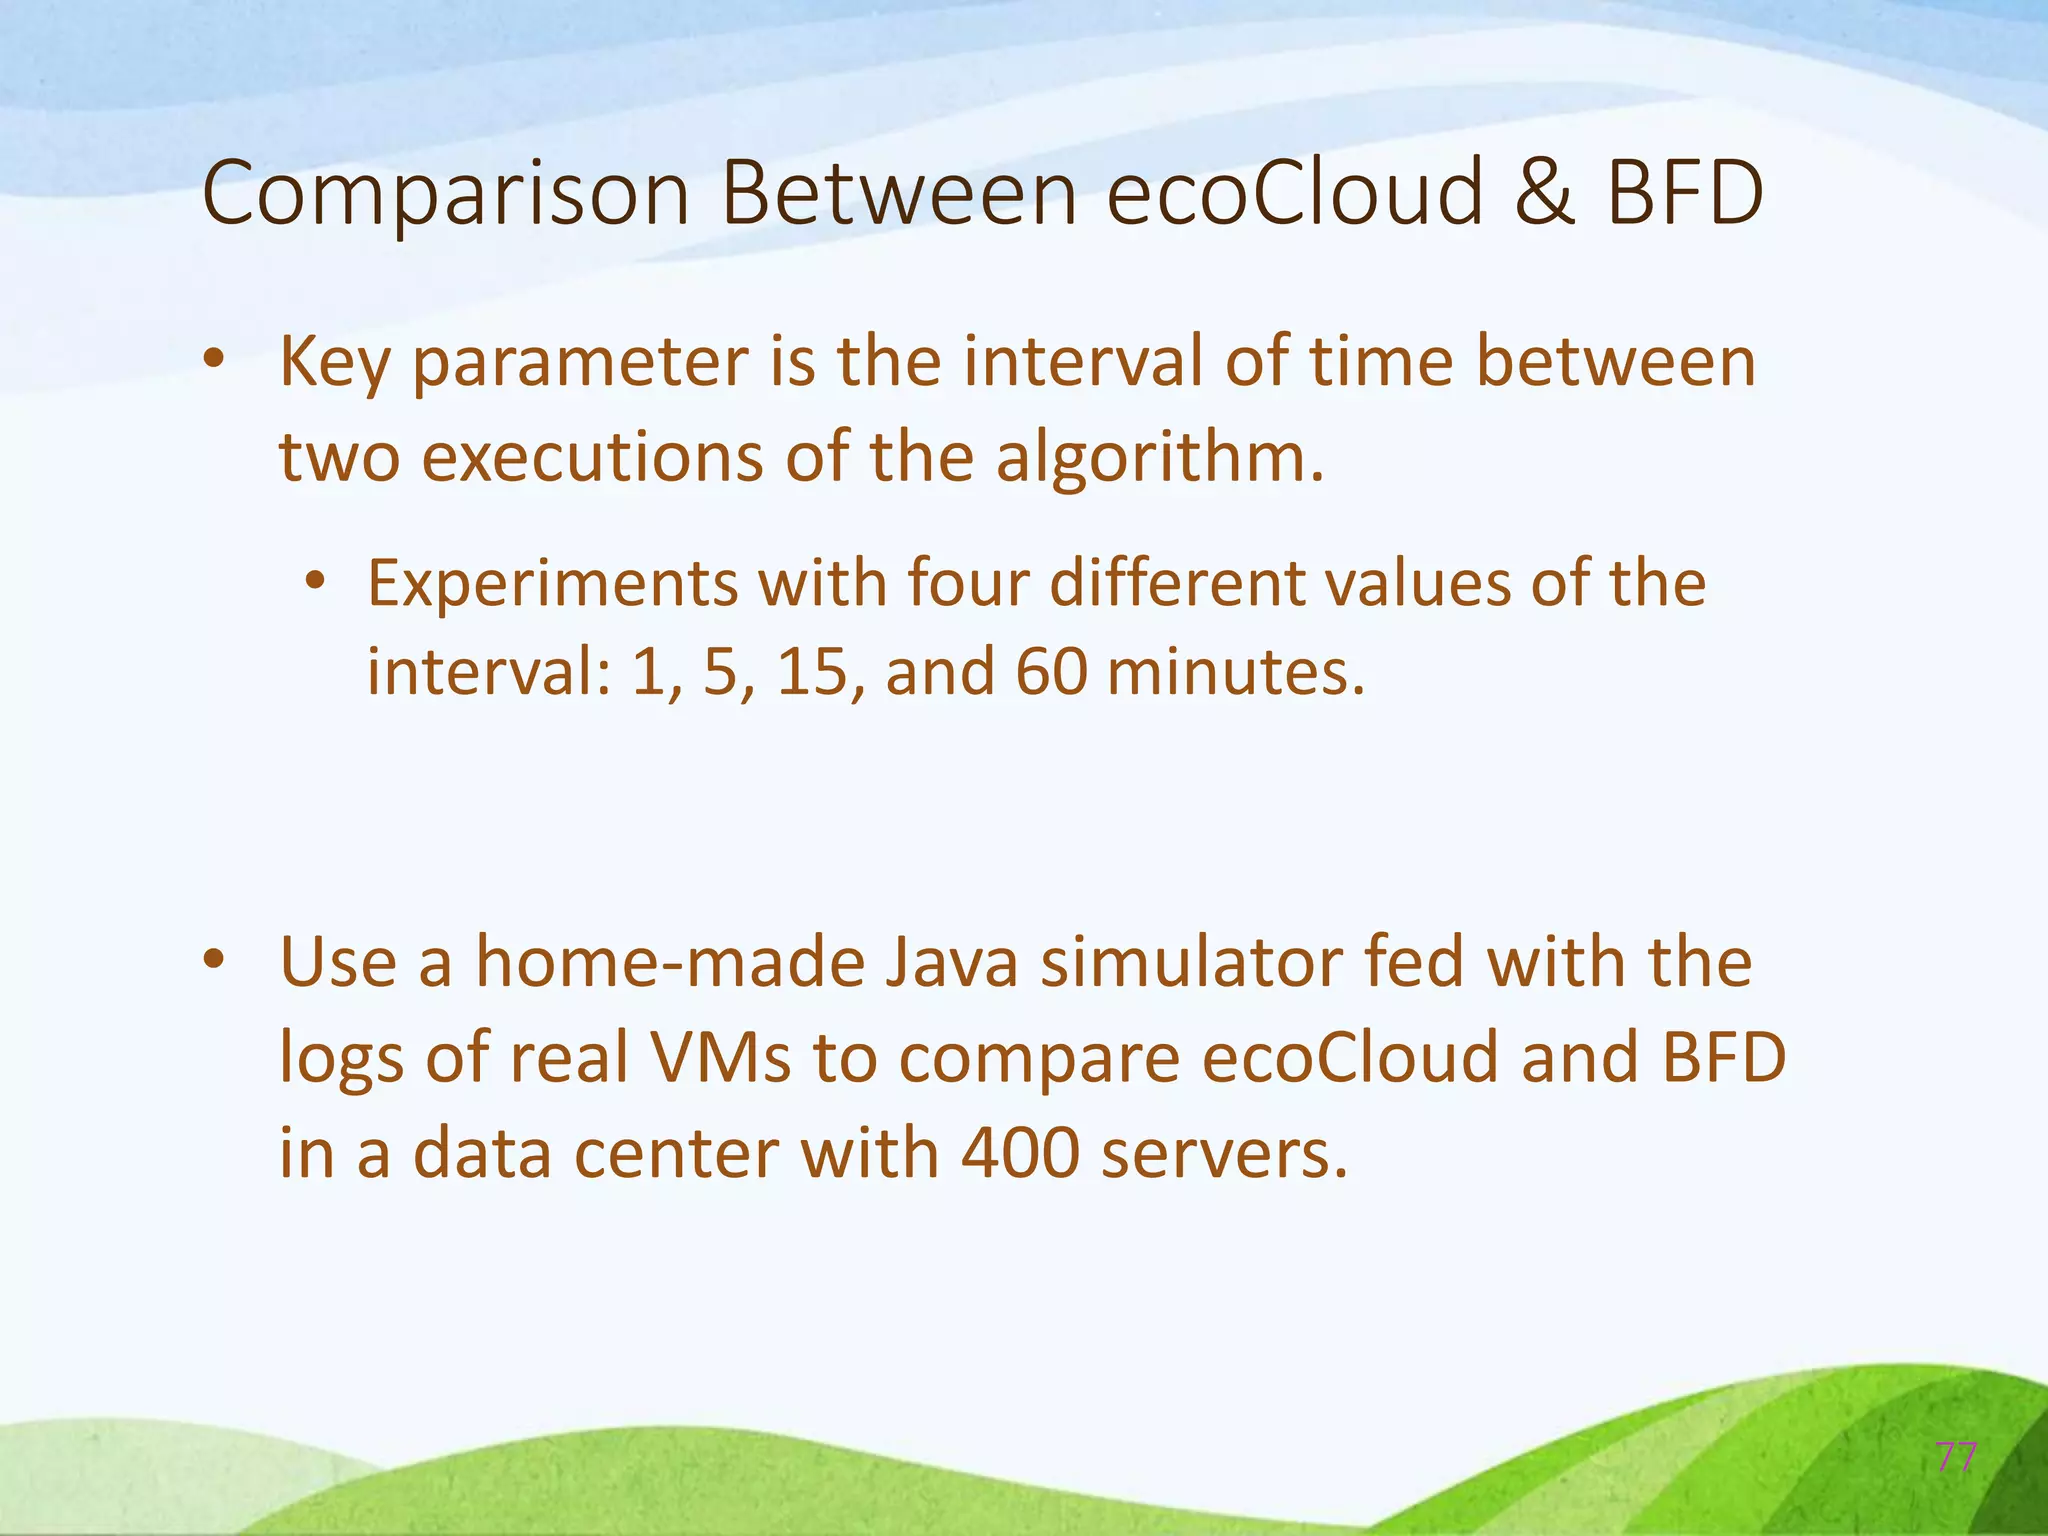
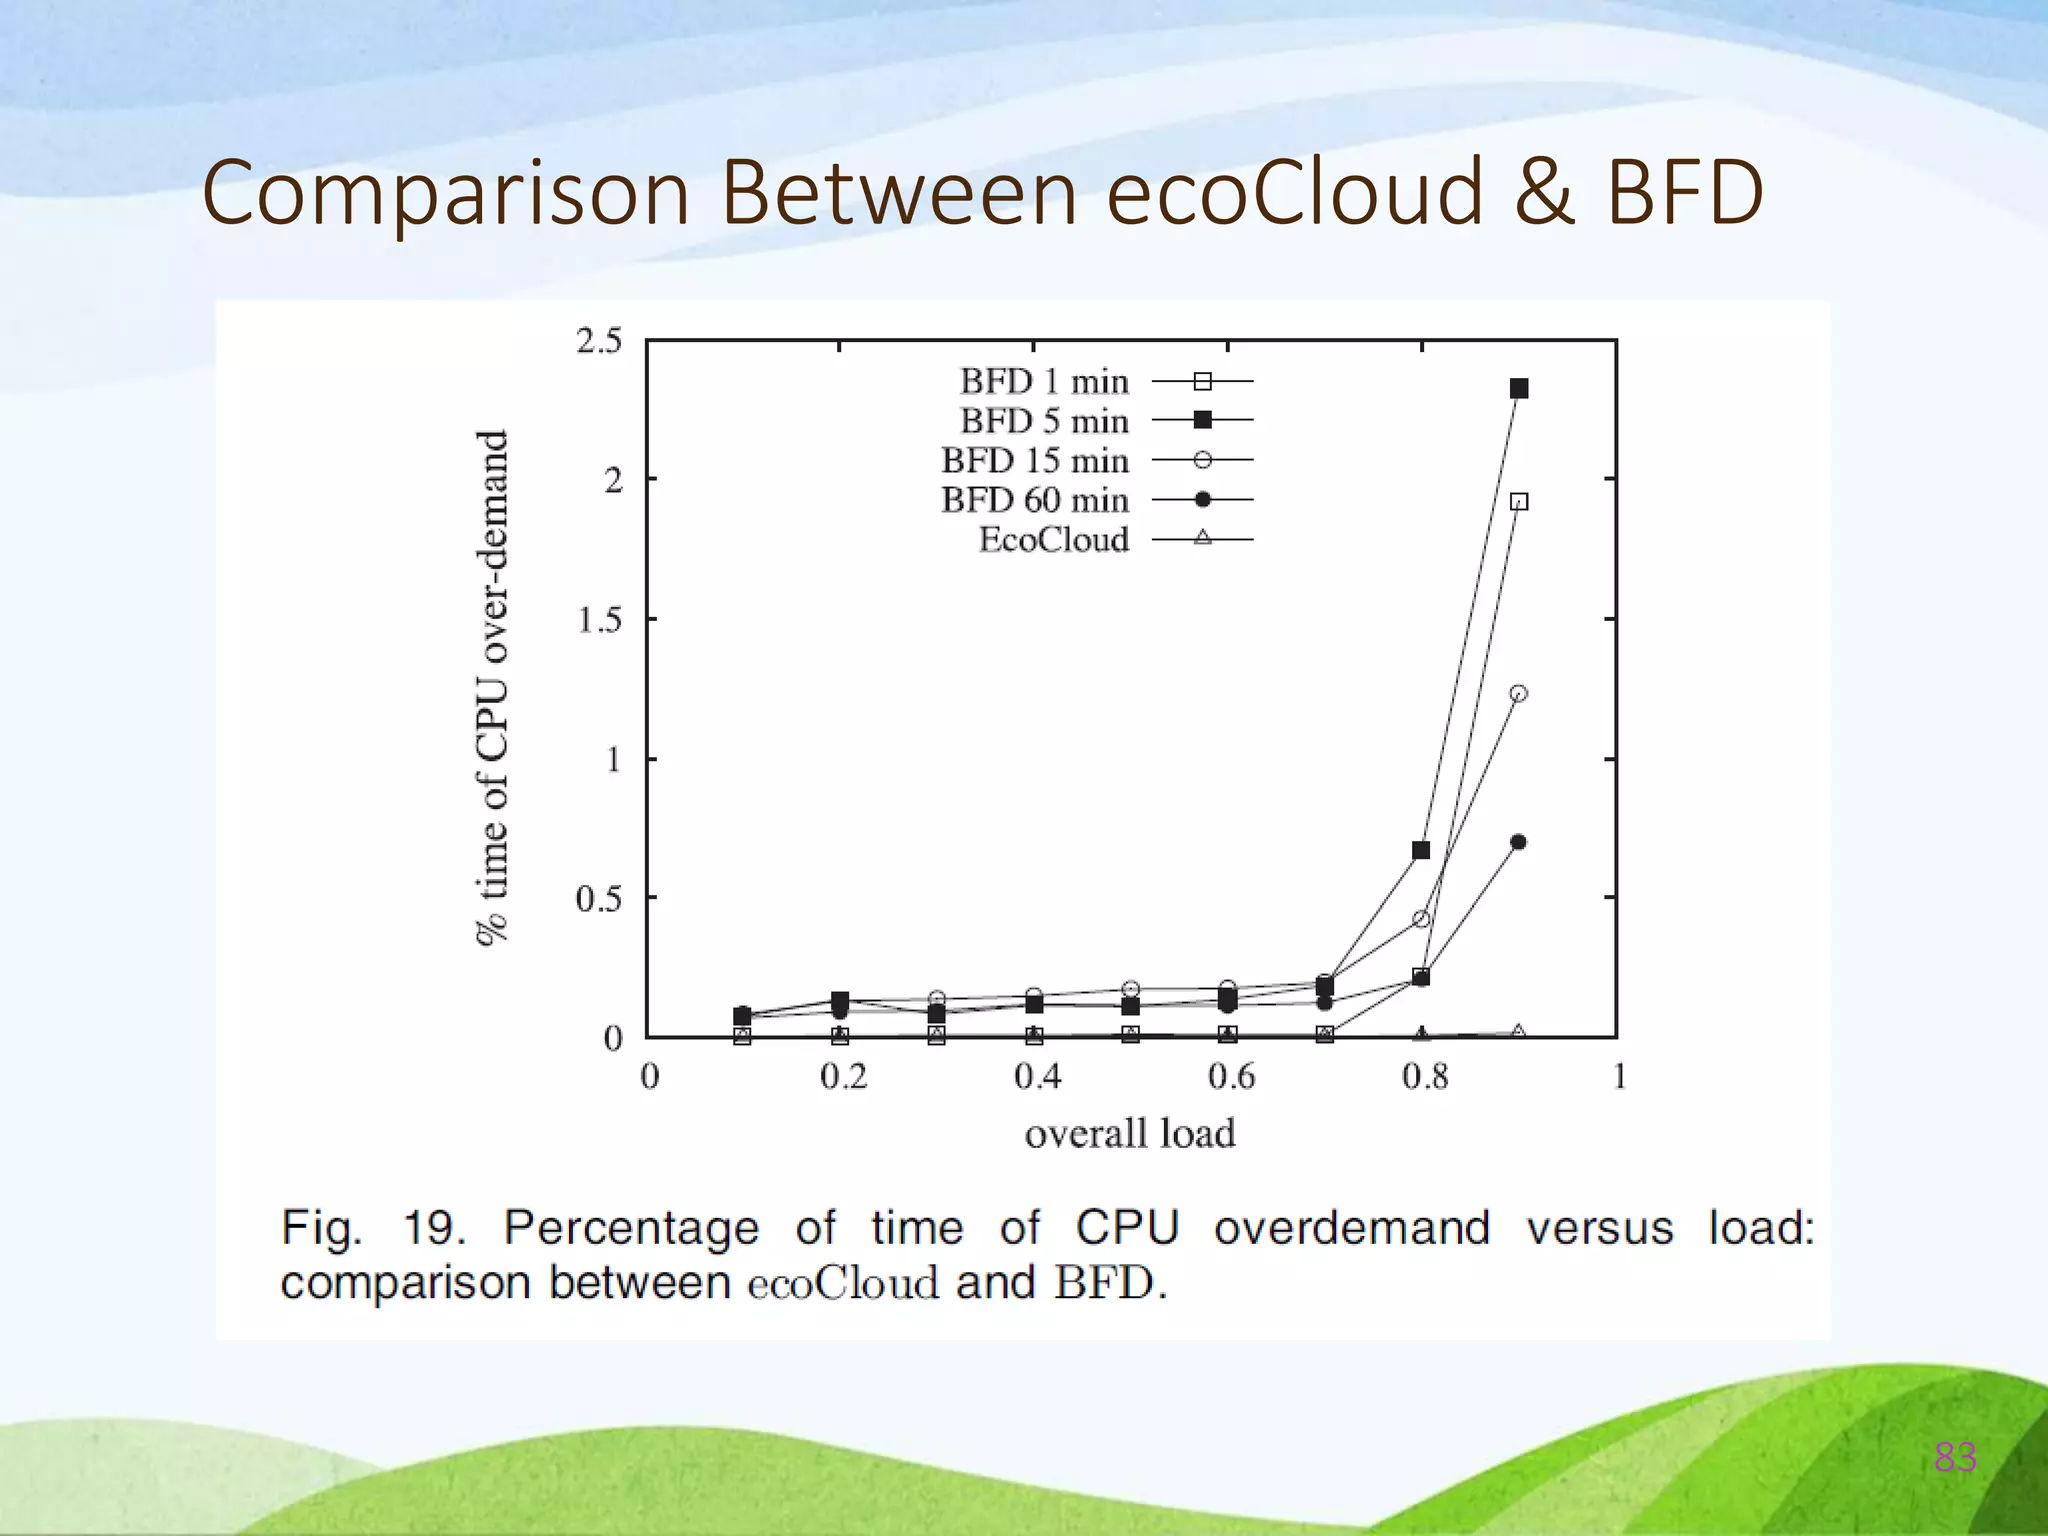
![Comparison Between ecoCloud & BFD
• Implement a variant of the classical Best Fit
Decreasing algorithm described and analyzed in [1]
• It was proved in [18] that BFD algorithm is the
polynomial algorithm that gives the best results in
terms of effectiveness.
73](https://image.slidesharecdn.com/probabilisticconsolidationofvirtualmachinesinself-organizingclouddatacenters-140527042316-phpapp02/75/Probabilistic-consolidation-of-virtual-machines-in-self-organizing-cloud-data-centers-73-2048.jpg)


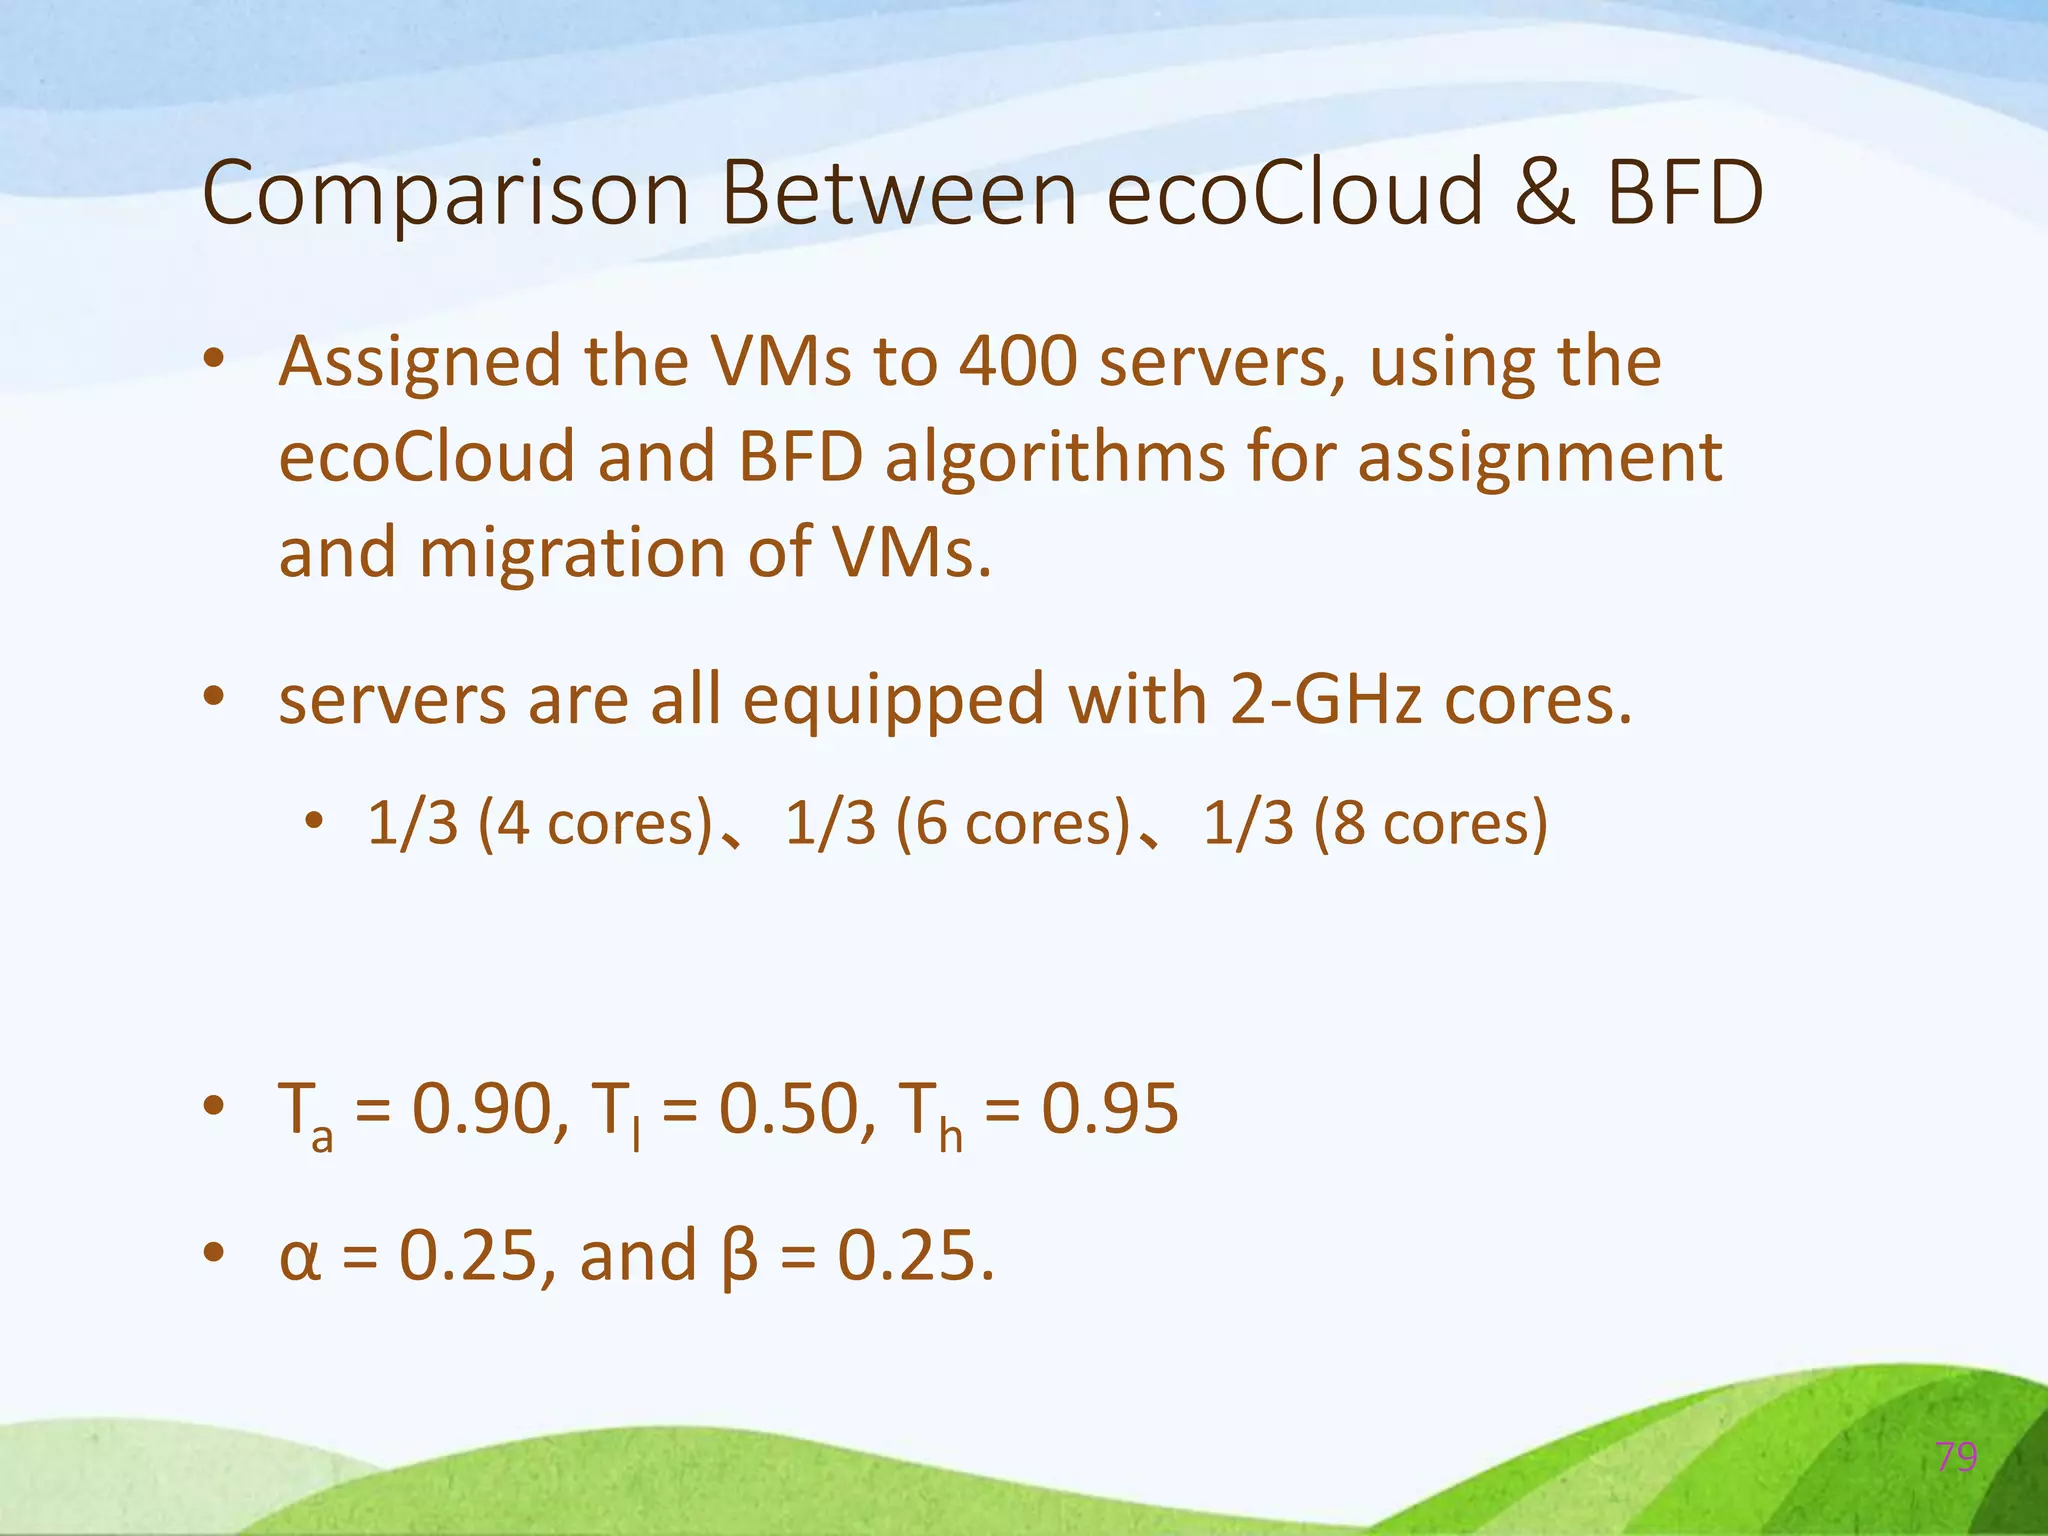
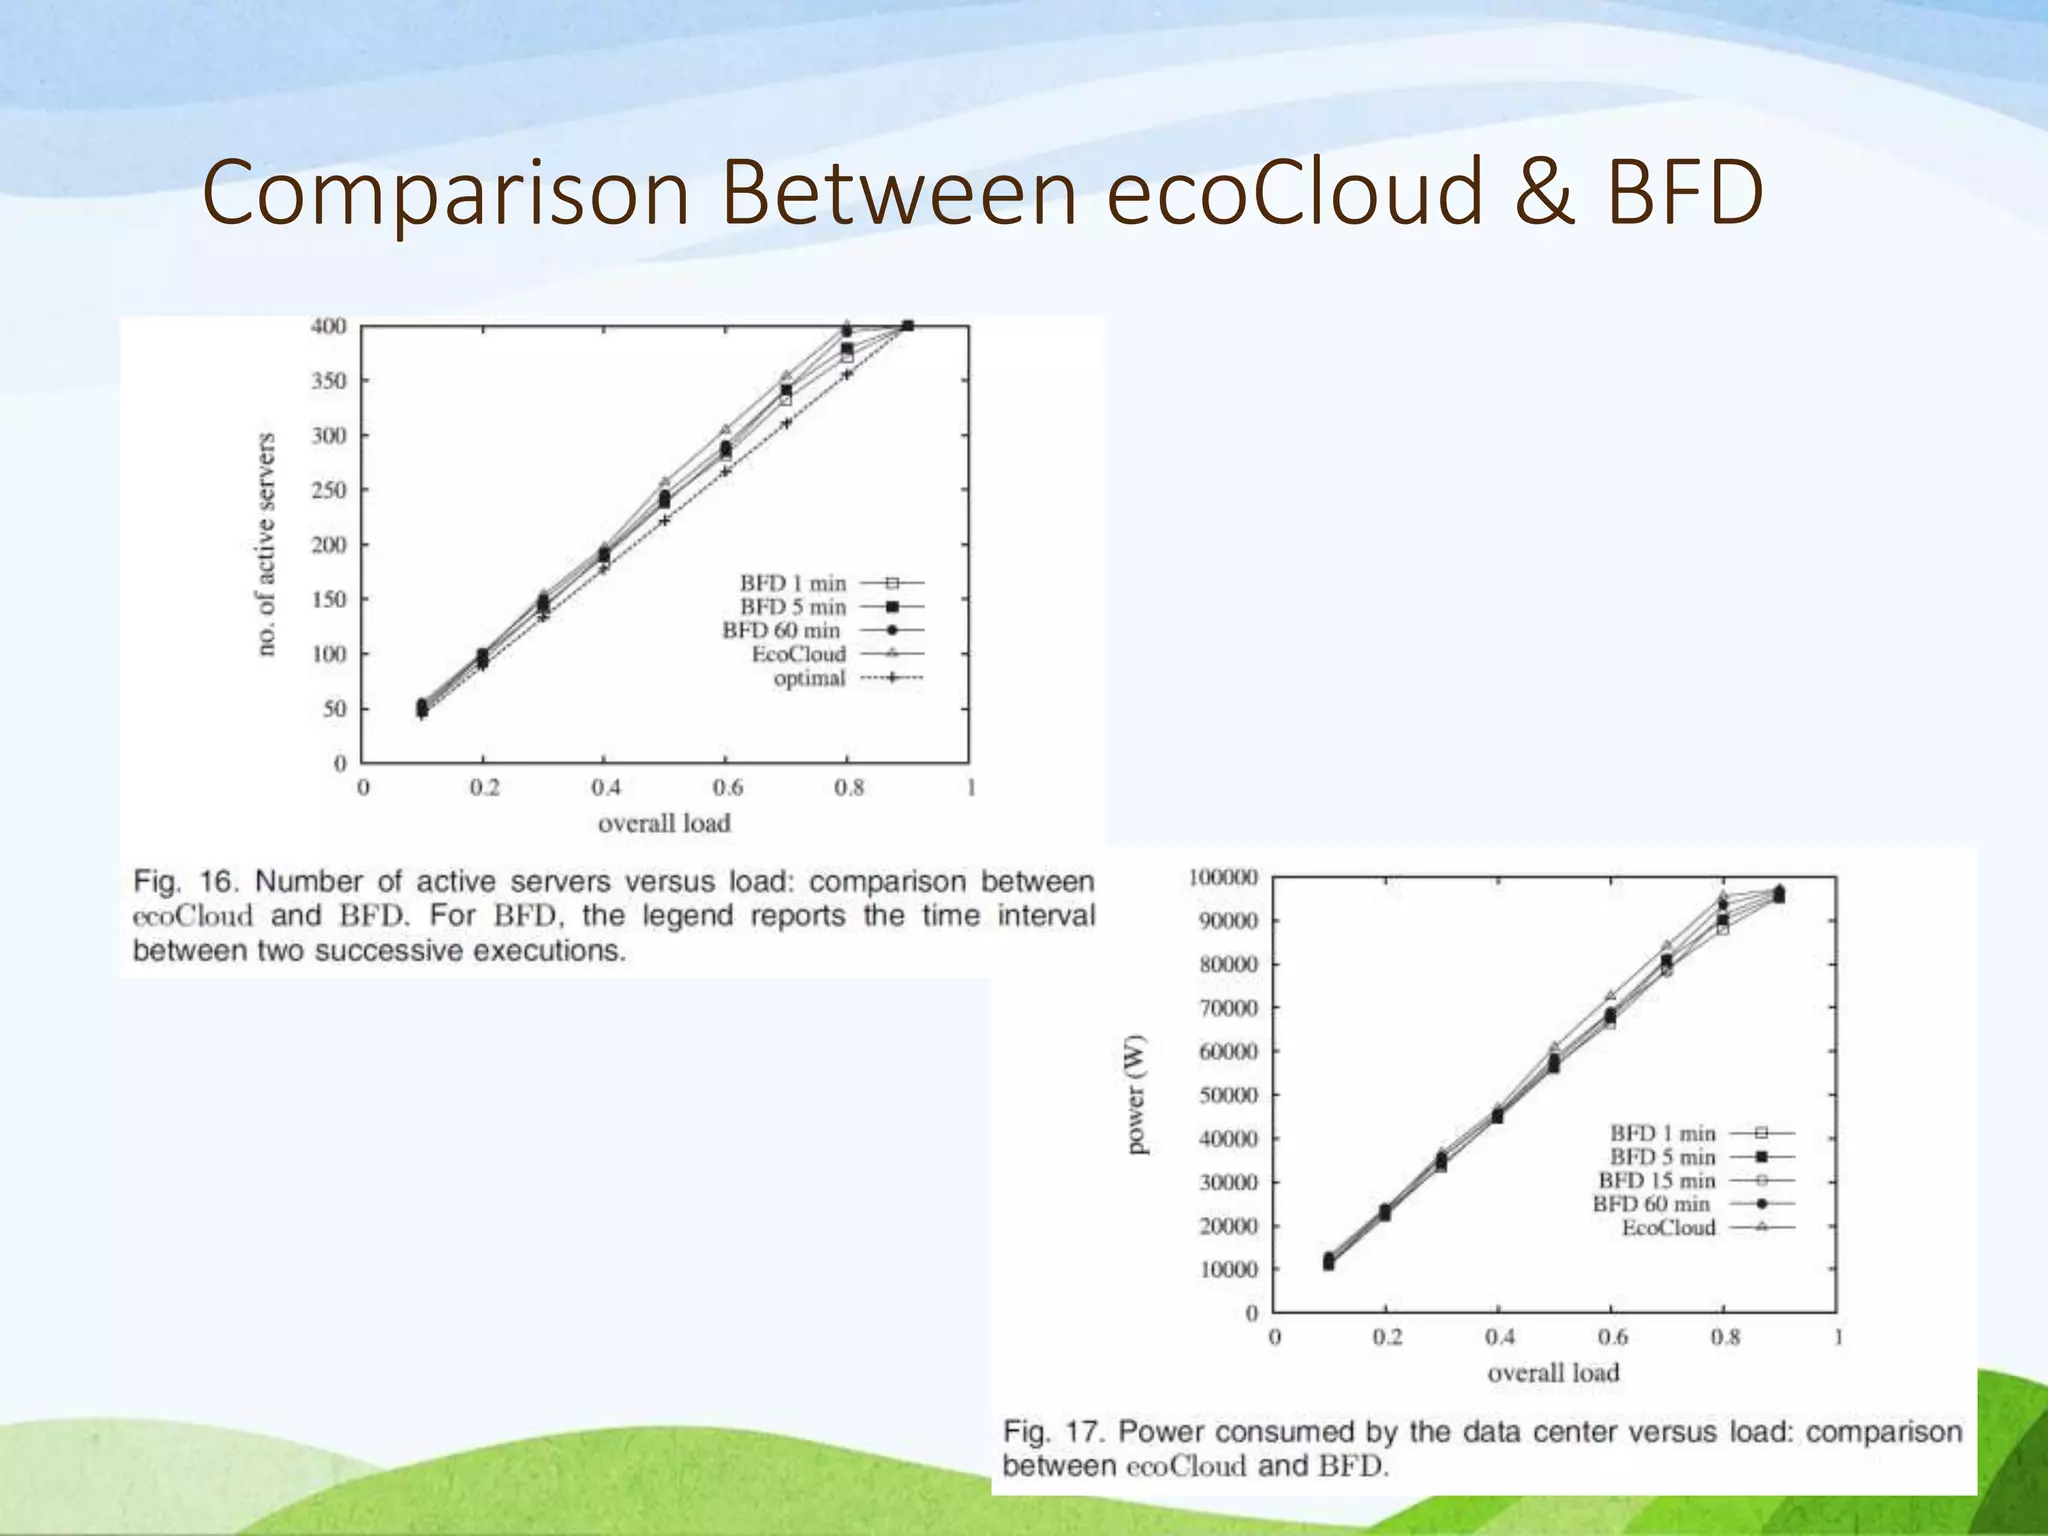
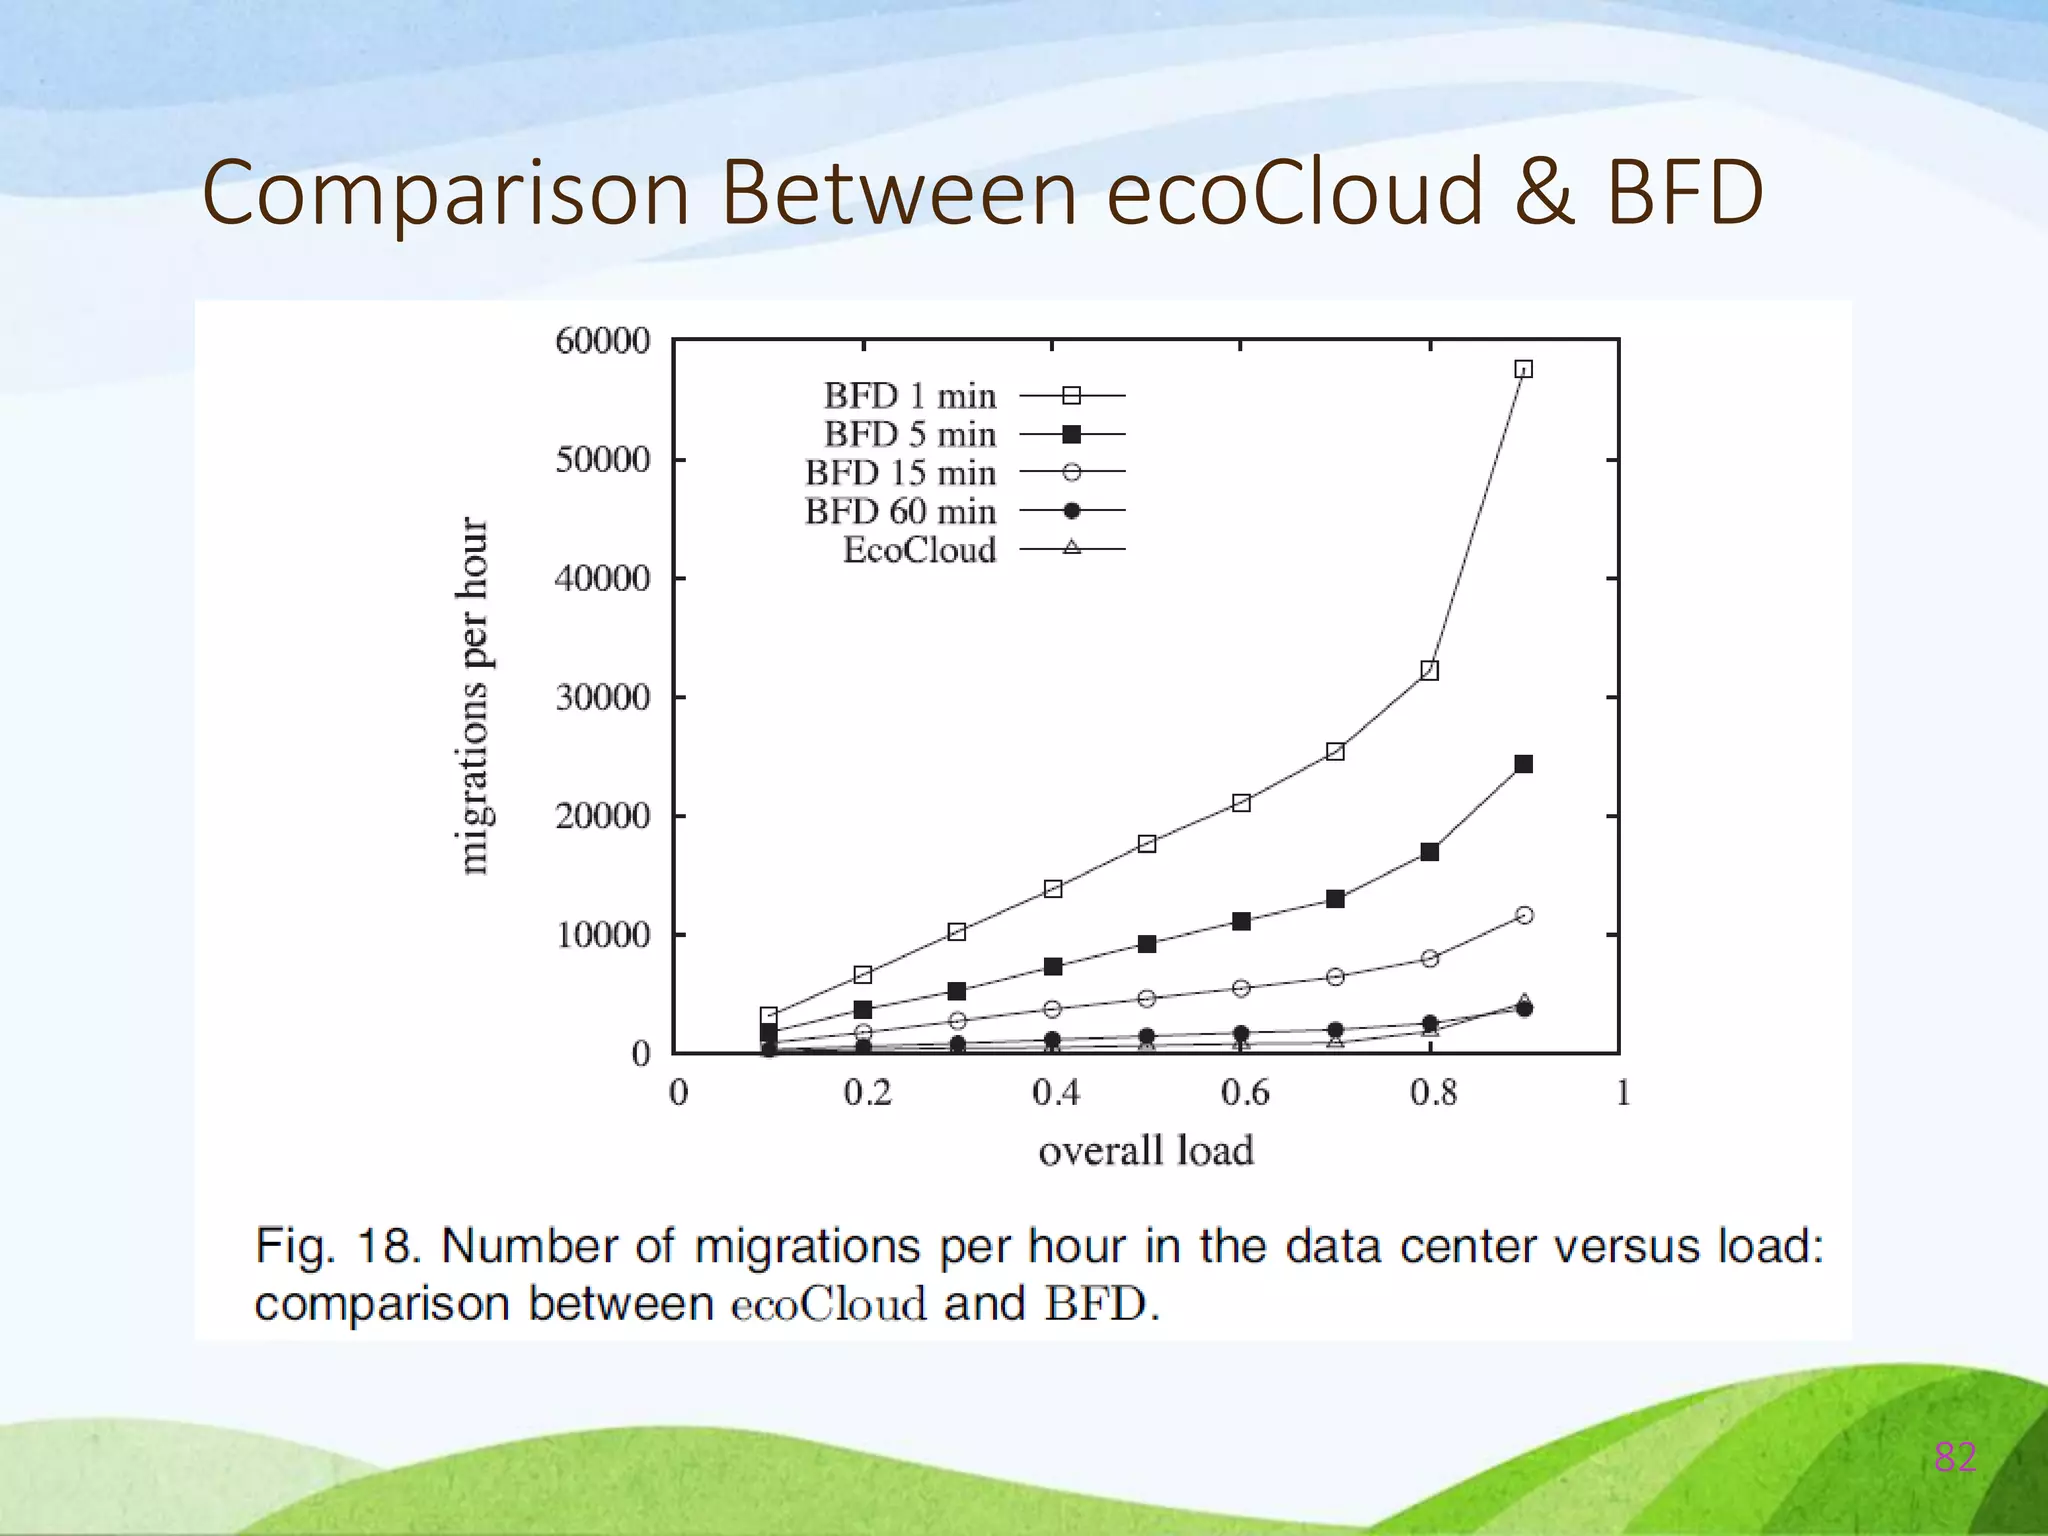
![Comparison Between ecoCloud & BFD
• The traces represent the CPU utilization of 6,000
VMs, monitored in March/April 2012 and
updated every 5 minutes.
• Since the CPU is the only resource considered in
[1], we also consider this resource only for the
experiments reported below.
78](https://image.slidesharecdn.com/probabilisticconsolidationofvirtualmachinesinself-organizingclouddatacenters-140527042316-phpapp02/75/Probabilistic-consolidation-of-virtual-machines-in-self-organizing-cloud-data-centers-78-2048.jpg)


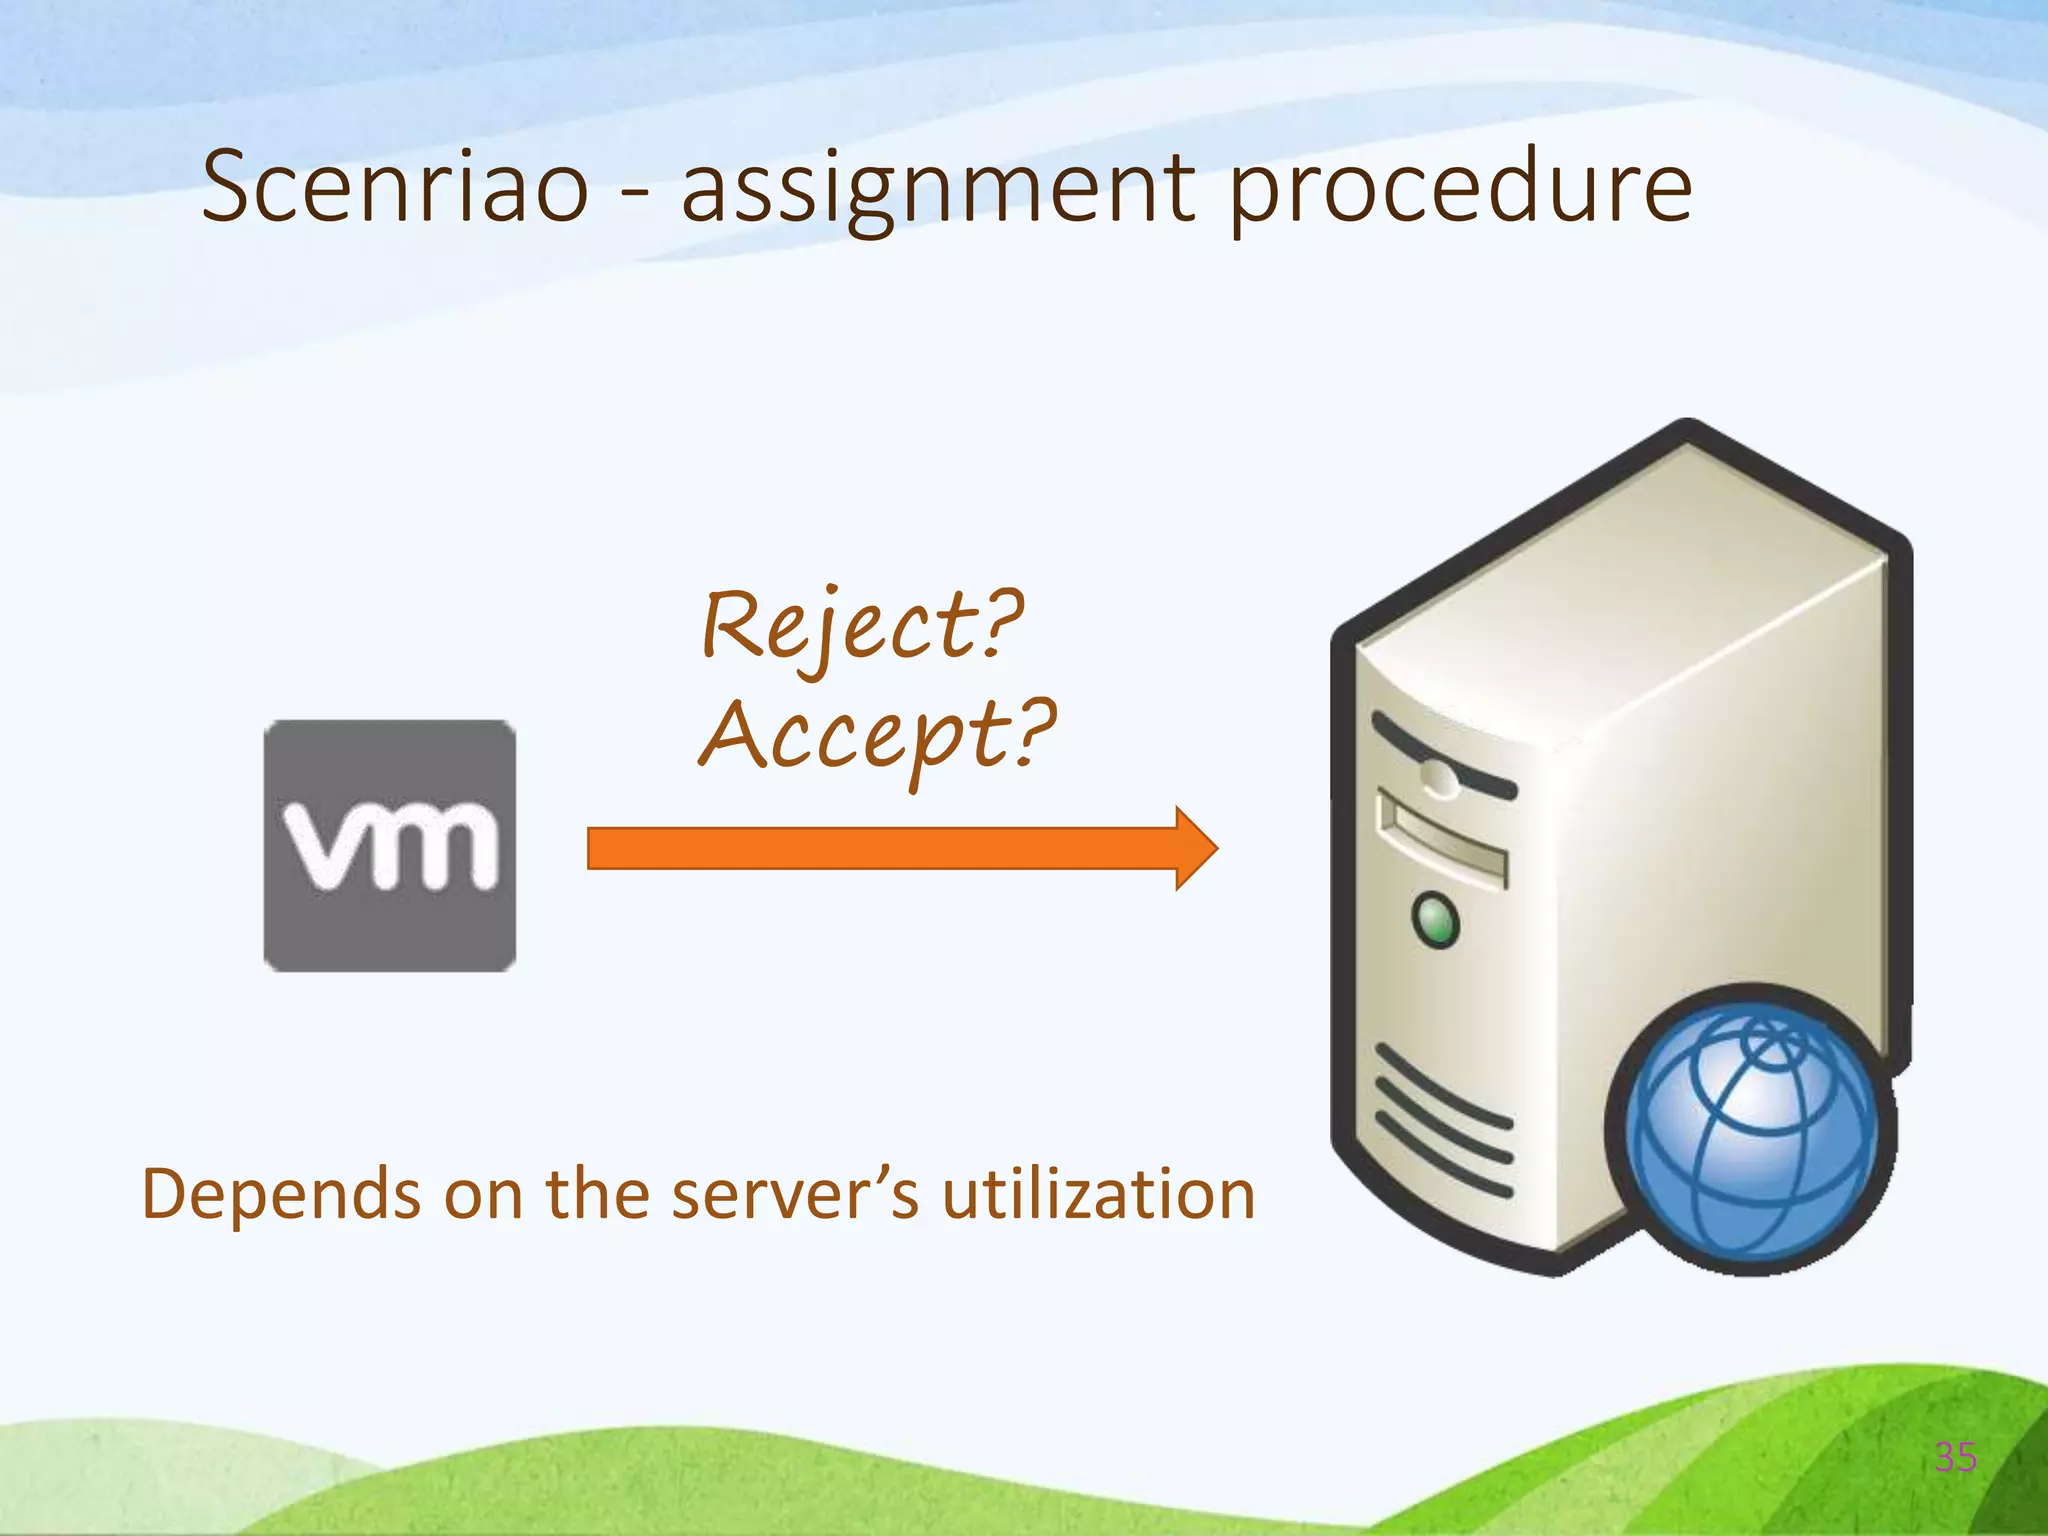
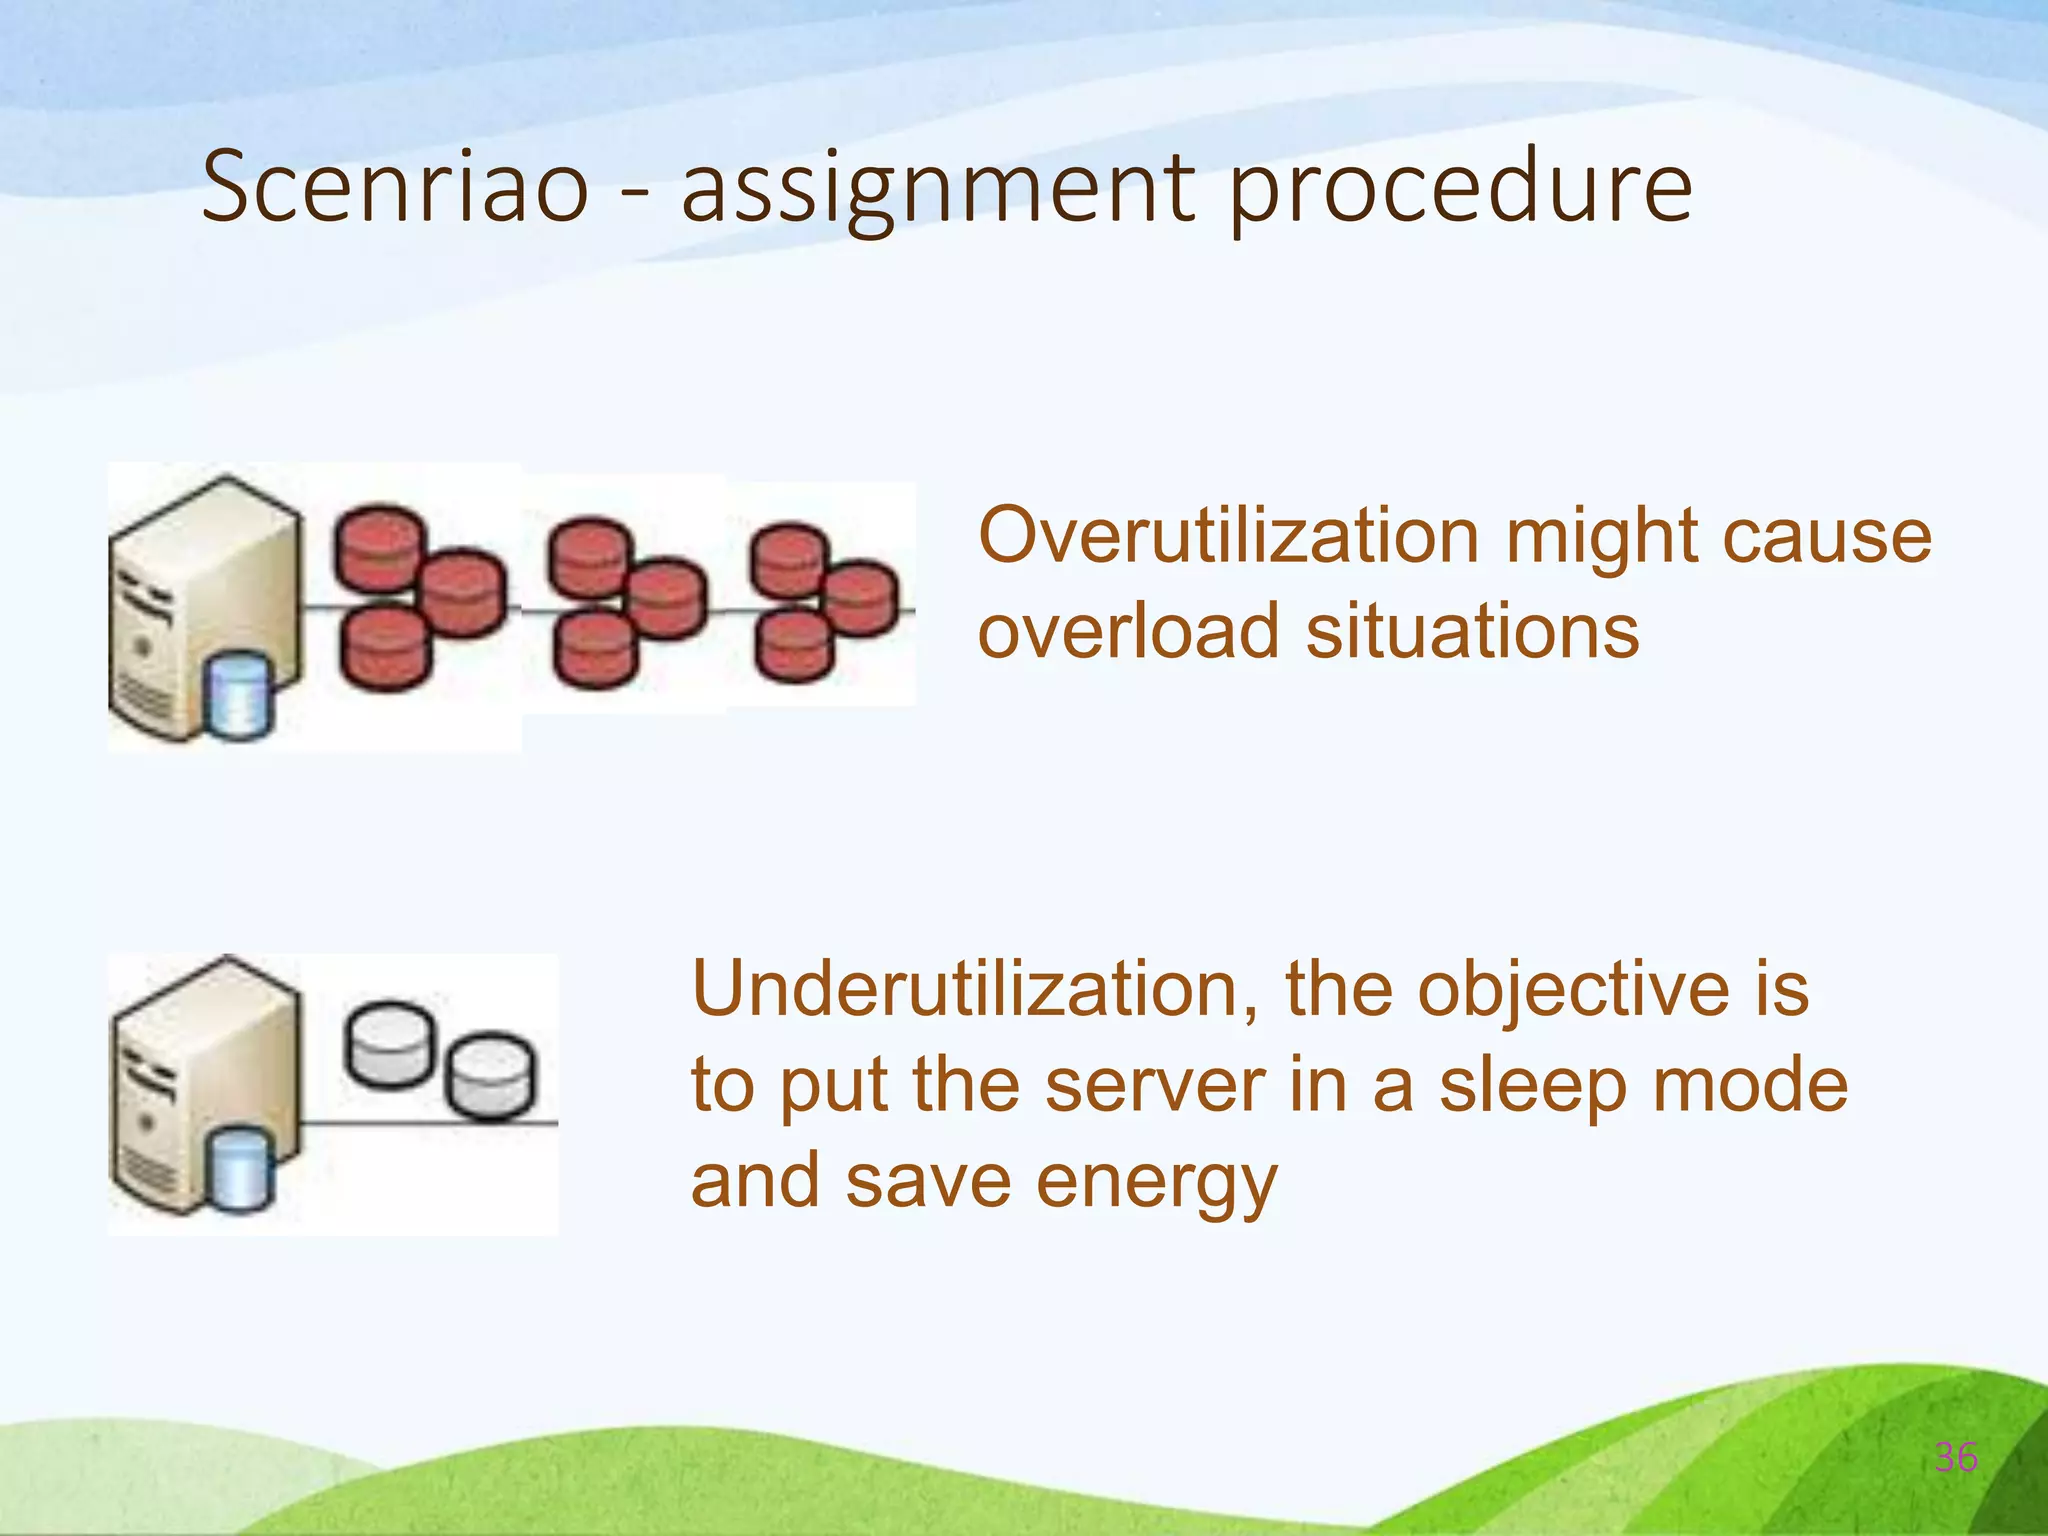
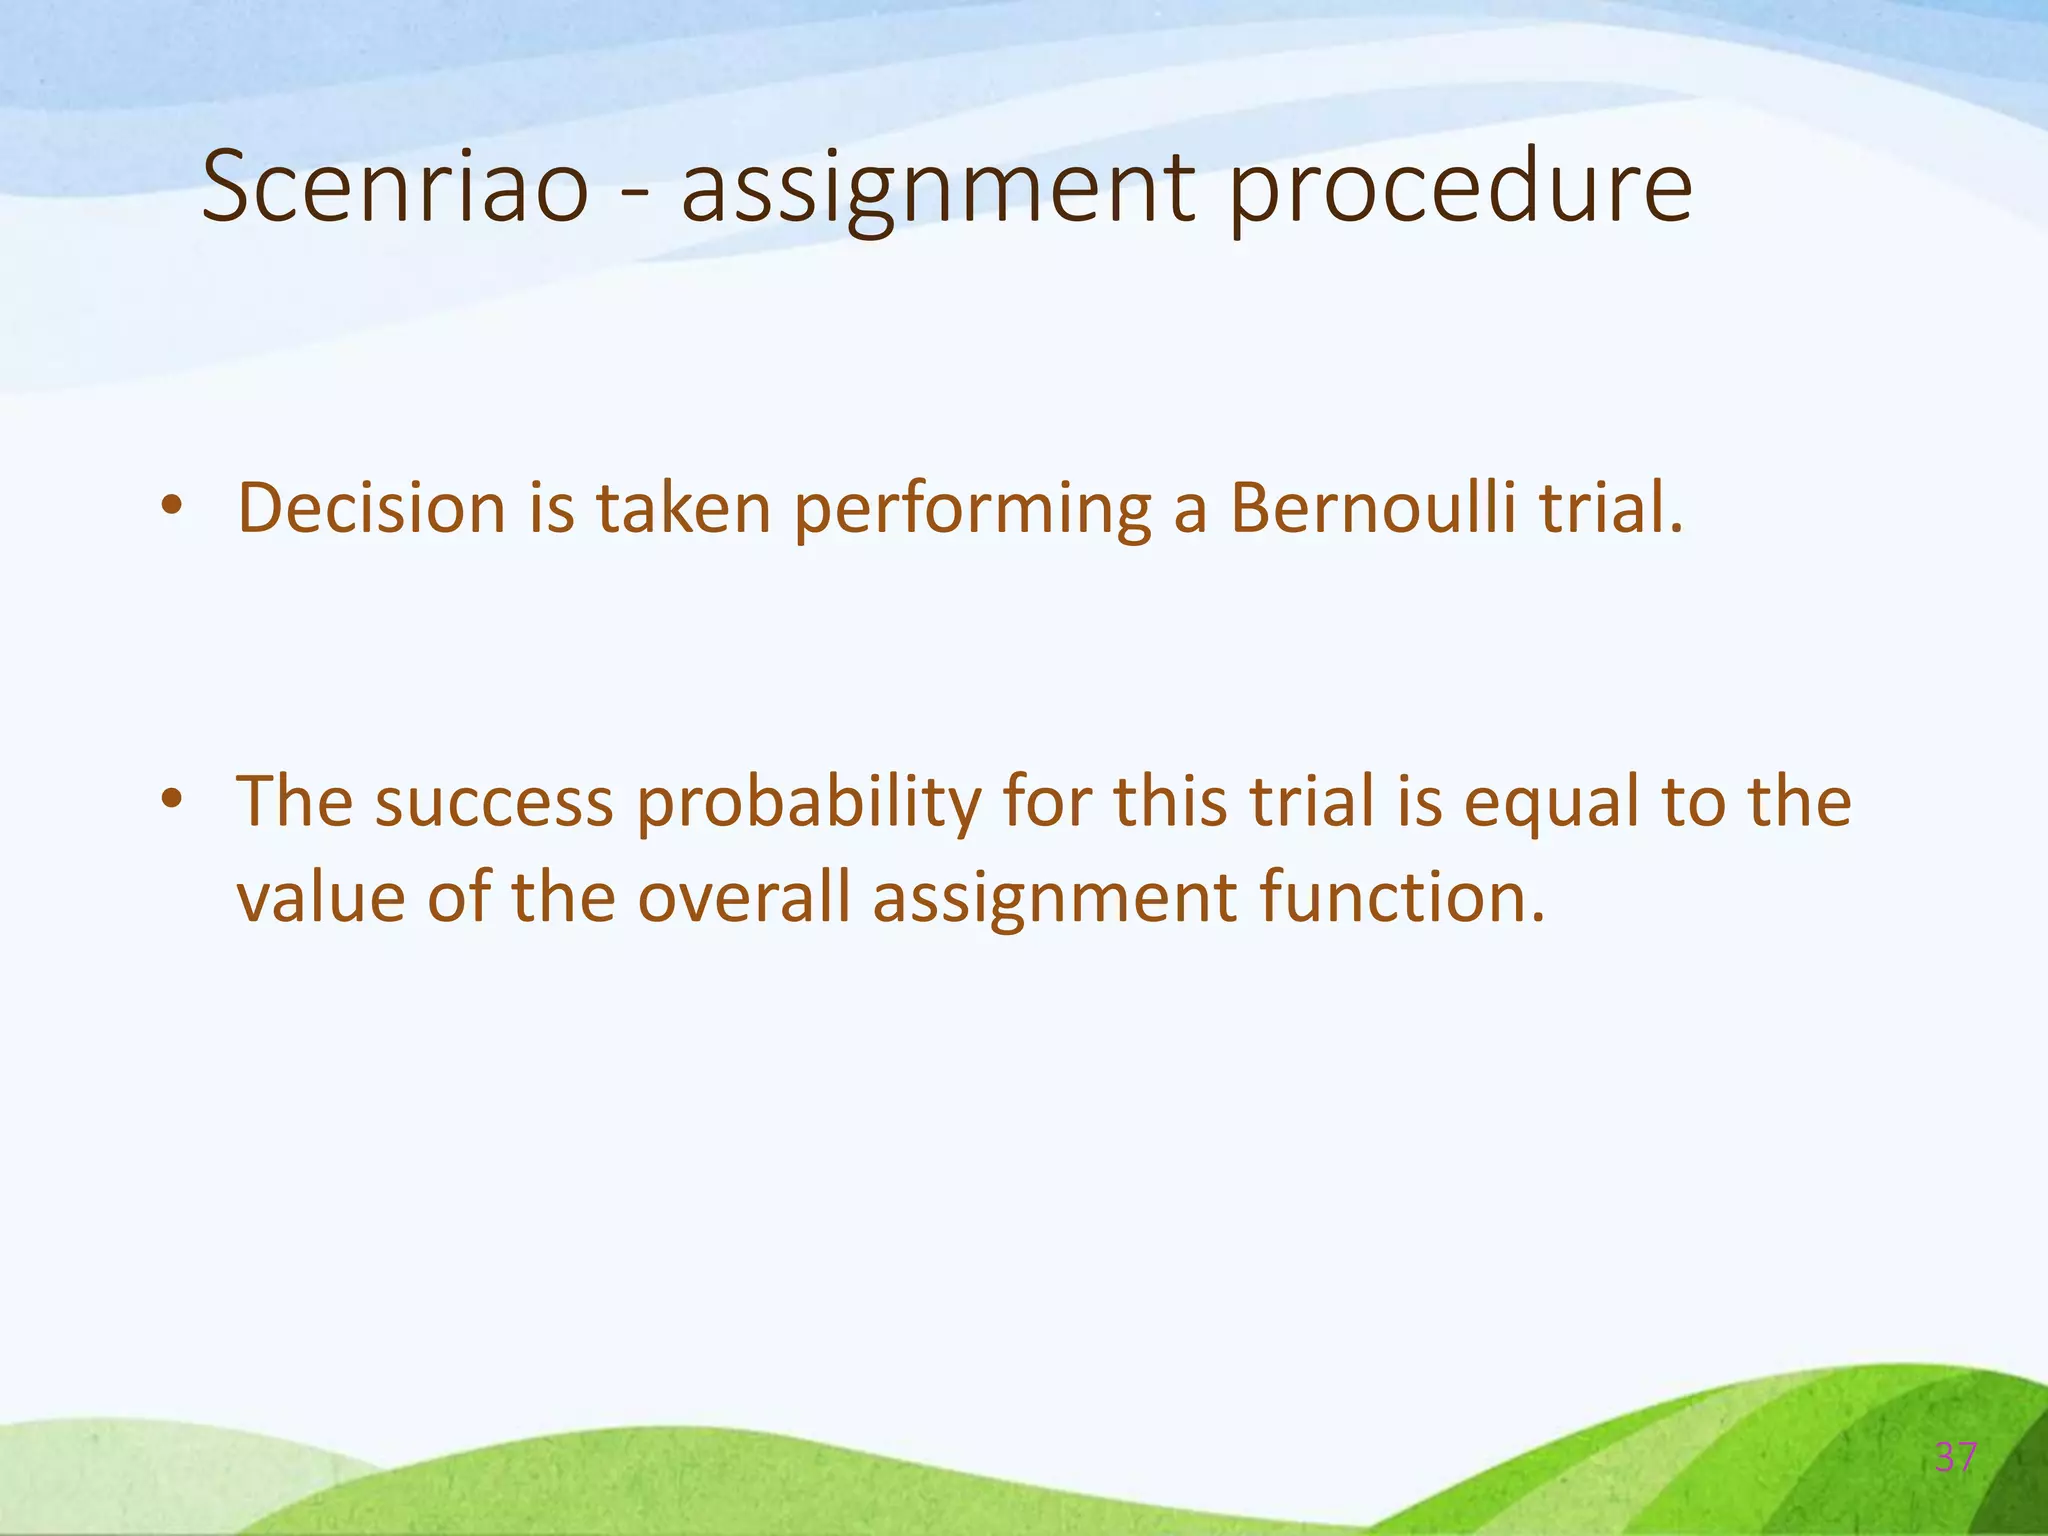
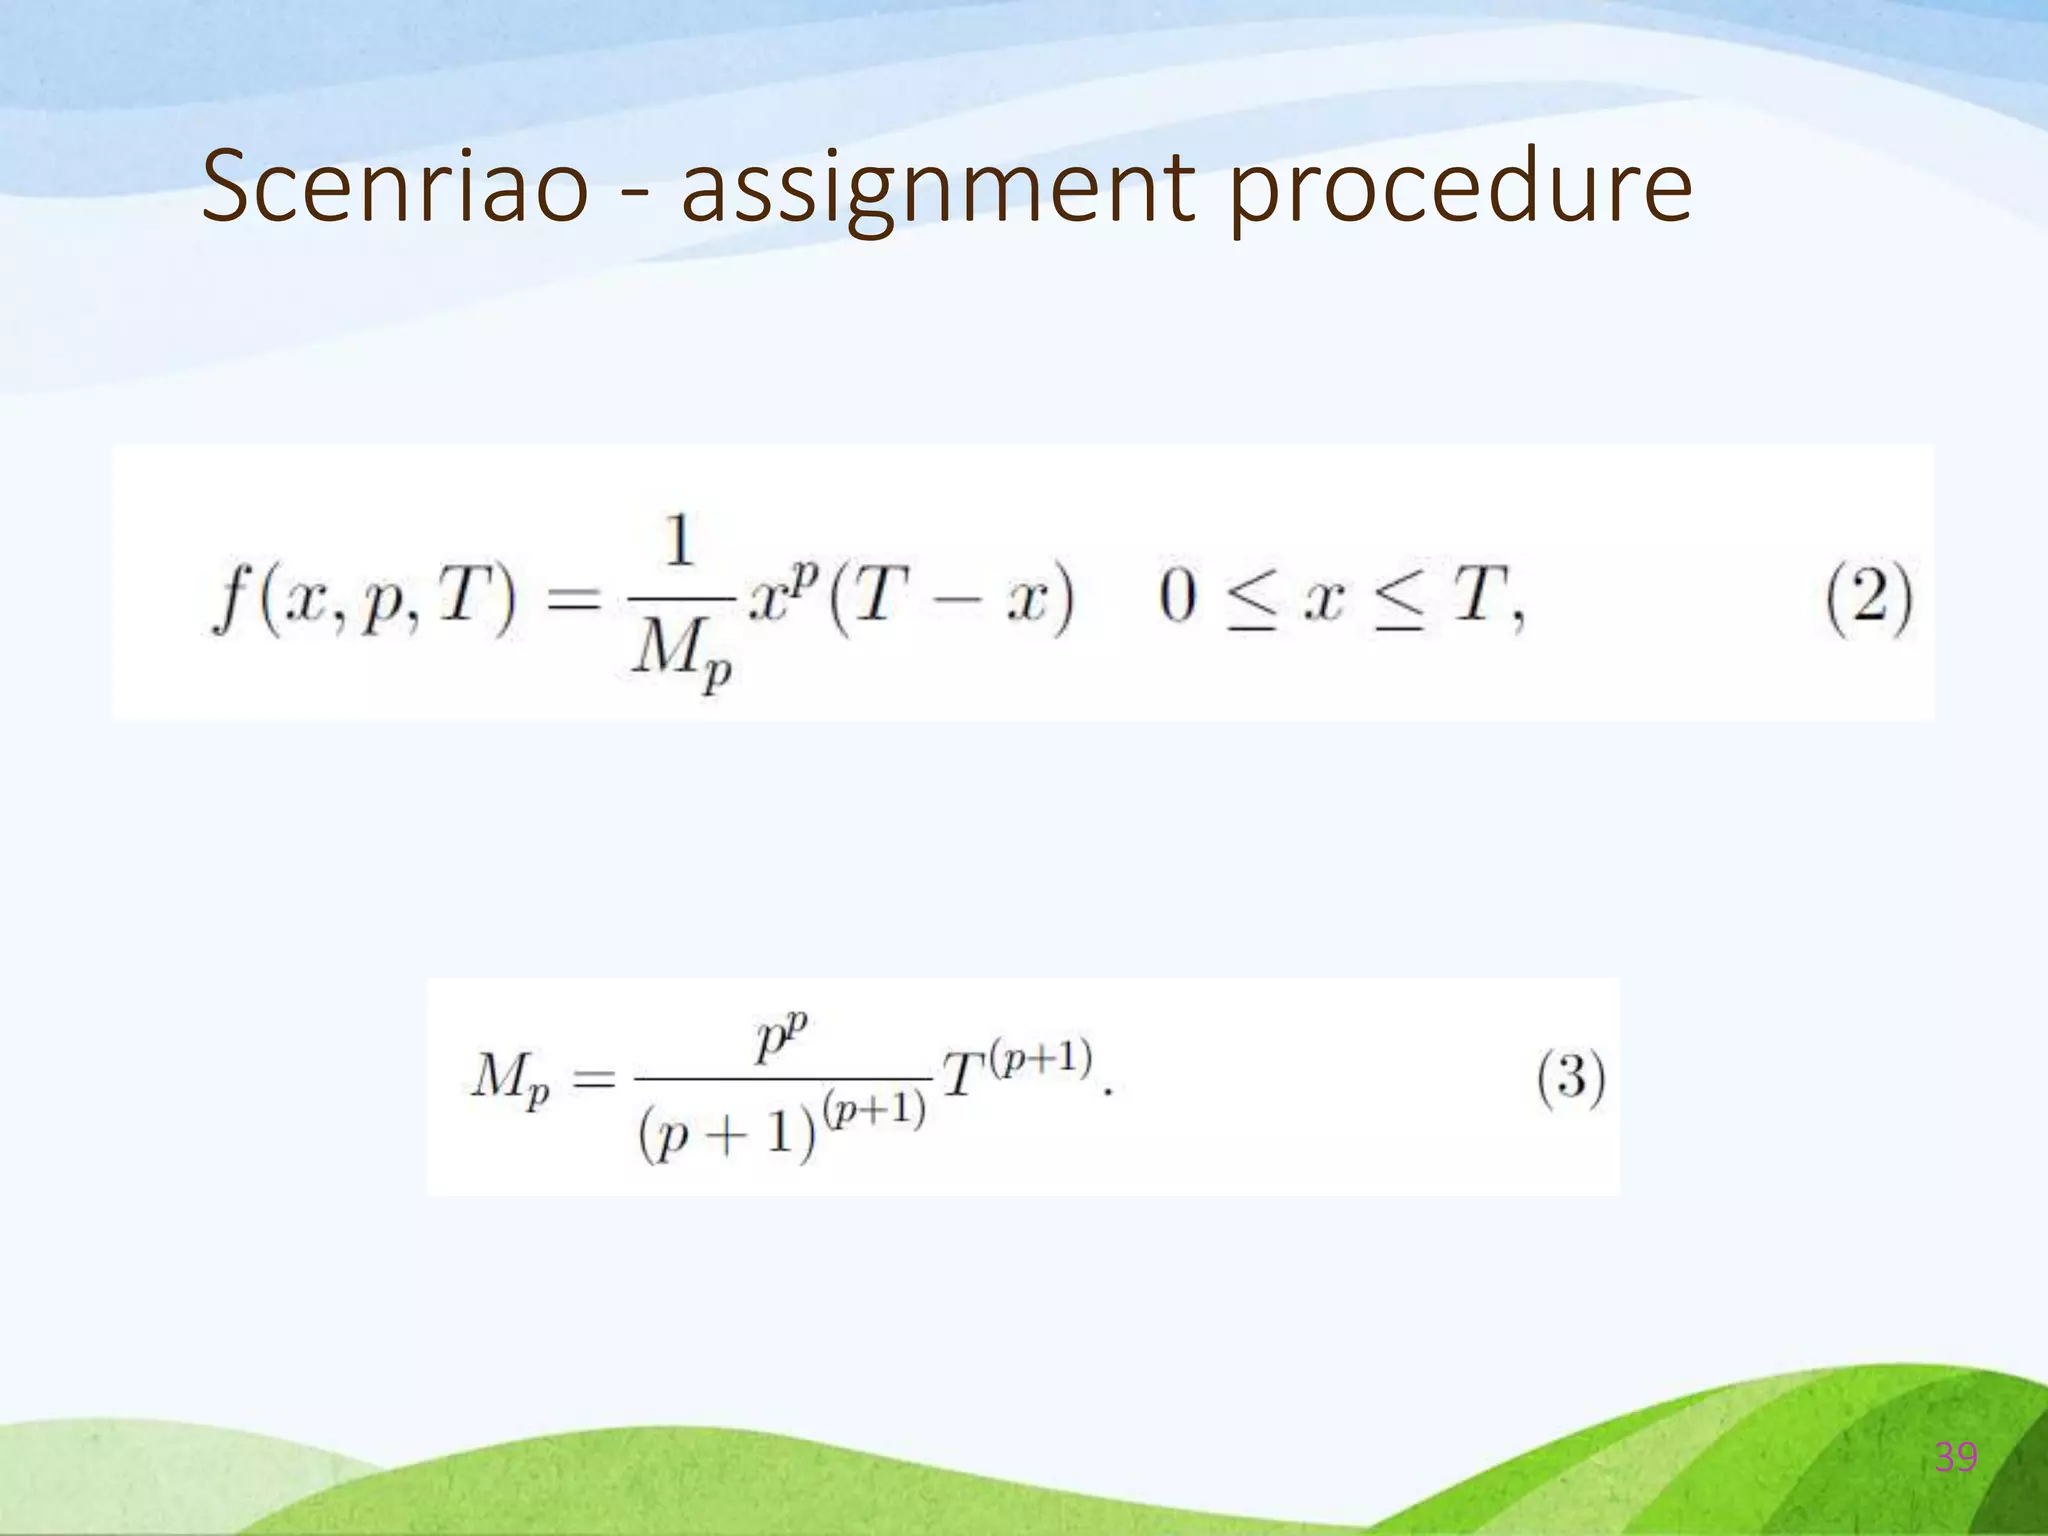
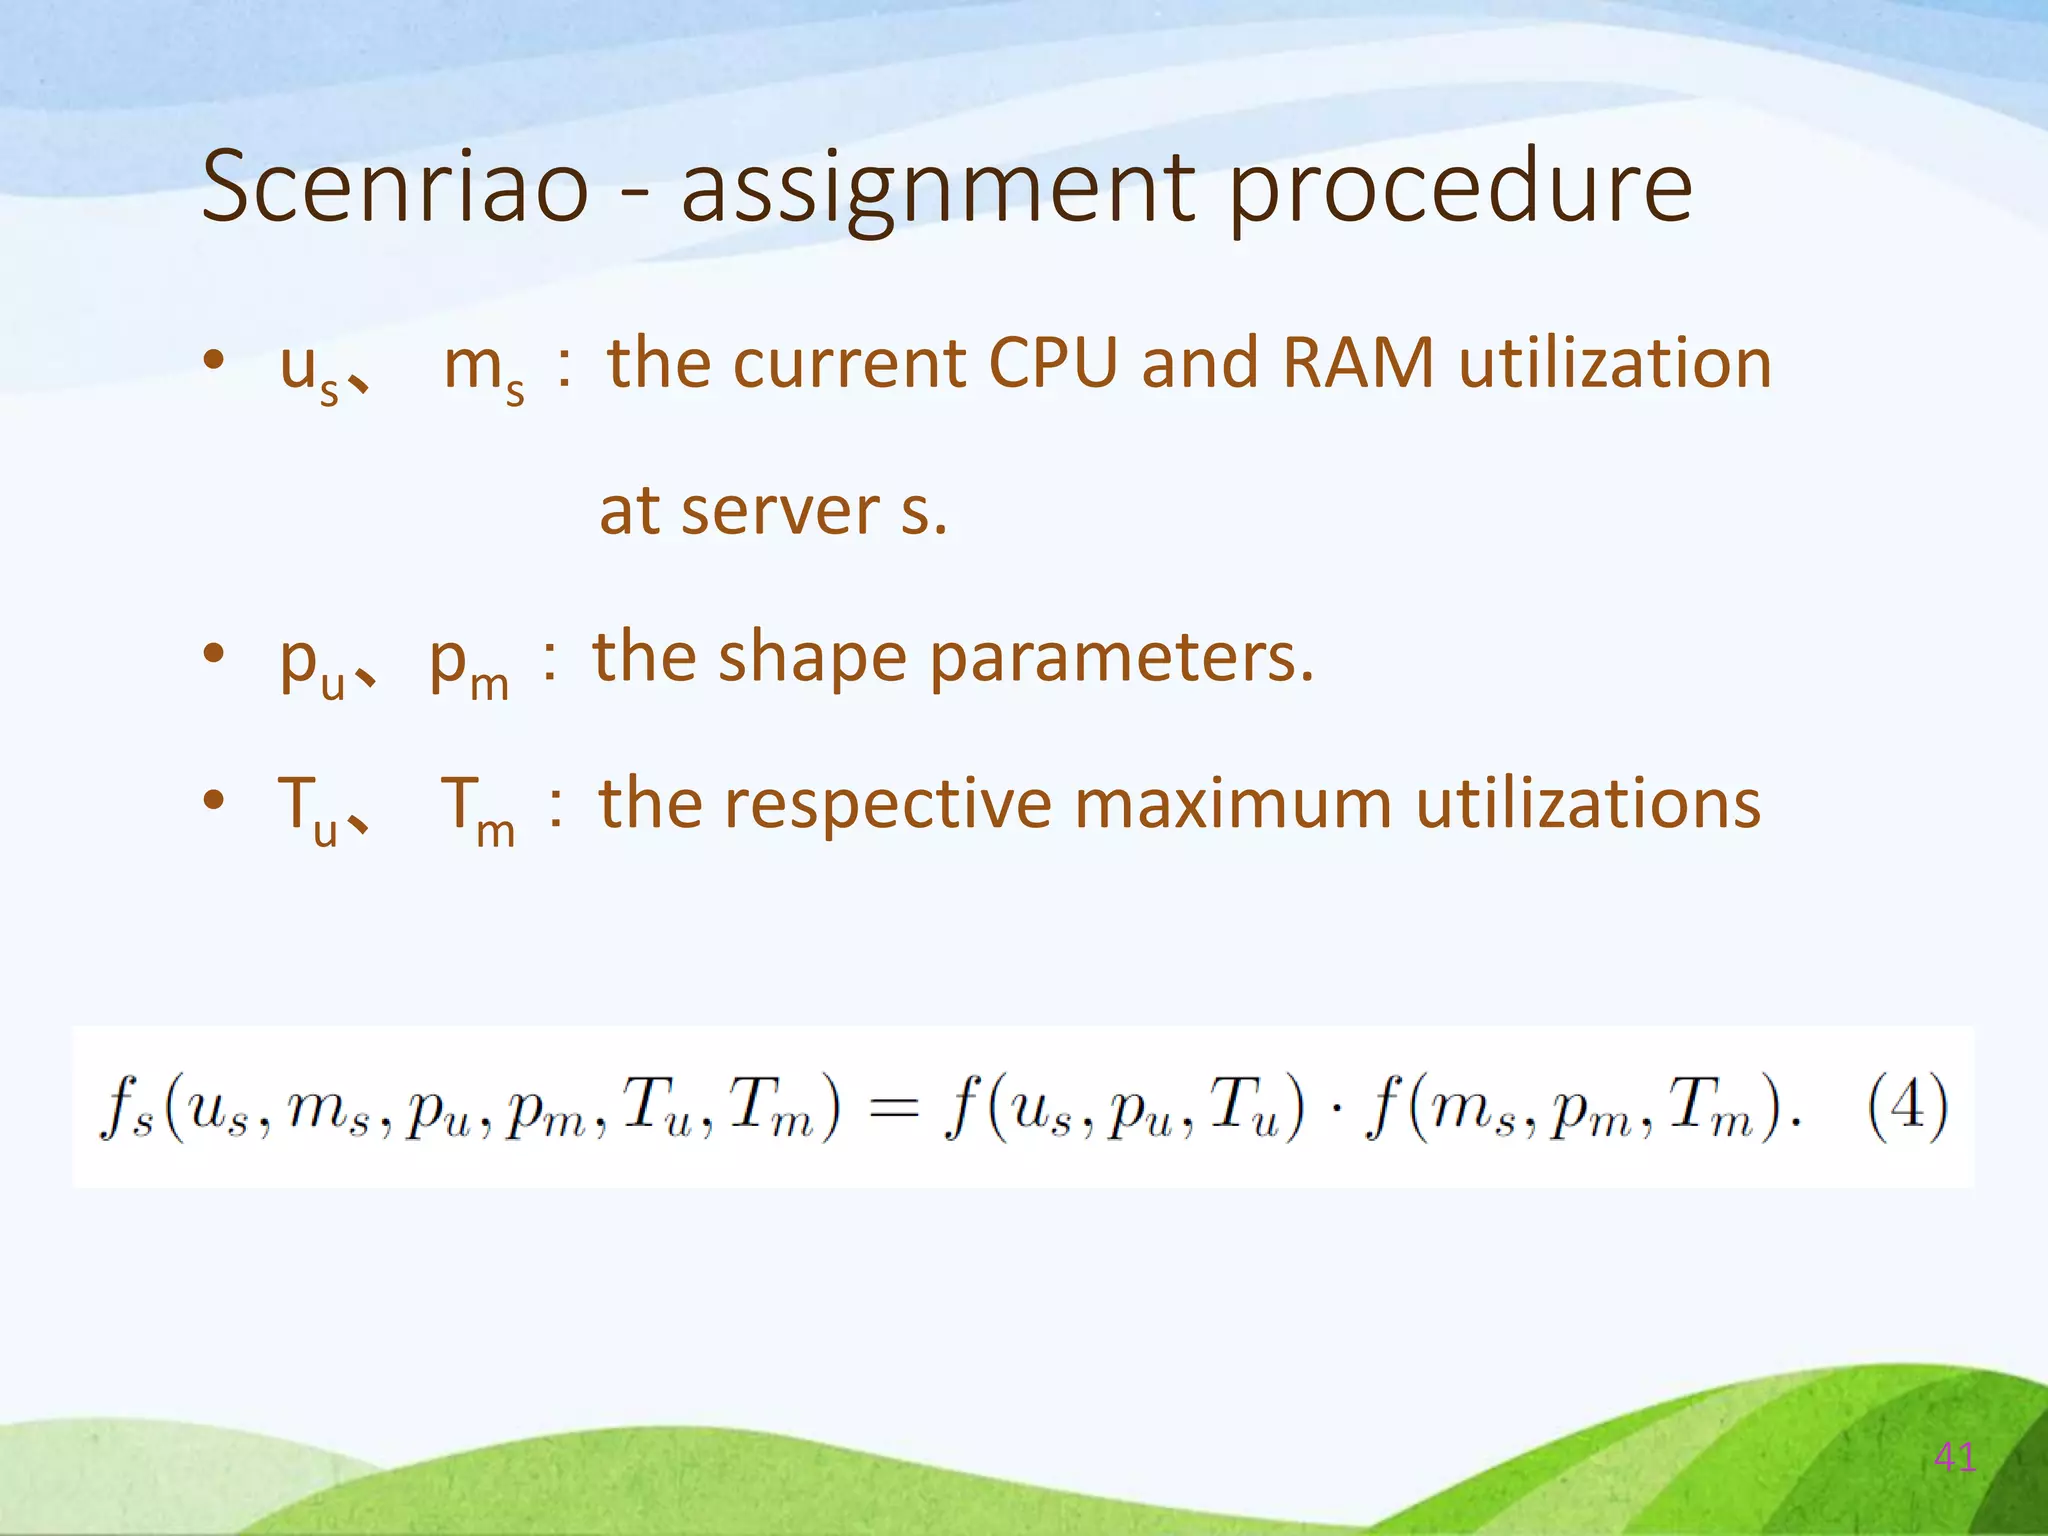
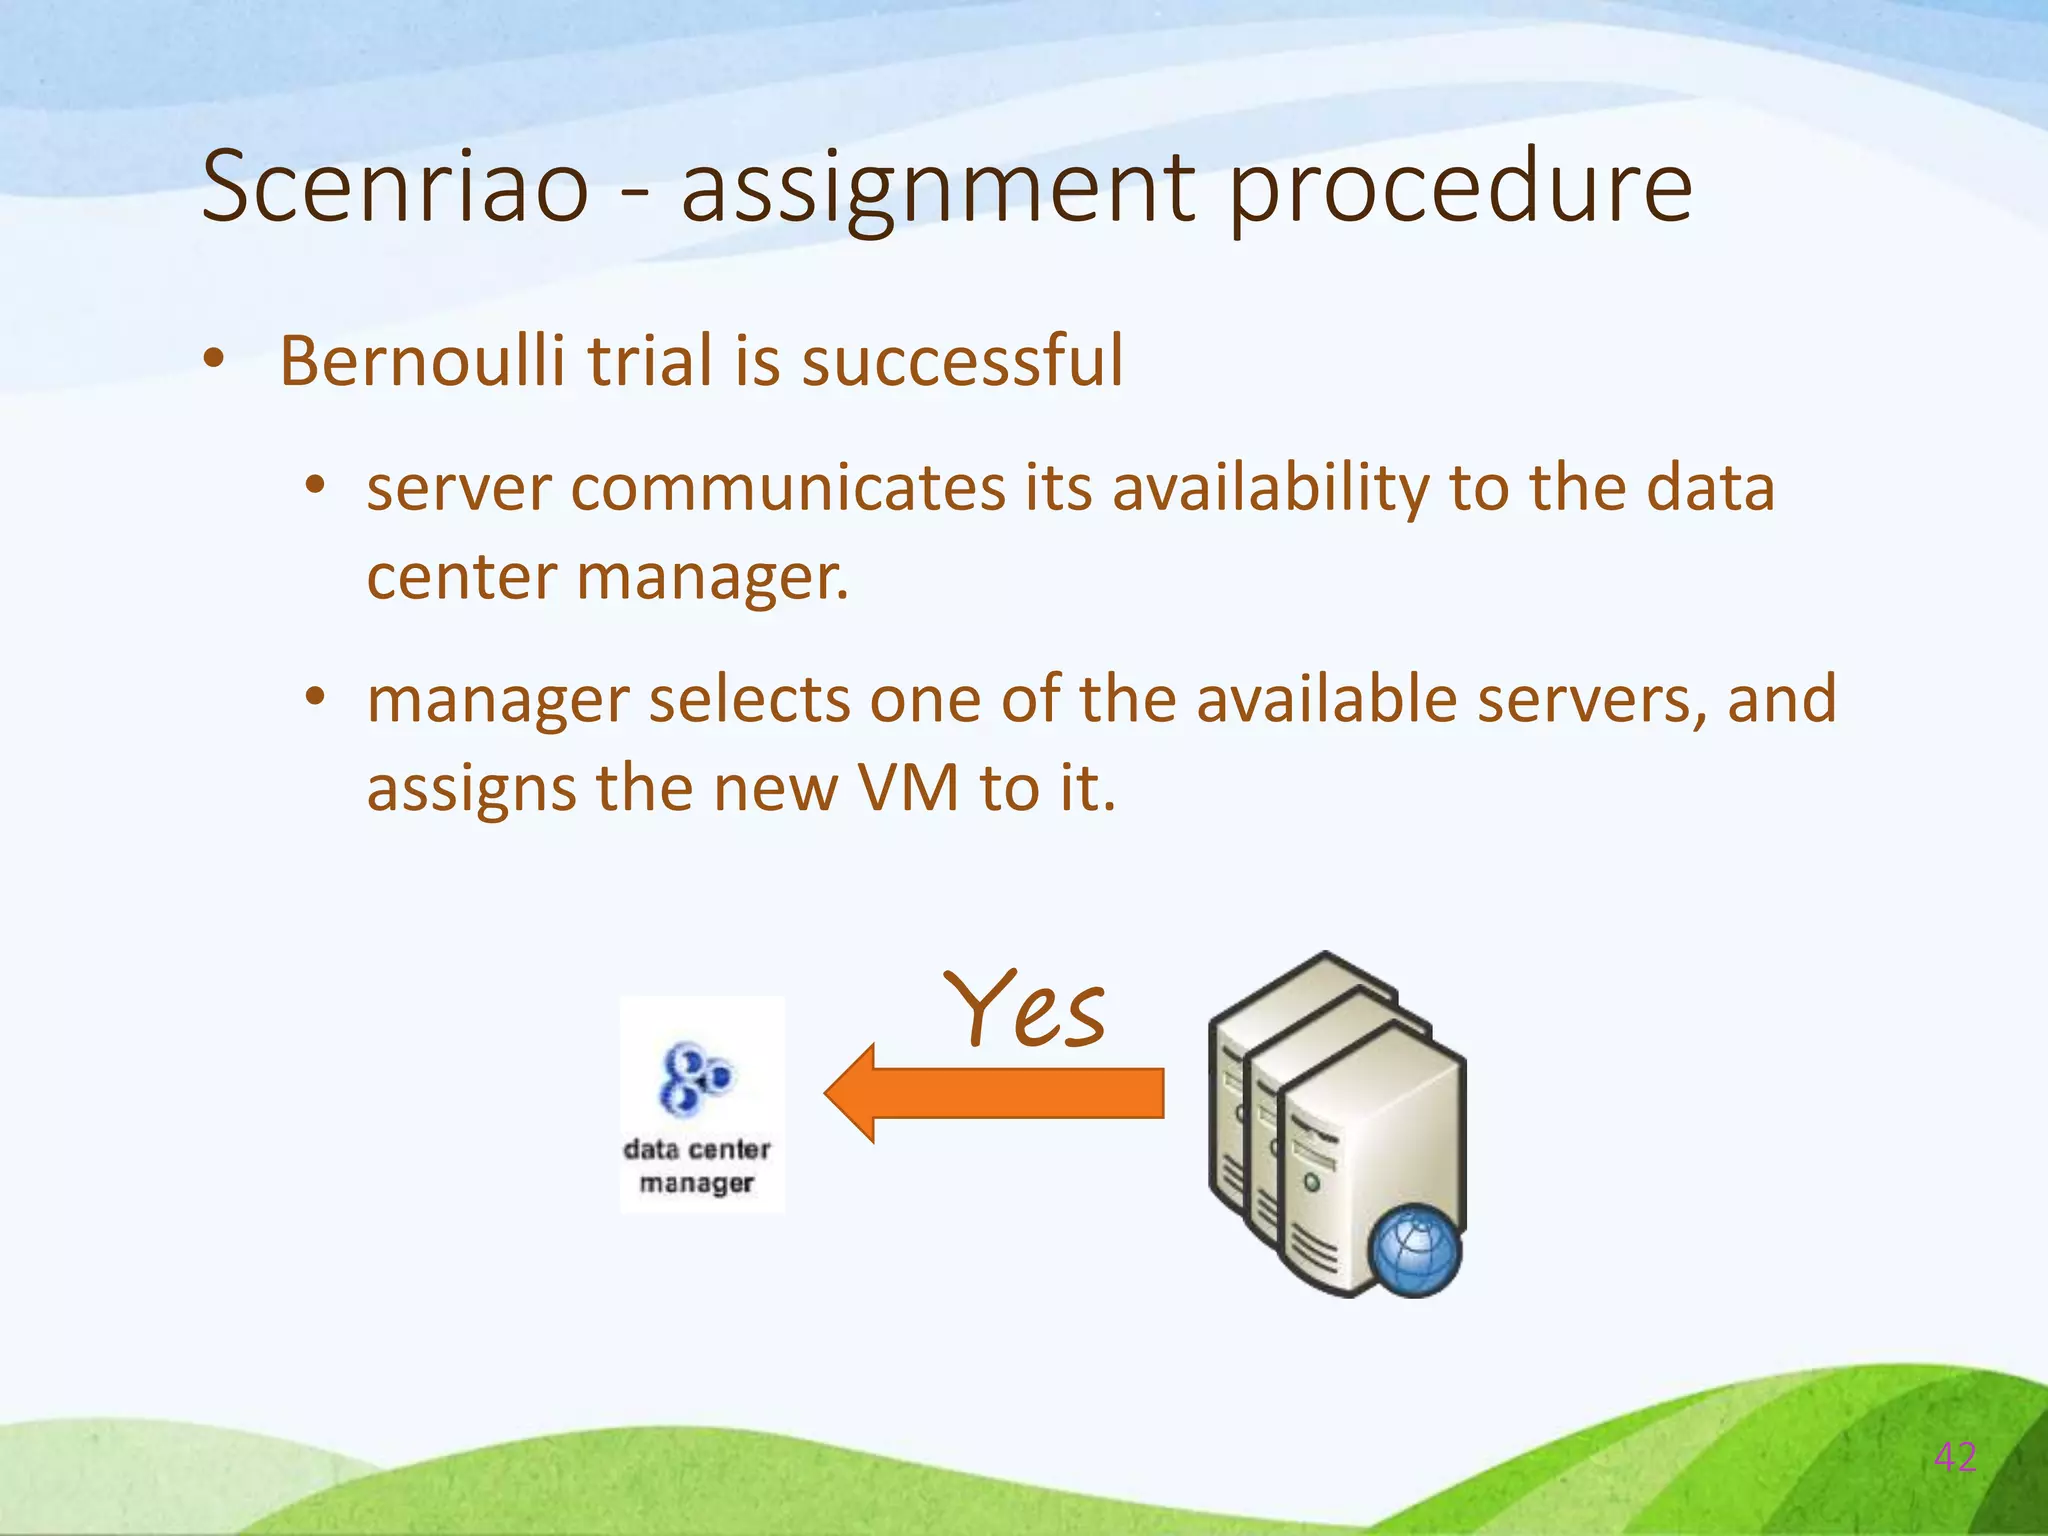
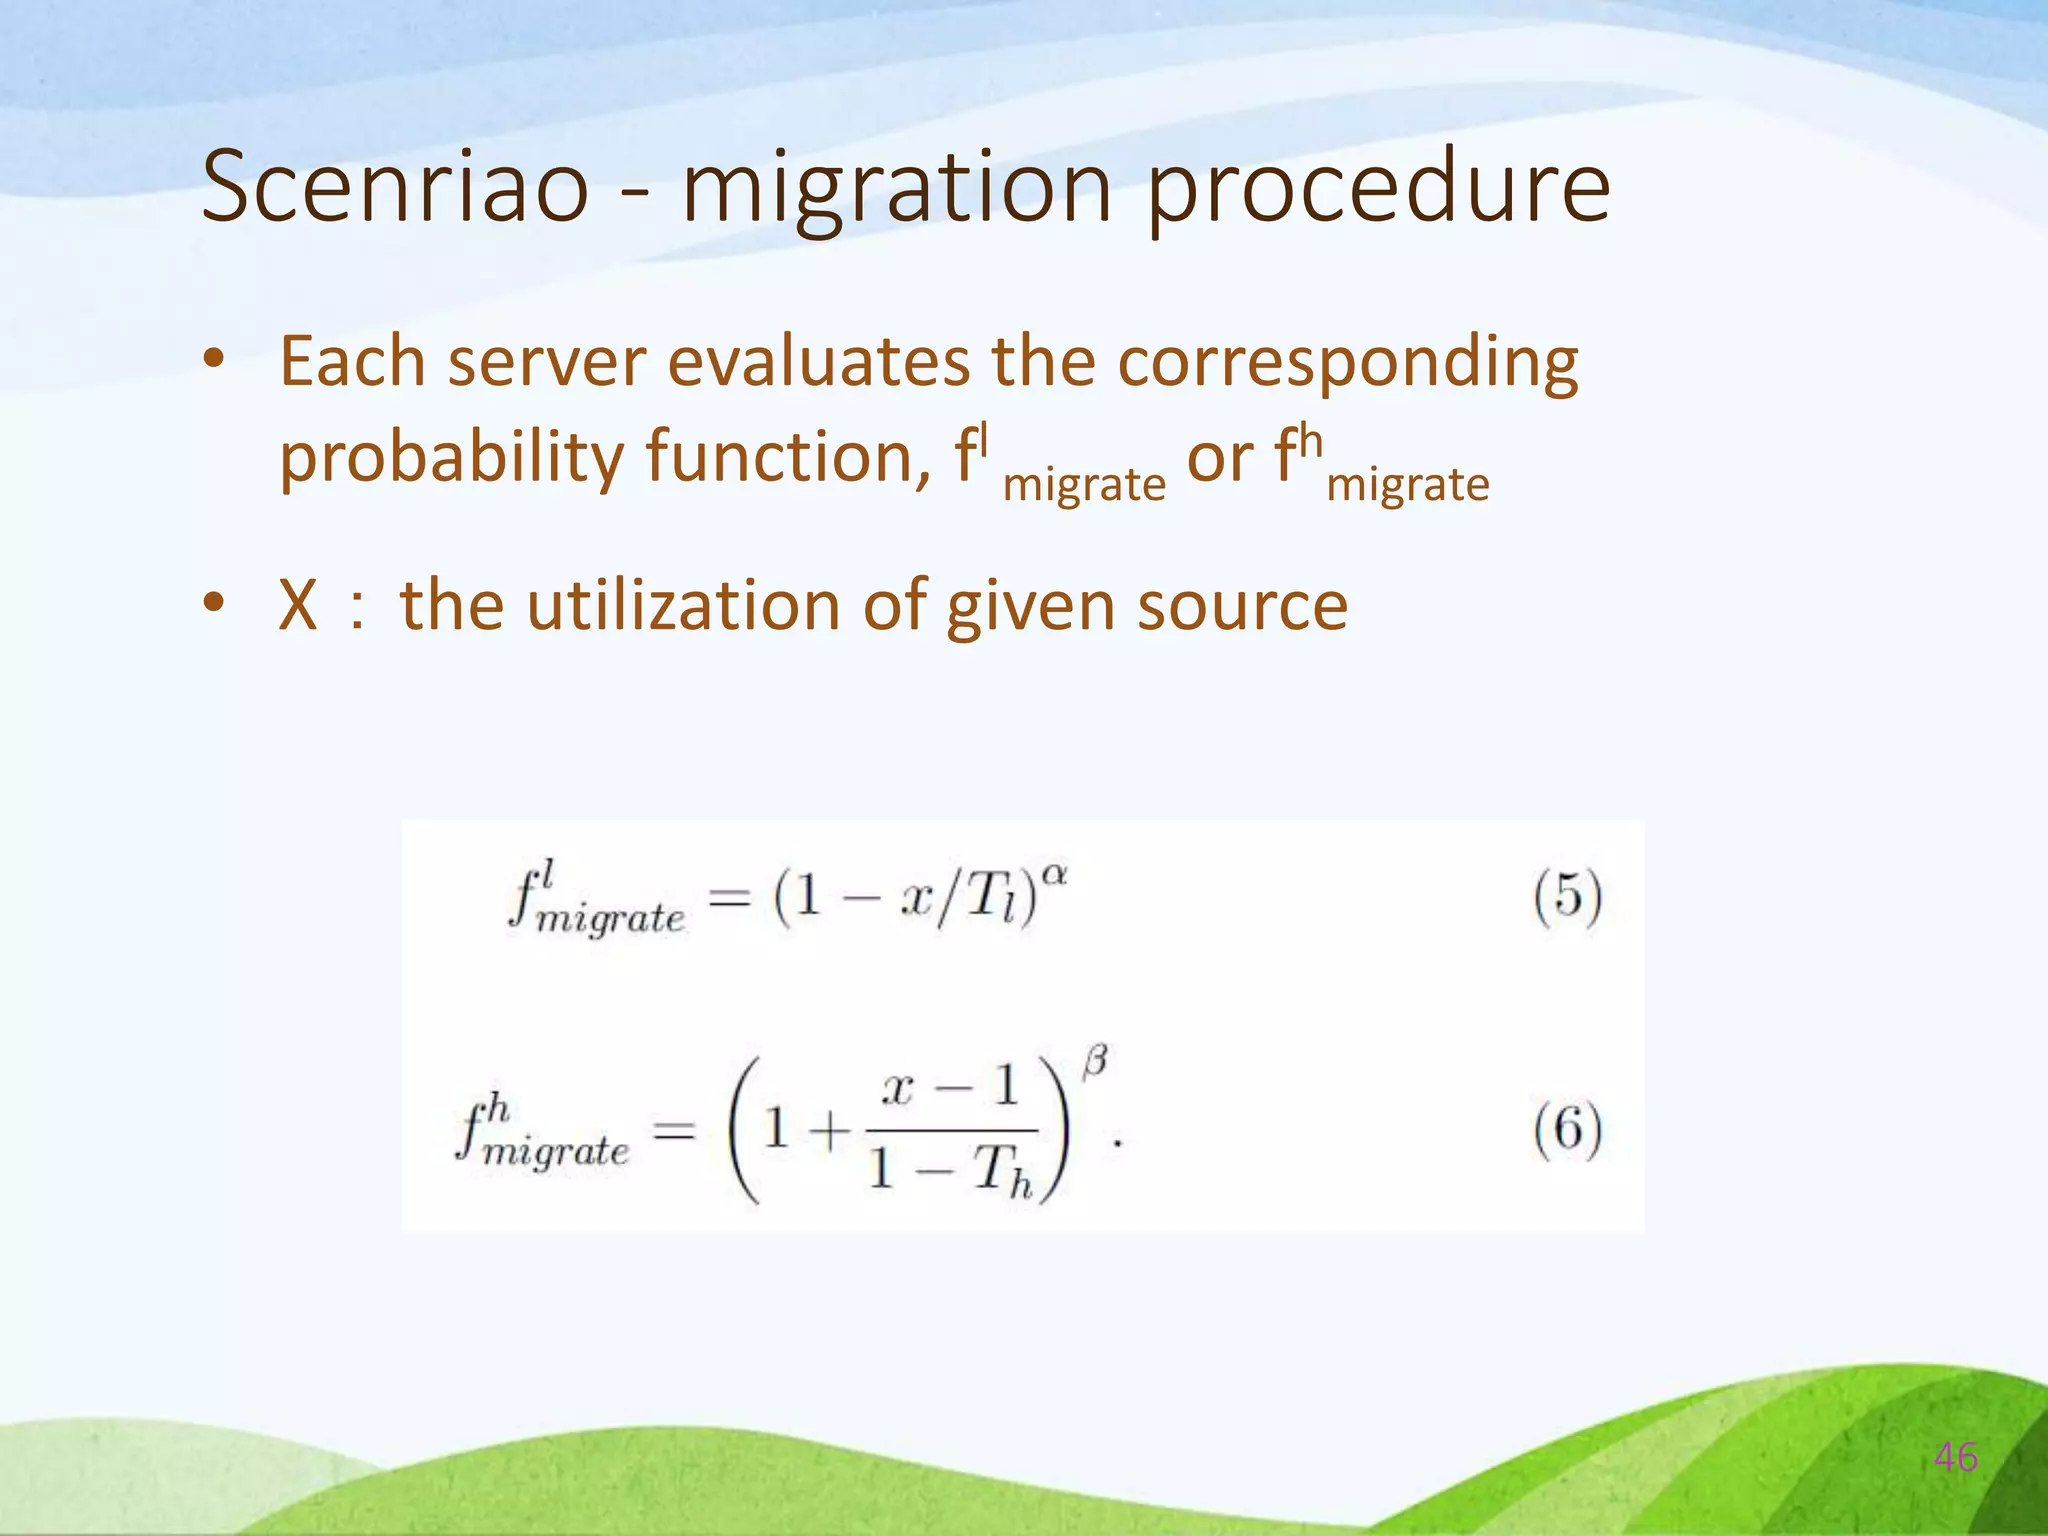
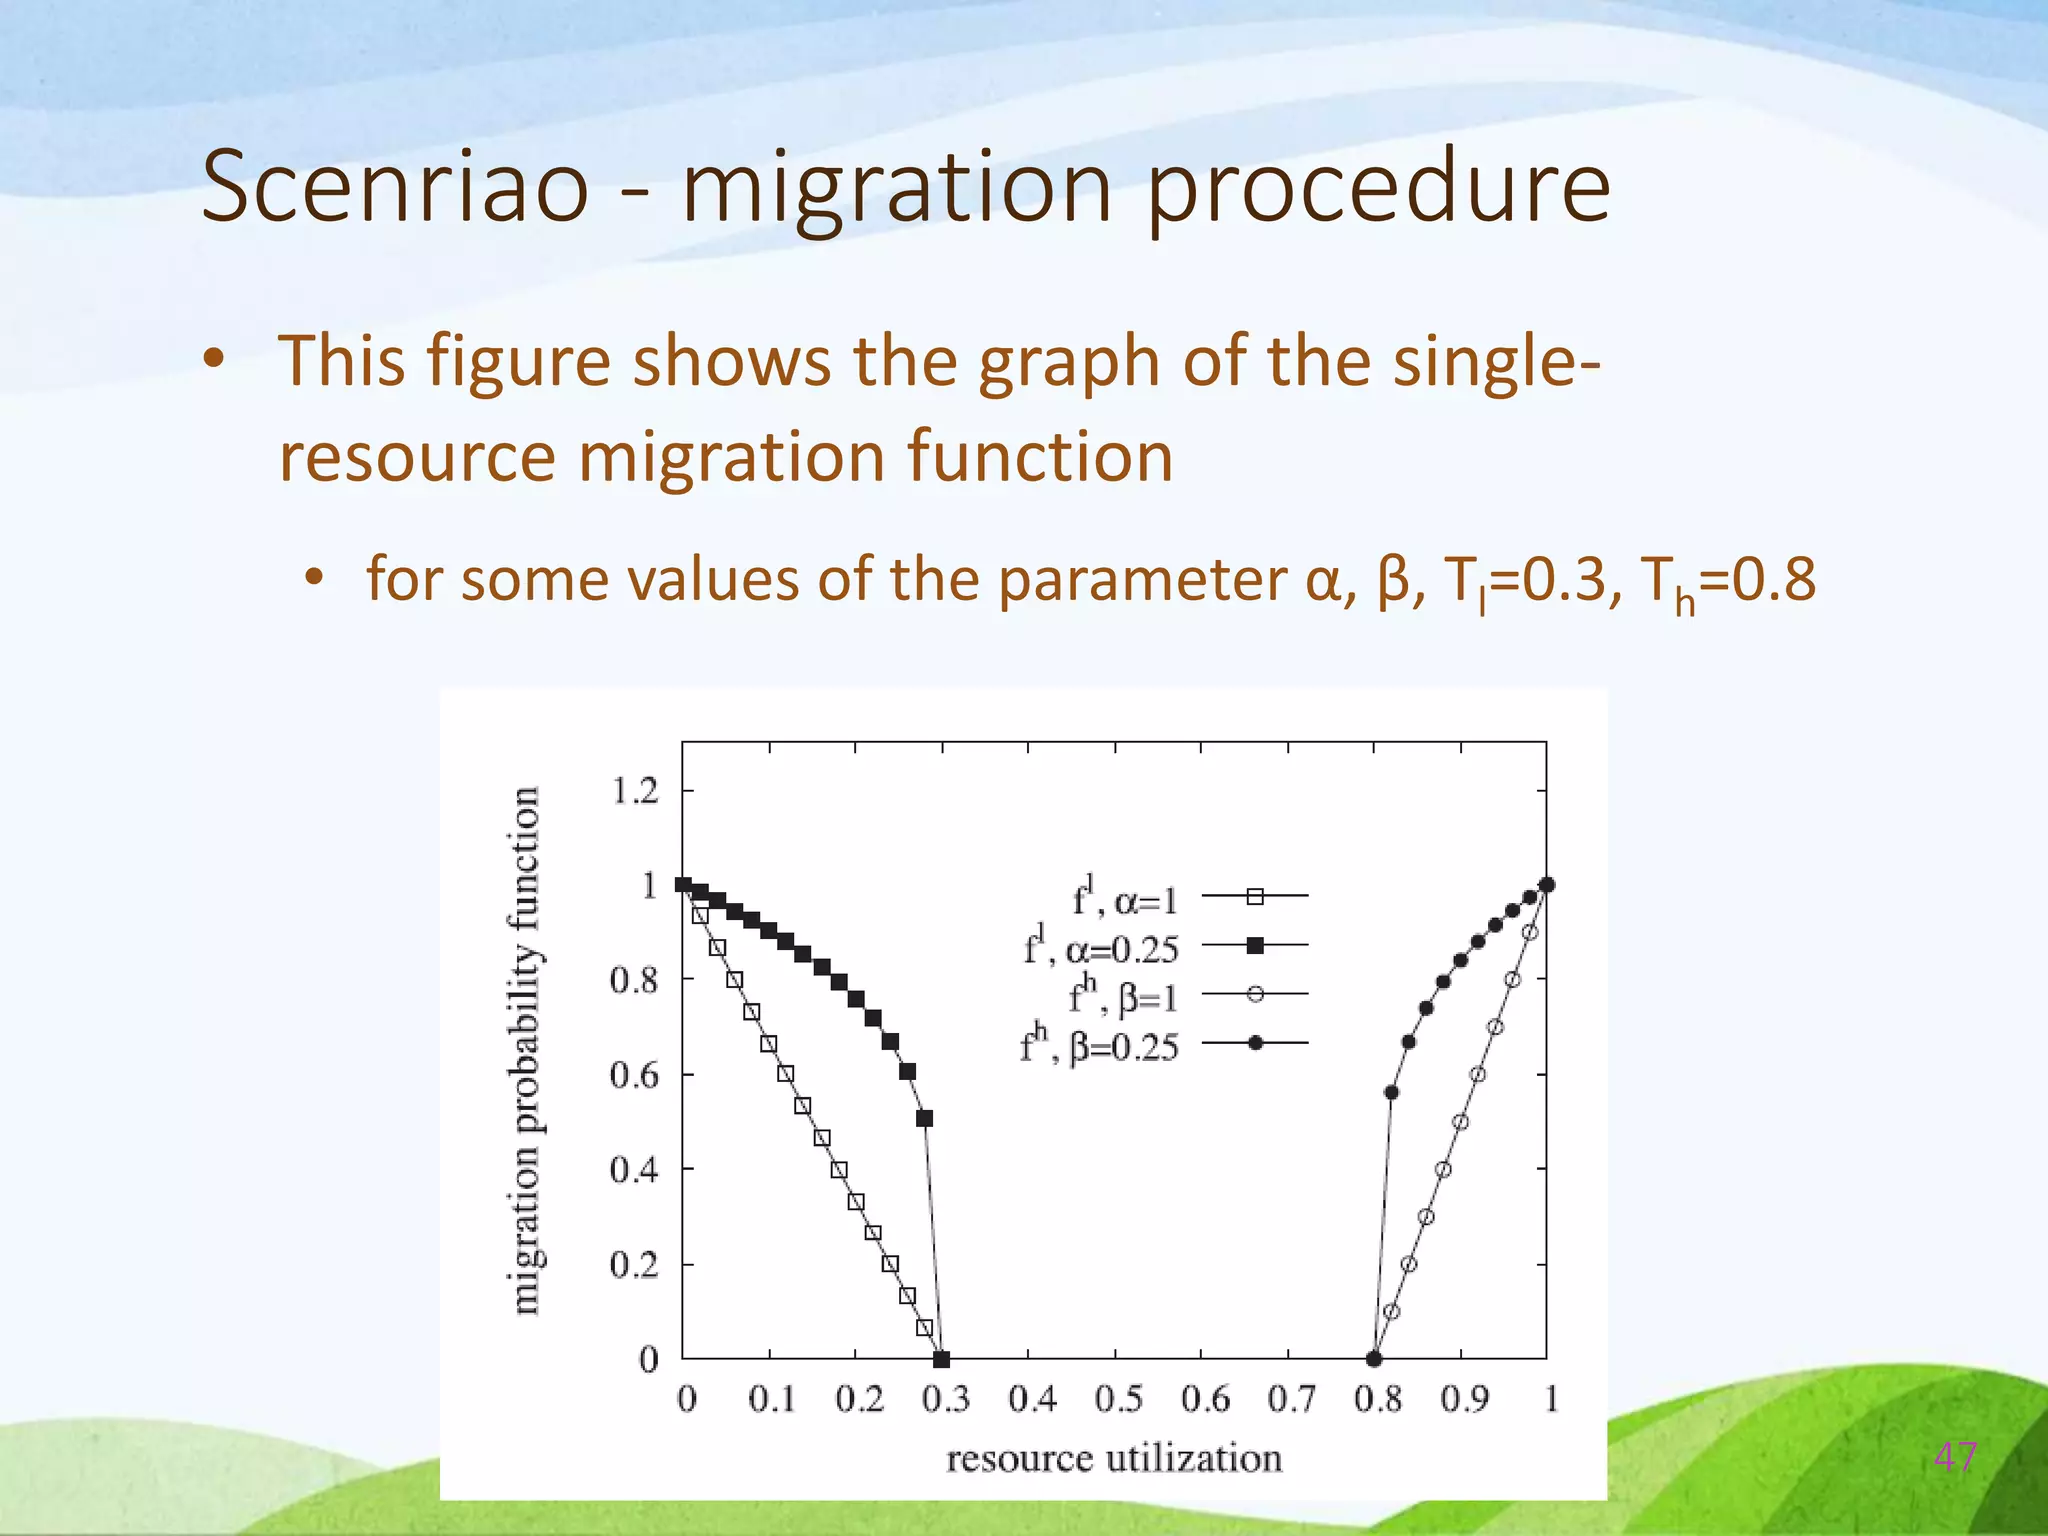
The document describes a probabilistic approach called ecoCloud for consolidating virtual machines (VMs) across physical servers in a cloud data center. EcoCloud uses two probabilistic procedures - assignment and migration - to autonomously distribute VMs among servers based on local resource utilization information, with the goal of improving utilization levels, reducing power consumption, and avoiding SLA violations. The assignment procedure determines whether an idle server should accept a new VM or not, while the migration procedure determines whether an underutilized VM should migrate to another server for better consolidation. Both procedures are based on simple Bernoulli trials using resource utilization-dependent probability functions.


![[BDD 2025 - Full-Stack Development] PHP in AI Age: The Laravel Way. (Rizqy Hi...](https://cdn.slidesharecdn.com/ss_thumbnails/fs-phpinaiagethelaravelway-251125012602-ef9d330e-thumbnail.jpg?width=640&height=640&fit=bounds)

![[BDD 2025 - Artificial Intelligence] AI for the Underdogs: Innovation for Sma...](https://cdn.slidesharecdn.com/ss_thumbnails/ai-aifortheunderdogsinnovationforsmallbusinesses-251124030839-72a599a4-thumbnail.jpg?width=640&height=640&fit=bounds)


![[BDD 2025 - Full-Stack Development] Agentic AI Architecture: Redefining Syste...](https://cdn.slidesharecdn.com/ss_thumbnails/fs-agenticaiarchitectureredefiningsystemcommunication-251124030838-e6c70cc2-thumbnail.jpg?width=640&height=640&fit=bounds)


