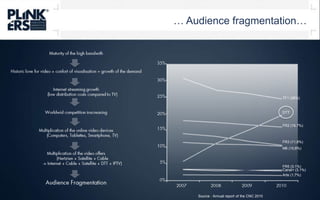
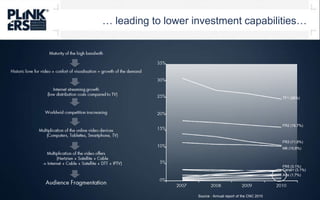
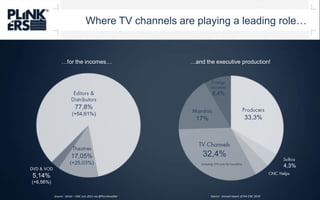
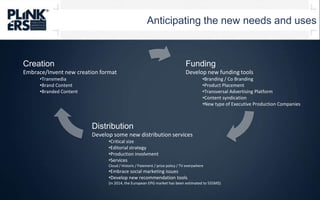
Cross VideoDaysOpeningKeynote
Let’s size the online videomarket
An exploding market !1bn consumers of online videos14+hrsa month- people spent watching online videos201 views per user in 2010+71% views/pers of online videos 201040%of the traffic201457%of the trafficComScore Nov 201060%Video traffic in the worldX5Share of the data mobile traffic used for video in 201135hrs of video uploaded/min2bn views per day700bn views per yearSource YouTube Dec 2010Etude Cisco 2010
An exploding market !Shares of traffic by usesOnline VideoStreams / Quarter400 000 000Broadcast networks350 000 000Webmedia BrandsVideoTraffic51%100%300 000 000Other250 000 000TelnetNewsGroupDNSEmail200 000 000Magazine publishersP2PMusic labels150 000 000NewspaperPublishers100 000 000FTP50 000 000Radio Broadcasters0WebQ1Q2Q3Q4Q5Q6Q7Q8Q92010200820090%19952010Source : Brightcove / TubeMogul Mai 2010Source : Limelight Network 2010
Led by the European and American TV ChannelsAudience Share by category & geographical zonesBrandsBroadcastersMagazinesNewspapersOnline Media4,19mn100%Others3,36mn75%2,53mnUSA50%2,30mn25%1,26mnEU0,43mnAPAC0%BrandsBroadcastersMagazinesNewspapersOnline MediaAPACEUUSAOthersSource : Brightcove Online Video & the Media Industry Q4 2010
An averageVideolength short but verymisleading  !2,48  l  2,361,22  l  1,241,57  l  2,011,52  l  1,30US   l   EUUS   l   EUUS   l   EUUS   l   EUBroadcastersMagazinesMusicNewspaperSource : Brightcove Online Video & the Media Industry Q4 2010
Increased by the «Connected TV » Phenomenom !42,2%of the TV   are really   connectedConnected TV devices worldwide trend20142011200MConnected TV devicesConnected Blu-Ray PlayersConnected Game ConsoleConnected Digital Video Players (Set Top Boxes)18% of the TV100MAre really connected0M201020102010201020102010Source : Parks Associates 2010
The connected TV more than a device, an ecosystem…@
…whereeachscreen has itsown use…CouchpotatoCouchpotatoSittingStanding upPositionPersonalPrivateUsesFamilyPersonal + sharedVideoNewsGameWorkSociabilisationEntertainmentSociabilisationWorkGamesNewsEntertainmentSociabilisationGoals***************Incoming data************Outgoing data
…with a specific vocabulary !UsesBusinessFragmentationCord CuttingPiratage(P2P, Streaming)DisintermediationFormatMonetisation(PPV, Pub, SVOD, Hybrid)unlinearisationPre-financingMultitaskingDual ScreenAudience trackingSocial TVOTTReal Time BiddingEnrichmentAgregation/CurationModels open/closedRecommandationDRM /FingerprintingTechnologyStandardisationOS / FrameworkAndroid / iOS / ConstructeurSynchronisationHTML 5 / FlashCloudComputingSDKWebM/H264Open Source
Cock-a-doodle-doo !
The IPTV Landscape in France58 377 000 TV owners in France20106,8 Millions IPTVIn France(WorldWide Leader)20127,8 Millions59% of the TV willbe connectableMain activities in France(Src TNS Sofres 2010) Satelite17 359 000(26%)DTT28 723 000(43%)Watching TV3h39`(+7min)ADSL14 368 000(21%)SleepCable6 739 000(10%)WorkSrce : Mediametrie January 2010
The emerging second screen landscapePenetration rate36%Means 20 880 000 peoplePenetration rate72%   means    17 400 000 householdsPenetration rate5%Means 1 200 000households
Withclearimpacts on consumers!
Content is not just about the linearscheduleanymore33 Million people know whatVOD is (86% of the internet users)4,6 Million people use VOD (27% of the internet users)90% VOD penetrationforecastedby 201575% of the VOD views in 2010 wereCinema and Premium Releases64% of the french tv shows are available on catch up TVWhichmeansaround15000 videosavailableDo youwatch online programs (US internet usersJanuary 2011 lab42 Study)- de 1818-24 (34h)25-3435-4445-5455-64+90%In one year of DVR use80%79%72%51%36%31%Means68% TVSoit 19h
Consumers are multitasking !French fiction TV fans are interested in additional content on internet, related to what they are watching(which goes to 30 % for the 15-24)59% of TV ViewersAre «Multitaskers»(means 2h30 during december2010)Src : Nielsen january 201120%Would you be interested by a more interactive TV98%Of Ipad Owners uses it regularly watching the TV86%Of smartphoneowners use it regularly watchingthe TVSrc :  Yahoo! 2010Src :  NY Times Aout 2010Very interestedinterestedA bitInterestednotInterested
2nd Screen :  The hub for Social TVPart de temps passé par type d’usageTypicalactivitiesdone on the 2nd screenwhilewatching TV33%Using mobile appsBrowsing the internet37%40%Social NetworkingTextingwithfriends & family56%Source : Nielsen Q1 2011 (mobile ConnectedDevice Report)
The Social TVGo every day on internet while watching the TVDuring SuperBowlin 201037%Use social networks such as Facebook or Twitter while watching the TV 169 million viewers=4000 tweets / secDuring the last seconds44%Have ever chatted about a TV content while watching it37%In 20111b postswill be written via About a TV showSrc : DeloitteHave already shared a TV content via social networks19%Use social network to improve their TV experience44%
And clear impacts on the value chain !
Internationalisation…
… Illegal downloads…The 10 movies most illegally downloaded in 2010= 92 480 000 downloads= $400 Millions of shortfall450 000 movies illegally downloadedper dayin France 43,5% of the 11-15illegally downloaded movies and series(1/4 asked by their parents!)76% of the pirates say they would have preferred watching their content through TV if they would have had the opportunityMegaUpload45 millions of U.V/ day= 1% of the worldwide traffic = more than FacebookSource : Jumpwire Octobre 2010Source : Source Sandvine fev 2010
… Audience fragmentation…Maturity of the highbandwithHistoric love for video + confort of visualisation = growth of the demandInternet streaming growth(low distribution costscompared to TV)WorldwidcompetitioninscreasingMultiplication of the online videodevices(Computers, Tablettes, Smartphone, TV)Multiplication of the videooffers(Hertzien + Satellite + Cable-> Internet + Cable + Satellite + DTT + IPTV)Audience Fragmentation35%30%25%TF1 (26%)DTT20%FR2 (16,7%)15%FR3 (11,8%)10%M6 (10,8%)5%FR5 (3,1%)Canal+ (3,1%)Arte (1,7%)0%2010200920082007Source : Annual report of the CNC 2010
… leading to lowerinvestmentcapabilities…Maturity of the highbandwithHistoric love for video + confort of visualisation = growth of the demandInternet streaming growth(low distribution costscompared to TV)WorldwidcompetitioninscreasingMultiplication of the online videodevices(Computers, Tablettes, Smartphone, TV)Multiplication of the videooffers(Hertzien + Satellite + Cable-> Internet + Cable + Satellite + DTT + IPTV)Audience Fragmentation35%30%25%TF1 (26%)20%FR2 (16,7%)15%FR3 (11,8%)10%M6 (10,8%)5%FR5 (3,1%)Canal+ (3,1%)Arte (1,7%)0%2010200920082007Source : Annual report of the CNC 2010
… Shakingup the value chainHierAujourd'huiOther public investment(Regions, Departements, Cities….)Other public investment(Regions, Departements, Cities….)EuropeanhelpsEuropeanhelpsCNCCNCWorldWide distributionWorldWide distributionFrench ChannelsFrench ChannelsProducersProducersAuthorsAuthors
Where TV channels are playing a leading role……for the incomes……and the executive production!Foreignincomes8,4%Editors &Distributors77,8%(+54,61%)Producers33,3%Mandats17%TV Channels32,4%Theatres17,05%(+25,03%)Sofica4,3%Including 17% only for CanalPlusDVD & VOD5,14%(+6,56%)CNC HelpsSource : annual report of the CNC 2010Source : Sénat – CNC Juin 2011 via @PLechevallier
So what are our challenges ?
Let’sbecreative in monetisationstrategiesVOD PlatformConsumer electronicsEuropeanhelpsCNCFAIEditeurs mobilesOther public investment(Regions, Departements, Cities….)LisencingSponsoringWorldWide distributionBrand ContentProduct PlacementIndependent Video Ad Platforms(for ex : real time biddingplatforms)French ChannelsMonetisationSyndicationDisintermediation
How to adapt to world wide competition?Latine America2,3%2006 > 2009 = -15% on exportationsToday100M€ in exportationsWhich means10% of all incomesMiddele Orient4,6%Protect or attack ?HBBTV or HTML5Get a critical size(Hulu, Netflix, YouView, what about France ?)Focus on the local content or International ?(some rumors speak about arrival of american studio in south of France)Localformat or exportableMainstream or Segmenting ?And what about the « Media Chronology» ?S.Jobs: “You’ll Be Able To Watch A First Run Movie Before It Hits Theaters”(2 june2010)Africa2,1%APAC8,6%North America9,50%Western Europe62%Central Europe10,50%
Help on standardisation!What about OS standards ? « Open » or « Closed »……and what about web standards !LanguagesNormes+Natively supported video format+Ogg Theora       H264       VP8 WebMInternet explorerMozilla FirefoxGoogle ChromeSafariOperaNO9.0Depends3.5NO4.03.0NO6.0NO3.1Depends10.5NO10.6
Anticipating the new needs and usesFundingDevelop new funding toolsBranding / Co Branding
Product Placement
Transversal Advertising Platform
Content syndication
New type of Executive Production CompaniesCreation Embrace/Invent new creation formatTransmedia

Prez cross-video-days-english

  • 1.
  • 2.
    Let’s size theonline videomarket
  • 3.
    An exploding market!1bn consumers of online videos14+hrsa month- people spent watching online videos201 views per user in 2010+71% views/pers of online videos 201040%of the traffic201457%of the trafficComScore Nov 201060%Video traffic in the worldX5Share of the data mobile traffic used for video in 201135hrs of video uploaded/min2bn views per day700bn views per yearSource YouTube Dec 2010Etude Cisco 2010
  • 4.
    An exploding market!Shares of traffic by usesOnline VideoStreams / Quarter400 000 000Broadcast networks350 000 000Webmedia BrandsVideoTraffic51%100%300 000 000Other250 000 000TelnetNewsGroupDNSEmail200 000 000Magazine publishersP2PMusic labels150 000 000NewspaperPublishers100 000 000FTP50 000 000Radio Broadcasters0WebQ1Q2Q3Q4Q5Q6Q7Q8Q92010200820090%19952010Source : Brightcove / TubeMogul Mai 2010Source : Limelight Network 2010
  • 5.
    Led by theEuropean and American TV ChannelsAudience Share by category & geographical zonesBrandsBroadcastersMagazinesNewspapersOnline Media4,19mn100%Others3,36mn75%2,53mnUSA50%2,30mn25%1,26mnEU0,43mnAPAC0%BrandsBroadcastersMagazinesNewspapersOnline MediaAPACEUUSAOthersSource : Brightcove Online Video & the Media Industry Q4 2010
  • 6.
    An averageVideolength shortbut verymisleading !2,48 l 2,361,22 l 1,241,57 l 2,011,52 l 1,30US l EUUS l EUUS l EUUS l EUBroadcastersMagazinesMusicNewspaperSource : Brightcove Online Video & the Media Industry Q4 2010
  • 7.
    Increased by the«Connected TV » Phenomenom !42,2%of the TV are really connectedConnected TV devices worldwide trend20142011200MConnected TV devicesConnected Blu-Ray PlayersConnected Game ConsoleConnected Digital Video Players (Set Top Boxes)18% of the TV100MAre really connected0M201020102010201020102010Source : Parks Associates 2010
  • 8.
    The connected TVmore than a device, an ecosystem…@
  • 9.
    …whereeachscreen has itsownuse…CouchpotatoCouchpotatoSittingStanding upPositionPersonalPrivateUsesFamilyPersonal + sharedVideoNewsGameWorkSociabilisationEntertainmentSociabilisationWorkGamesNewsEntertainmentSociabilisationGoals***************Incoming data************Outgoing data
  • 10.
    …with a specificvocabulary !UsesBusinessFragmentationCord CuttingPiratage(P2P, Streaming)DisintermediationFormatMonetisation(PPV, Pub, SVOD, Hybrid)unlinearisationPre-financingMultitaskingDual ScreenAudience trackingSocial TVOTTReal Time BiddingEnrichmentAgregation/CurationModels open/closedRecommandationDRM /FingerprintingTechnologyStandardisationOS / FrameworkAndroid / iOS / ConstructeurSynchronisationHTML 5 / FlashCloudComputingSDKWebM/H264Open Source
  • 11.
  • 12.
    The IPTV Landscapein France58 377 000 TV owners in France20106,8 Millions IPTVIn France(WorldWide Leader)20127,8 Millions59% of the TV willbe connectableMain activities in France(Src TNS Sofres 2010) Satelite17 359 000(26%)DTT28 723 000(43%)Watching TV3h39`(+7min)ADSL14 368 000(21%)SleepCable6 739 000(10%)WorkSrce : Mediametrie January 2010
  • 13.
    The emerging secondscreen landscapePenetration rate36%Means 20 880 000 peoplePenetration rate72% means 17 400 000 householdsPenetration rate5%Means 1 200 000households
  • 14.
  • 15.
    Content is notjust about the linearscheduleanymore33 Million people know whatVOD is (86% of the internet users)4,6 Million people use VOD (27% of the internet users)90% VOD penetrationforecastedby 201575% of the VOD views in 2010 wereCinema and Premium Releases64% of the french tv shows are available on catch up TVWhichmeansaround15000 videosavailableDo youwatch online programs (US internet usersJanuary 2011 lab42 Study)- de 1818-24 (34h)25-3435-4445-5455-64+90%In one year of DVR use80%79%72%51%36%31%Means68% TVSoit 19h
  • 16.
    Consumers are multitasking!French fiction TV fans are interested in additional content on internet, related to what they are watching(which goes to 30 % for the 15-24)59% of TV ViewersAre «Multitaskers»(means 2h30 during december2010)Src : Nielsen january 201120%Would you be interested by a more interactive TV98%Of Ipad Owners uses it regularly watching the TV86%Of smartphoneowners use it regularly watchingthe TVSrc : Yahoo! 2010Src : NY Times Aout 2010Very interestedinterestedA bitInterestednotInterested
  • 17.
    2nd Screen : The hub for Social TVPart de temps passé par type d’usageTypicalactivitiesdone on the 2nd screenwhilewatching TV33%Using mobile appsBrowsing the internet37%40%Social NetworkingTextingwithfriends & family56%Source : Nielsen Q1 2011 (mobile ConnectedDevice Report)
  • 18.
    The Social TVGoevery day on internet while watching the TVDuring SuperBowlin 201037%Use social networks such as Facebook or Twitter while watching the TV 169 million viewers=4000 tweets / secDuring the last seconds44%Have ever chatted about a TV content while watching it37%In 20111b postswill be written via About a TV showSrc : DeloitteHave already shared a TV content via social networks19%Use social network to improve their TV experience44%
  • 19.
    And clear impactson the value chain !
  • 20.
  • 21.
    … Illegal downloads…The10 movies most illegally downloaded in 2010= 92 480 000 downloads= $400 Millions of shortfall450 000 movies illegally downloadedper dayin France 43,5% of the 11-15illegally downloaded movies and series(1/4 asked by their parents!)76% of the pirates say they would have preferred watching their content through TV if they would have had the opportunityMegaUpload45 millions of U.V/ day= 1% of the worldwide traffic = more than FacebookSource : Jumpwire Octobre 2010Source : Source Sandvine fev 2010
  • 22.
    … Audience fragmentation…Maturityof the highbandwithHistoric love for video + confort of visualisation = growth of the demandInternet streaming growth(low distribution costscompared to TV)WorldwidcompetitioninscreasingMultiplication of the online videodevices(Computers, Tablettes, Smartphone, TV)Multiplication of the videooffers(Hertzien + Satellite + Cable-> Internet + Cable + Satellite + DTT + IPTV)Audience Fragmentation35%30%25%TF1 (26%)DTT20%FR2 (16,7%)15%FR3 (11,8%)10%M6 (10,8%)5%FR5 (3,1%)Canal+ (3,1%)Arte (1,7%)0%2010200920082007Source : Annual report of the CNC 2010
  • 23.
    … leading tolowerinvestmentcapabilities…Maturity of the highbandwithHistoric love for video + confort of visualisation = growth of the demandInternet streaming growth(low distribution costscompared to TV)WorldwidcompetitioninscreasingMultiplication of the online videodevices(Computers, Tablettes, Smartphone, TV)Multiplication of the videooffers(Hertzien + Satellite + Cable-> Internet + Cable + Satellite + DTT + IPTV)Audience Fragmentation35%30%25%TF1 (26%)20%FR2 (16,7%)15%FR3 (11,8%)10%M6 (10,8%)5%FR5 (3,1%)Canal+ (3,1%)Arte (1,7%)0%2010200920082007Source : Annual report of the CNC 2010
  • 24.
    … Shakingup thevalue chainHierAujourd'huiOther public investment(Regions, Departements, Cities….)Other public investment(Regions, Departements, Cities….)EuropeanhelpsEuropeanhelpsCNCCNCWorldWide distributionWorldWide distributionFrench ChannelsFrench ChannelsProducersProducersAuthorsAuthors
  • 25.
    Where TV channelsare playing a leading role……for the incomes……and the executive production!Foreignincomes8,4%Editors &Distributors77,8%(+54,61%)Producers33,3%Mandats17%TV Channels32,4%Theatres17,05%(+25,03%)Sofica4,3%Including 17% only for CanalPlusDVD & VOD5,14%(+6,56%)CNC HelpsSource : annual report of the CNC 2010Source : Sénat – CNC Juin 2011 via @PLechevallier
  • 26.
    So what areour challenges ?
  • 27.
    Let’sbecreative in monetisationstrategiesVODPlatformConsumer electronicsEuropeanhelpsCNCFAIEditeurs mobilesOther public investment(Regions, Departements, Cities….)LisencingSponsoringWorldWide distributionBrand ContentProduct PlacementIndependent Video Ad Platforms(for ex : real time biddingplatforms)French ChannelsMonetisationSyndicationDisintermediation
  • 28.
    How to adaptto world wide competition?Latine America2,3%2006 > 2009 = -15% on exportationsToday100M€ in exportationsWhich means10% of all incomesMiddele Orient4,6%Protect or attack ?HBBTV or HTML5Get a critical size(Hulu, Netflix, YouView, what about France ?)Focus on the local content or International ?(some rumors speak about arrival of american studio in south of France)Localformat or exportableMainstream or Segmenting ?And what about the « Media Chronology» ?S.Jobs: “You’ll Be Able To Watch A First Run Movie Before It Hits Theaters”(2 june2010)Africa2,1%APAC8,6%North America9,50%Western Europe62%Central Europe10,50%
  • 29.
    Help on standardisation!Whatabout OS standards ? « Open » or « Closed »……and what about web standards !LanguagesNormes+Natively supported video format+Ogg Theora H264 VP8 WebMInternet explorerMozilla FirefoxGoogle ChromeSafariOperaNO9.0Depends3.5NO4.03.0NO6.0NO3.1Depends10.5NO10.6
  • 30.
    Anticipating the newneeds and usesFundingDevelop new funding toolsBranding / Co Branding
  • 31.
  • 32.
  • 33.
  • 34.
    New type ofExecutive Production CompaniesCreation Embrace/Invent new creation formatTransmedia