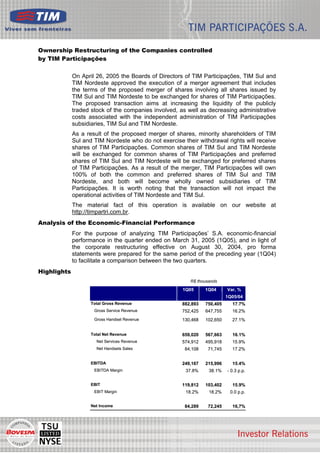
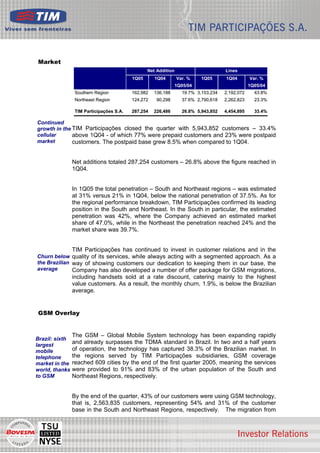
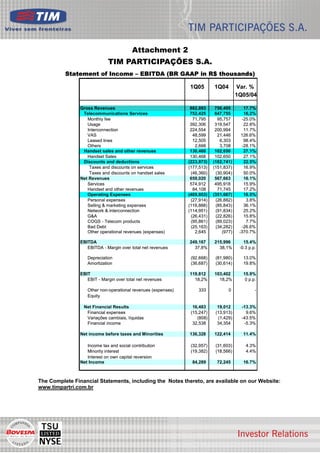
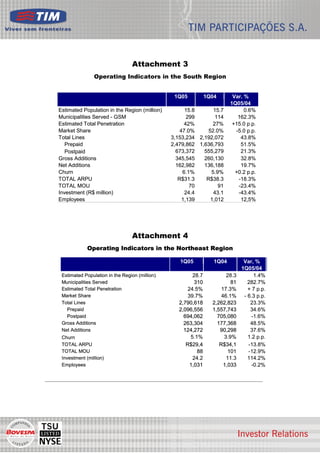
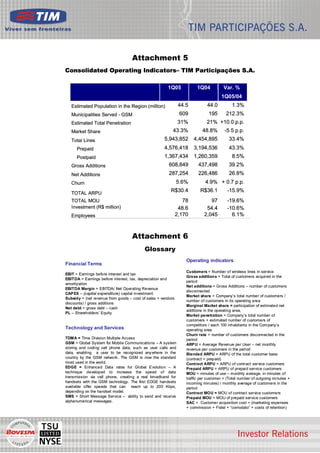
1) TIM Participações S.A. announced its consolidated results for the first quarter of 2005, with revenues of R$882.8 million, a 17.7% increase over the first quarter of 2004. EBITDA was R$249.2 million, a 15.4% increase.
2) The company served 5,943,852 cellular customers as of the end of the first quarter of 2005, a 33.4% increase over the same period in 2004. Net additions totaled 287,254 customers in the quarter.
3) GSM coverage reached 86.1% of the urban population in areas served. Migration from TDMA to GSM technology accelerated, with 138,
This presentation contains forward-looking statements that reflect the current views of Deutsche Telekom management with respect to future events. These forward-looking statements include statements with regard to the expected development of revenue, earnings, profits from operations, depreciation and amortization, cash flows and personnel-related measures. You should consider them with caution. Such statements are subject to risks and uncertainties, most of which are difficult to predict and are generally beyond Deutsche Telekom’s control. Among the factors that might influence our ability to achieve our objectives are the progress of our workforce reduction initiative and other cost-saving measures, and the impact of other significant strategic, labor or business initiatives, including acquisitions, dispositions and business combinations, and our network upgrade and expansion initiatives. In addition, stronger than expected competition, technological change, legal proceedings and regulatory developments, among other factors, may have a material adverse effect on our costs and revenue development. Further, the economic downturn in our markets, and changes in interest and currency exchange rates, may also have an impact on our business development and the availability of financing on favorable conditions. Changes to our expectations concerning future cash flows may lead to impairment write downs of assets carried at historical cost, which may materially affect our results at the group and operating segment levels. If these or other risks and uncertainties materialize, or if the assumptions underlying any of these statements prove incorrect, our actual performance may materially differ from the performance expressed or implied by forward-looking statements. We can offer no assurance that our estimates or expectations will be achieved. Without prejudice to existing obligations under capital market law, we do not assume any obligation to update forward-looking statements to take new information or future events into account or otherwise.
In addition to figures prepared in accordance with IFRS, Deutsche Telekom also presents non-GAAP financial performance measures, including, among others, EBITDA, EBITDA margin, adjusted EBITDA, adjusted EBITDA margin, adjusted EBIT, adjusted net income, free cash flow, gross debt and net debt. These non-GAAP measures should be considered in addition to, but not as a substitute for, the information prepared in accordance with IFRS. Non-GAAP financial performance measures are not subject to IFRS or any other generally accepted accounting principles. Other companies may define these terms in different ways.
Financial Results for the 2nd Quarter of the Fiscal Year Ending March 2016KDDI
The figures included in the following brief,
including the business performance target and the
target for the number of subscribers are all
projected data based on the information currently
available to the KDDI Group, and are subject to
variable factors such as economic conditions, a
competitive environment and the future prospects for
newly introduced services.
Accordingly, please be advised that the actual
results of business performance or of the number of
subscribers may differ substantially from the
projections described here.
Esta es la guía práctica del Mundial Sudáfrica 2010, producida por Dan Hojman (www.jugadapreparada.com.ar) para el sitio Tremendamente Motivados (www.tremendamentemotivados.com)
1. Paulo Roberto Cruz Cozza
Contacts Chief Financial Officer and Director of
Investor Relations
Joana Dark Fonseca Serafim
Investor Relations
(41) 9913-0006 / 312-6862
jserafim@timsul.com.br
Leonardo Marques Wanderley
Investor Relations
(81) 9923-0023 / (41) 312-6862
lwanderley@timsul.com.br
Website
http://www.timpartri.com.br
Curitiba, April 27, 2005 – TIM Participações S.A. (BOVESPA: TCLS3 and TCLS4; and
NYSE: TSU), the holding company of TIM Sul S.A. and TIM Nordeste Telecomunicações
S.A., today announced the results for the first quarter 2005 (1Q05). TIM Participações S.A.
provides cellular telecommunications services in the states of Paraná, Santa Catarina,
Piauí, Ceará, Rio Grande do Norte, Paraíba, Pernambuco, Alagoas and in the city of
Pelotas (RS) through its operating subsidiaries. The financial and operational information
below, except when otherwise indicated, is presented on a consolidated basis and in
Reals, according to the Brazilian Corporate Law, and comparisons refer to the first quarter
of 2004 (1Q04), unless otherwise indicated.
TIM PARTICIPAÇÕES S.A. ANNOUNCES ITS CONSOLIDATED RESULTS
FOR THE FIRST QUARTER 2005
The Board of Directors authorized the execution of a merger agreement of the
proposed merger of shares involving all shares issued by TIM Sul and TIM
Nordeste to be exchanged for shares of TIM Participações.
GSM coverage reaches 86.1 % of the urban population.
Success in the migration of customers from TDMA to GSM: almost 6 times
more than lines migrated than in 1Q04.
Successful customer retention strategy: Churn rate of 5.6% in 1Q05, one of
the lowest in the industry.
26.8% increase in net additions and 33.4% growth of the customer base over
1Q04.
8.5% expansion of the postpaid base when compared to 1Q04.
17.7% growth of the total gross revenue over 1Q04.
126.6% increase in VAS revenue (Value-Added Services).
EBITDA of R$ 249.2 million, 15.4% above 1Q04.
EBIT margin of 18.2%: stable year over year.
Net income: R$ 84.3 million, 16.7% growth versus 1Q04.
1
2. Ownership Restructuring of the Companies controlled
by TIM Participações
On April 26, 2005 the Boards of Directors of TIM Participações, TIM Sul and
TIM Nordeste approved the execution of a merger agreement that includes
the terms of the proposed merger of shares involving all shares issued by
TIM Sul and TIM Nordeste to be exchanged for shares of TIM Participações.
The proposed transaction aims at increasing the liquidity of the publicly
traded stock of the companies involved, as well as decreasing administrative
costs associated with the independent administration of TIM Participações
subsidiaries, TIM Sul and TIM Nordeste.
As a result of the proposed merger of shares, minority shareholders of TIM
Sul and TIM Nordeste who do not exercise their withdrawal rights will receive
shares of TIM Participações. Common shares of TIM Sul and TIM Nordeste
will be exchanged for common shares of TIM Participações and preferred
shares of TIM Sul and TIM Nordeste will be exchanged for preferred shares
of TIM Participações. As a result of the merger, TIM Participações will own
100% of both the common and preferred shares of TIM Sul and TIM
Nordeste, and both will become wholly owned subsidiaries of TIM
Participações. It is worth noting that the transaction will not impact the
operational activities of TIM Nordeste and TIM Sul.
The material fact of this operation is available on our website at
http://timpartri.com.br.
Analysis of the Economic-Financial Performance
For the purpose of analyzing TIM Participações’ S.A. economic-financial
performance in the quarter ended on March 31, 2005 (1Q05), and in light of
the corporate restructuring effective on August 30, 2004, pro forma
statements were prepared for the same period of the preceding year (1Q04)
to facilitate a comparison between the two quarters.
Highlights
R$ thousands
1Q05 1Q04 Var, %
1Q05/04
Total Gross Revenue 882,893 750,405 17.7%
Gross Service Revenue 752,425 647,755 16.2%
Gross Handset Revenue 130,468 102,650 27.1%
Total Net Revenue 659,020 567,663 16.1%
Net Services Revenue 574,912 495,918 15.9%
Net Handsets Sales 84,108 71,745 17.2%
EBITDA 249,167 215,996 15.4%
EBITDA Margin 37.8% 38.1% - 0.3 p.p.
EBIT 119,812 103,402 15.9%
EBIT Margin 18.2% 18.2% 0.0 p.p.
Net Income 84,289 72,245 16,7%
2
3. Market
Net Addition Lines
1Q05 1Q04 Var. % 1Q05 1Q04 Var. %
1Q05/04 1Q05/04
Southern Region 162,982 136,188 19.7% 3,153,234 2,192,072 43.8%
Northeast Region 124,272 90,298 37.6% 2,790,618 2,262,823 23.3%
TIM Participações S.A. 287,254 226,486 26.8% 5,943,852 4,454,895 33.4%
Continued
growth in the TIM Participações closed the quarter with 5,943,852 customers – 33.4%
cellular above 1Q04 - of which 77% were prepaid customers and 23% were postpaid
market customers. The postpaid base grew 8.5% when compared to 1Q04.
Net additions totaled 287,254 customers – 26.8% above the figure reached in
1Q04.
In 1Q05 the total penetration – South and Northeast regions – was estimated
at 31% versus 21% in 1Q04, below the national penetration of 37.5%. As for
the regional performance breakdown, TIM Participações confirmed its leading
position in the South and Northeast. In the South in particular, the estimated
penetration was 42%, where the Company achieved an estimated market
share of 47.0%, while in the Northeast the penetration reached 24% and the
market share was 39.7%.
TIM Participações has continued to invest in customer relations and in the
Churn below quality of its services, while always acting with a segmented approach. As a
the Brazilian way of showing customers our dedication to keeping them in our base, the
average Company has also developed a number of offer package for GSM migrations,
including handsets sold at a rate discount, catering mainly to the highest
value customers. As a result, the monthly churn, 1.9%, is below the Brazilian
average.
GSM Overlay
The GSM – Global Mobile System technology has been expanding rapidly
Brazil: sixth
largest
and already surpasses the TDMA standard in Brazil. In two and a half years
mobile of operation, the technology has captured 38.3% of the Brazilian market. In
telephone the regions served by TIM Participações subsidiaries, GSM coverage
market in the reached 609 cities by the end of the first quarter 2005, meaning the services
world, thanks were provided to 91% and 83% of the urban population of the South and
to GSM Northeast Regions, respectively.
By the end of the quarter, 43% of our customers were using GSM technology,
that is, 2,563,835 customers, representing 54% and 31% of the customer
base in the South and Northeast Regions, respectively. The migration from
3
4. TDMA to GSM has been intensified, so that the migration during the first
quarter totaled 138.8 thousand versus the 24.2 thousand registered in the
1Q04.
A World without Borders: Innovative Services
Solutions for Mobility, combined with distinctive products, is revolutionizing the way of life
the corporate of working people. Besides the consolidated and successful consumer offer,
market the Company offered a variety of innovative services during the period while
also increasing efficiency and productivity, which surrendering our customers
accessible anywhere by using different types of equipment and system
platforms. An example of is that is the Blackberry, the most widely used tool
to access corporate e-mails in the world. TIM Participações also counts on
new services that expand and expedite data transmission from the GSM
handset: TIM Kit Fast Edge, the first in the Brazilian market, and the GPRS
USB Modem, enabling data communication through its own platform.
Operating Revenue
The gross service revenue for 1Q05 was R$ 752.4 million, 16.2% above
1Q04. This increase stemmed mainly from the 33.4% expansion of the
subscriber base in the period, along with the 7.7% increase in traffic, the
4.4% average increase in tariffs, and the 126.6% growth in value-added
services (VAS), as well.
Gross handset revenue for the quarter was R$ 130.5 million, a 27.1%
increase over 1Q04. In the quarter, 383.0 thousand handsets were sold (of
which 94% were GSM), versus 296.2 thousand sold in 1Q04.
17.7%
increase
YOY in Total
Thus, the gross revenue amounted to R$ 882.9 million in 1Q05, surpassing
Gross
Revenue the numbers reported in 1Q04 by 17.7%.
The Average Revenue per User (ARPU) in 1Q05 was R$ 30.39, versus R$
ARPU: new 36.14 in 1Q04. This reduction is mainly due to the marked growth in the total
revenue customer base, in particular the 43% expansion in the prepaid base, as well
makeup as the fact that TIM Participações subsidiaries, TIM Sul S.A. and TIM
Nordeste Telecomunicações S.A., no longer provide national and
international long distance services.
4
5. Operating Costs and Expenses
In 1Q05, the cost of services (including network and interconnection costs,
before depreciation/amortization and personnel expenses) amounted to
R$ 114.9 million, a 25.2% increase over the R$ 91.8 million registered in
1Q04. That increase is mainly from the strong expansion in the customer
base - with the consequent increase in interconnection costs, as well as the
growth in maintenance costs due to the overlap of two networks (GSM and
TDMA).
Marked
The handset sales cost for the quarter was R$ 95.9 million, exceeding the
expansion in
handset
R$ 89.0 million reported in 1Q04.
sales
Selling expenses (without depreciation/ amortization, bad debt and personnel
Continued
expenses) were R$ 116.9 million for the quarter, 36.1% above 1Q04,
sales growth:
- 608.8 thou. reflecting the commercial boost in our customer base expansion. The gross
gross customer additions for the quarter totaled 608,849 versus 437,498 customers
additions in 1Q04, a 39.2% increment. The higher sales in the period boosted selling
- 383,0 thou. expenses related to commissions and the FISTEL tax assessed on each new
handsets sold cell phone activation.
The Subscriber Acquisition Cost (SAC) for the quarter was R$ 133.0, a 7.4%
SAC
improvement: reduction over the R$ 143.7 in 1Q04. In the 1Q05 the subsidies for the
7.4% reduction handsets were below those registered in the 1Q04, mainly due to the lower
YoY average prices of the handsets and exchange rate.
General and administrative expenses (G&A)- without
depreciation/amortization and personnel expenses totaled R$ 26.4 million,
16% above 1Q04. This increase was due to the expenses associated with the
maintenance of IT equipment after expiration of the warranty period.
Personnel expenses in the period added up to R$ 27.9 million – 3.8% above
1Q04.
Bad debt
reduction: Bad debt expenses for 1Q05 amounted to R$ 25.2 million versus R$ 34.3
improved million in the 1Q04, representing 2.8% of the total gross revenue - a 1.8 p.p.
collecting
overdue
decline year over year, thanks to the adoption of a strict collection policy.
bills
EBITDA
TIM Participações posted an EBITDA – earnings before interest, tax,
15%
depreciation and amortization – of R$ 249.2 million for the quarter, versus R$
Increase
in EBITDA 216.0 million in 1Q04. The EBITDA margin was 37.8%, remaining stable
when compared to the 38.1% margin registered in 1Q04.
5
6. Depreciation and Amortization
Depreciation and Amortization in the period amounted to R$ 129.3 million,
versus R$ 112.6 million, a 14.8% increase over 1Q04, resulting from the
expansion and technological innovation of the GSM network.
EBIT
15.9% The EBIT – earnings before interest and tax – was R$ 119.8 million, over the
increase R$ 103.4 million reported in 1Q04. The EBIT margin was 18.2%, remaining
in EBIT stable year over year.
Net Financial Income/Expense
Lower
financial
Our net financial income was R$ 16.5 million in 1Q05, versus R$ 19.0 million
revenue in 1Q04. The average cash allotted for financial investments during the
quarter decreased by 8.3%, and the interest rate (CDI) declined 1.4 p.p. when
compared to 1Q04.
Net Income
16,7% The consolidated net income was R$ 84.3 million, 16.7% above 1Q04, mainly
increment as a result of the increased operational income.
in net
income
Indebtedness
On March 31, 2005, our indebtedness amounted to R$ 78.5 million, of which
54% were short-term debts. The net cash by period end was R$ 609.5
million.
Investments
1Q05 investments totaled R$ 48.6 million, mostly for the expansion of the
GSM network quality and capacity, compared to R$ 54.4 million in the 1Q04.
xxxxxxxxxxxxxxxxxxxxxxxxxxxxxxxxxxx
6
7. “This press release contains forward-looking statements and estimates. Such
expectations are based on a series of assumptions, and subject to the risks and
uncertainties inherent to forward-looking projections and/or estimates. The results
may differ materially from the expectations expressed in the forward-looking
statements or estimates if one or more of the assumptions and expectations prove
to be incorrect or are not realized.”
List of Attachments
Attachment 1: Balance Sheet (BR GAAP)
Attachment 2: Statement of Income (BR GAAP) –
Attachment 3: Operating Indicators – South Region
Attachment 4: Operating Indicators – Northeast Region
Attachment 5: Consolidated Operating Indicators – TIM Participações
Attachment 6: Glossary
7
8. Attachment 1
TIM PARTICIPAÇÕES S.A.
Balance Sheet (BR GAAP – R$ thousands)
March/05 March/04
ASSETS 3,394,924 3,137,700
Current assets 1,585,738 1,512,125
Cash and cash equivalents 687,940 743,504
Accounts receivable 582,102 460,353
Inventories 36,787 41,077
Dividends and interest on shareholders' equity recoverable
- -
Taxes and contributions recoverable 85,646 102,297
Deferred income and social contribution taxes 119,717 111,542
Other current assets 73,546 53,352
Noncurrent assets 239,956 258,903
Related parties 10,368 851
Taxes and contributions recoverable 49,876 25,228
Deferred income and social contribution taxes 143,991 213,839
Judicial deposits 34,407 18,374
Outros direitos 1,294 611
Permanent assets 1,569,230 1,366,672
Investments 9,495 11,077
Fixed assets 1,559,735 1,355,595
Difered - -
LIABILITIES AND SHAREHOLDERS' EQUITY 3,394,904 3,137,700
Current liabilities 777,466 723,366
Concessions payable 11,456 39,947
Loans and financing 42,481 72,377
Suppliers 420,960 343,866
Salaries and related charges 22,894 19,024
Taxes, charges and contributions 123,561 117,215
Related parties 36,535 14,243
Dividends and interest on shareholders' equity payable 102,880 100,190
Other current liabilities 16,699 16,504
Noncurrent liabilities 88,246 131,049
Loans and financing 35,985 55,223
Taxes, charges and contributions 22,403 50,127
Provision for contingencies 26,161 21,966
Supplementary pension plan 3,697 3,733
Other obligations - -
Minority interests 415,069 395,343
NET EQUITY 2,114,123 1,887,942
Capital 1,000,046 687,411
Especial reserves 240,634 292,917
Income reserve 779,827 828,238
Net Income 93,616 79,376
The Complete Financial Statements, including the Notes thereto, are available on our Website:
www.timpartri.com.br
8
9. Attachment 2
TIM PARTICIPAÇÕES S.A.
Statement of Income – EBITDA (BR GAAP in R$ thousands)
1Q05 1Q04 Var. %
1Q05/04
Gross Revenues 882,893 750,405 17.7%
Telecommunications Services 752,425 647,755 16,2%
Monthly fee 71,795 95,757 -25.0%
Usage 392,306 319,547 22.8%
Interconnection 224,554 200,994 11.7%
VAS 48,599 21,446 126.6%
Leased lines 12,505 6,303 98.4%
Others 2,666 3,708 -28.1%
Handset sales and other revenues 130,468 102,650 27.1%
Handset Sales 130,468 102,650 27.1%
Discounts and deductions (223,873) (182,741) 22.5%
Taxes and discounts on services (177,513) (151,837) 16.9%
Taxes and discounts on handset sales (46,360) (30,904) 50.0%
Net Revenues 659,020 567,663 16.1%
Services 574,912 495,918 15.9%
Handset and other revenues 84,108 71,745 17.2%
Operating Expenses (409,853) (351,667) 16.5%
Personal expenses (27,914) (26,882) 3.8%
Selling & marketing expenses (116,888) (85,843) 36.1%
Network & interconnection (114,951) (91,834) 25.2%
G&A (26,431) (22,826) 15.8%
COGS - Telecom products (95,861) (89,023) 7.7%
Bad Debt (25,163) (34,282) -26.6%
Other operational revenues (expenses) 2,645 (977) -370.7%
EBITDA 249,167 215,996 15.4%
EBITDA - Margin over total net revenues 37,8% 38,1% -0.3 p.p.
Depreciation (92,668) (81,980) 13.0%
Amortization (36,687) (30,614) 19.8%
EBIT 119,812 103,402 15.9%
EBIT - Margin over total net revenues 18,2% 18,2% 0 p.p.
Other non-operational revenues (expenses) 333 0 -
Equity
Net Financial Results 16,483 19,012 -13.3%
Financial expenses (15,247) (13,913) 9.6%
Variações cambiais, líquidas (808) (1,429) -43.5%
Financial income 32,538 34,354 -5.3%
Net income before taxes and Minorities 136,328 122,414 11.4%
Income tax and social contribution (32,957) (31,603) 4.3%
Minority interest (19,382) (18,566) 4.4%
Interest on own capital reversion
Net Income 84,289 72,245 16.7%
The Complete Financial Statements, including the Notes thereto, are available on our Website:
www.timpartri.com.br
9
10. Attachment 3
Operating Indicators in the South Region
1Q05 1Q04 Var. %
1Q05/04
Estimated Population in the Region (million) 15.8 15.7 0.6%
Municipalities Served - GSM 299 114 162.3%
Estimated Total Penetration 42% 27% +15.0 p.p.
Market Share 47.0% 52.0% -5.0 p.p.
Total Lines 3,153,234 2,192,072 43.8%
Prepaid 2,479,862 1,636,793 51.5%
Postpaid 673,372 555,279 21.3%
Gross Additions 345,545 260,130 32.8%
Net Additions 162,982 136,188 19.7%
Churn 6.1% 5.9% +0.2 p.p.
TOTAL ARPU R$31.3 R$38.3 -18.3%
TOTAL MOU 70 91 -23.4%
Investment (R$ million) 24.4 43.1 -43.4%
Employees 1,139 1,012 12,5%
Attachment 4
Operating Indicators in the Northeast Region
1Q05 1Q04 Var, %
1Q05/04
Estimated Population in the Region (million) 28.7 28.3 1.4%
Municipalities Served 310 81 282.7%
Estimated Total Penetration 24.5% 17.3% + 7 p.p.
Market Share 39.7% 46.1% - 6.3 p.p.
Total Lines 2,790,618 2,262,823 23.3%
Prepaid 2,096,556 1,557,743 34.6%
Postpaid 694,062 705,080 -
-1.6%
Gross Additions 263,304 177,368 48.5%
Net Additions 124,272 90,298 37.6%
Churn 5.1% 3.9% 1.2 p.p.
TOTAL ARPU R$29,4 R$34,1 -13.8%
-
TOTAL MOU 88 101 -
-12.9%
Investment (million) 24.2 11.3 114.2%
Employees 1,031 1,033 -
-0.2%
_________________________________________________________________________________
10
11. Attachment 5
Consolidated Operating Indicators– TIM Participações S.A.
1Q05 1Q04 Var. %
1Q05/04
Estimated Population in the Region (million) 44.5 44.0 1.3%
Municipalities Served - GSM 609 195 212.3%
Estimated Total Penetration 31% 21% +10.0 p.p.
Market Share 43.3% 48.8% -5.5 p.p.
Total Lines 5,943,852 4,454,895 33.4%
Prepaid 4,576,418 3,194,536 43.3%
Postpaid 1,367,434 1,260,359 8.5%
Gross Additions 608,849 437,498 39.2%
Net Additions 287,254 226,486 26.8%
Churn 5.6% 4.9% + 0.7 p.p.
TOTAL ARPU
R$30.4 R$36.1 -15.9%
TOTAL MOU 78 97 -19.6%
Investment (R$ million) 48.6 54.4 -10.6%
Employees 2,170 2,045 6.1%
Attachment 6
Glossary
Operating indicators
Financial Terms
Customers = Number of wireless lines in service
EBIT = Earnings before interest and tax
Gross additions = Total of customers acquired in the
EBITDA = Earnings before interest, tax, depreciation and
period
amortization
Net additions = Gross Additions – number of customers
EBITDA Margin = EBITDA/ Net Operating Revenue
disconnected
CAPEX – (capital expenditure) capital investment
Market share = Company’s total number of customers /
Subsidy = (net revenue from goods – cost of sales + vendors
number of customers in its operating area
discounts) / gross additions
Marginal Market share = participation of estimated net
Net debt = gross debt – cash
additions in the operating area.
PL – Shareholders’ Equity
Market penetration = Company’s total number of
customers + estimated number of customers of
competitors / each 100 inhabitants in the Company’s
Technology and Services operating area
Churn rate = number of customers disconnected in the
TDMA = Time Division Multiple Access period
GSM = Global System for Mobile Communications – A system ARP U = Average Revenue per User – net monthly
storing and coding cell phone data, such as user calls and revenue per customers in the period
data, enabling a user to be recognized any where in the Blended ARPU = ARPU of the total customer base
country by the GSM network. The GSM is now the standard (contract + prepaid)
most used in the world. Contract ARPU = ARPU of contract service customers
EDGE = Enhanced Data rates for Global E volution – A Prepaid ARPU = ARPU of prepaid service customers
technique developed to increase the speed of data MOU = minutes of use – monthly average. in minutes of
transmission via cell phone, creating a real broadband for traffic per customer = (Total number of outgoing minutes +
handsets with the GSM technology. The first EDGE handsets incoming minutes) / monthly average of customers in the
available offer speeds that can reach up to 200 Kbps, period
depending on the handset model. Contract MOU = MOU of contract service customers
SMS = Short Message Service – ability to send and receive Prepaid MOU = MOU of prepaid service customers
alphanumerical messages. SAC = Customer acquisition cost = (marketing expenses
+ commission + Fistel + “comodato” + costs of retention)
11