TIM Participações Announces 13.9% Revenue Growth in 3Q05
•
0 likes•296 views

- TIM Participações S.A. announced its results for the third quarter of 2005, with revenue growth of 13.6% compared to the third quarter of 2004. - The company's client base reached 6.9 million, a 34.5% increase over the last twelve months. 58% of clients used GSM technology. - Net service revenue totaled R$613.9 million, a 13.9% growth over the third quarter of 2004. EBITDA reached R$255.2 million, up 9.4% compared to the third quarter of 2004.

Recommended
More Related Content
What's hot
What's hot (14)
Viewers also liked
Viewers also liked (20)
Similar to TIM Participações Announces 13.9% Revenue Growth in 3Q05
Similar to TIM Participações Announces 13.9% Revenue Growth in 3Q05 (20)
More from TIM RI
More from TIM RI (20)
TIM Participações Announces 13.9% Revenue Growth in 3Q05
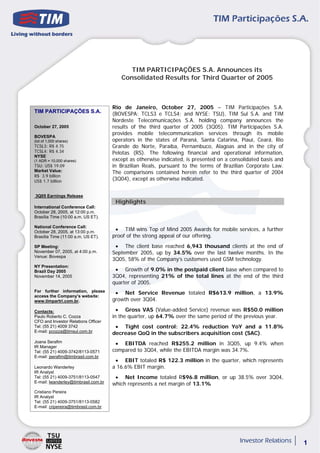
- 1. TIM PARTICIPAÇÕES S.A. Announces its Consolidated Results for Third Quarter of 2005 Rio de Janeiro, October 27, 2005 – TIM Participações S.A. TIM PARTICIPAÇÕES S.A. (BOVESPA: TCLS3 e TCLS4; and NYSE: TSU), TIM Sul S.A. and TIM Nordeste Telecomunicações S.A. holding company announces the October 27, 2005 results of the third quarter of 2005 (3Q05). TIM Participações S.A. provides mobile telecommunication services through its mobile BOVESPA (lot of 1,000 shares) operators in the states of Paraná, Santa Catarina, Piauí, Ceará, Rio TCSL3: R$ 4.75 Grande do Norte, Paraíba, Pernambuco, Alagoas and in the city of TCSL4: R$ 4.34 Pelotas (RS). The following financial and operational information, NYSE (1 ADR = 10,000 shares) except as otherwise indicated, is presented on a consolidated basis and TSU: US$ 19.09 in Brazilian Reals, pursuant to the terms of Brazilian Corporate Law. Market Value: The comparisons contained herein refer to the third quarter of 2004 R$ 3.9 billion US$ 1.7 billion (3Q04), except as otherwise indicated. 3Q05 Earnings Release Highlights International Conference Call: October 28, 2005, at 12:00 p.m. Brasília Time (10:00 a.m. US ET). National Conference Call: October 28, 2005, at 13:00 p.m. • TIM wins Top of Mind 2005 Awards for mobile services, a further Brasília Time (11:00 a.m. US ET). proof of the strong appeal of our offering. SP Meeting: • The client base reached 6,943 thousand clients at the end of November 07, 2005, at 4:00 p.m. September 2005, up by 34.5% over the last twelve months. In the Venue: Bovespa 3Q05, 58% of the Company’s customers used GSM technology. NY Presentation: Brazil Day 2005 • Growth of 9.0% in the postpaid client base when compared to November 14, 2005 3Q04, representing 21% of the total lines at the end of the third quarter of 2005. For further information, please • Net Service Revenue totaled R$613.9 million, a 13.9% access the Company’s website: www.timpartri.com.br. growth over 3Q04. Contacts: • Gross VAS (Value-added Service) revenue was R$50.0 million Paulo Roberto C. Cozza in the quarter, up 64.7% over the same period of the previous year. CFO and Investor Relations Officer Tel: (55 21) 4009 3742 • Tight cost control: 22.4% reduction YoY and a 11.8% E-mail: pcozza@timsul.com.br decrease QoQ in the subscribers acquisition cost (SAC). Joana Serafim • EBITDA reached R$255.2 million in 3Q05, up 9.4% when IR Manager Tel: (55 21) 4009-3742/8113-0571 compared to 3Q04, while the EBITDA margin was 34.7%. E-mail: jserafim@timbrasil.com.br • EBIT totaled R$ 122.3 million in the quarter, which represents Leonardo Wanderley a 16.6% EBIT margin. IR Analyst Tel: (55 21) 4009-3751/8113-0547 • Net Income totaled R$96.8 million, or up 38.5% over 3Q04, E-mail: lwanderley@timbrasil.com.br which represents a net margin of 13.1% Cristiano Pereira IR Analyst Tel: (55 21) 4009-3751/8113-0582 E-mail: cripereira@timbrasil.com.br 1
- 2. Management Message In September, 2005, national subscribers in Brazil reached 79.9 million users, a 5.9% expansion over the previous quarter, which represents a 43.37% penetration. This data, provided by Anatel, shows that the mobile telephony market is still quite buoyant. Notwithstanding the strong competitive environment, we have maintained our leadership position in the regions where we operate, as a result of our segmented and customized relationship with our clients. We understand that our success is based on the importance we attach to the client and, therefore, we have implemented further tools to improve the contact and relations with our subscribers. This scenario has enabled us to achieve profitable growth. In the quarter, our total net revenue grew by 13.6%, despite the discontinuation of the long distance service. EBITDA increased 9.4% and the EBITDA margin over net revenue was 34.7%, while service EBITDA margin reached 43.6%. Our net income reached R$96.8 million, totaling R$254.2 million in the first nine months of 2005. The underlying principles of the Company’s policies and philosophy are, evolution and steady technological follow-up and fulfillment of the market and clients’ needs, by always developing new services and offers, prioritizing profitability and, therefore, continue adding value for our shareholders. The Management 2
- 3. Strong Brand and Differentiated Offers TIM Participações closed the quarter with the highest customer Top of Mind satisfaction rates in its regions according to a national quality research, which has 2005 been carried out every two month by a recognized institution. TIM was awarded the "Top of Mind 2005", for being the first Mobile Telecommunications Company that came to the mind of the people polled by “Data Folha de São Paulo”. This award substantiates the success of our products and the quality of our services. The quarter was marked by a strong increment in sales, and the campaigns Competitive offers and targeted mostly the commemorative date of the period: "Father’s Day". The Services marketing strategy continues focused on customer acquisition, in particular high- value customers - the main postpaid growth-driver in 2005 -, as well as retaining the loyalty of current users. In the quarter, we expanded the "TIM Brasil" service portfolio, comprising nation-wide plans aimed at acquiring high-value customers. We highlighted the launching of the "Nosso Grupo" plan, a package including local calls, intragroup calls, “TIM Box Vip calls”, “TIM Connect” and “TIM Wap”. The VAS portfolio was expanded with corporate and consumer solutions, such as "Mega TIM 200 Torpedos" and "Mega TIM Mania". "TIM Fast Edge" was enhanced, thereby making internet navigation from laptops easier with EDGE technology. We also offered "TIM Light 40", which was a great success with postpaid customers, and "TIM + 25", catering to high-value prepaid customers. Operating Performance Sharp By the end of the quarter, the total penetration – including both the penetration Northeastern and Southern Regions - was estimated at 37.6% - 12.4 p.p. increase over 3Q04 -, below the national average penetration of 43.4%, showing potential for growth in the regional market, in which TIM Participações benefited through its unique service portfolio. Strong TIM Participações client base has reached 6,943,313 subscribers by the end growth of of 3Q05, a 34.5% and 7.0% expansion over 3Q04 and 2Q05, respectively. As a result the client the Company market share remained almost stable, now standing at 41.3% base compared to 41.9% in the 2Q05. 3
- 4. With reference to the customer mix, the postpaid segment grew by 9.0% in the 3Q05 compared to 3Q04, bringing the participation of postpaid clients to 21% of the The highest total lines - the highest mix in the market. postpaid mix The quarter has presented the second highest level of net additions in 2005 with 453,231 new clients, 26.5% higher than the 358,263 additions registered in 3Q04. This growth is a consequence of TIM Participações’ strong position in the markets where it operates. Client Base (Thousands) 21% 6,943.3 6,490.1 5,943.9 5,656.6 5,160.9 42% 48% 57% 64% 75% 58% 43% 52% 36% 25% 3Q04 4Q04 1Q05 2Q05 3Q05 GSM TDMA By the end of the quarter, 58% of TIM Participações’ clients used GSM Fast technology – 4,050,202 clients, representing 68% and 48% of the client base in the expansion of Southern and Northeastern regions, respectively. During the quarter the Company the GSM experienced 126.8 thousand TDMA to GSM migrations, totaling 419.1 thousand base migrations since the beginning of the year. The GSM coverage in the TIM Participações’ region reached 630 cities by the end of the third quarter of 2005, serving to 86.8% of the urban population. Cities covered by the GSM have access to the GPRS, with the additional benefit of the EDGE technology across the South and part of Northeast Region. These innovations facilitated the use of data and multimedia services by customers all over Brazil. The scenario of strong growth and fierce competition, resulted in a churn rate of 6.4% in the quarter (or 2.1% per month), 1.0 p.p. higher than the churn rates registered in the 3Q04, although still below the Brazilian average. 4
- 5. Economic-Financial Development In light of the corporate restructuring that occurred on August 30, 2004, pro-forma financial statements were elaborated for the same quarter of the previous year (3Q04) in order to enable TIM Participações S.A.’s economic-financial appraisal, on a comparable basis. (R$ Thousands) % 3Q05 2Q05 3Q04 % Y-o-Y % Q-o-Q 9M05 9M04 9M Total Gross Revenue 986,450 960,705 870,825 13.3% 2.7% 2,830,048 2,427,588 16.6% Gross Service Revenue 796,834 764,946 707,305 12.7% 4.2% 2,314,205 2,009,389 15.2% Gross Handset Revenue 189,616 195,759 163,521 16.0% -3.1% 515,843 418,199 23.3% Total Net Revenue 736,113 719,400 647,981 13.6% 2.3% 2,114,532 1,816,929 16.4% Net Services Revenue 613,901 585,282 538,799 13.9% 4.9% 1,774,095 1,530,129 15.9% Net Handsets Sales 122,212 134,118 109,181 11.9% -8.9% 340,437 286,800 18.7% EBITDA 255,150 210,672 233,314 9.4% 21.1% 714,991 625,431 14.3% EBITDA Margin 34.7% 29.3% 36.0% -1.3 p.p. 5.4 p.p. 33.8% 34.4% -0.6 p.p. EBIT 122,333 79,130 112,870 8.4% 54.6% 321,277 271,176 18.5% EBIT Margin 16.6% 11.0% 17.4% -0.8 p.p. 5.6 p.p. 15.2% 16.8% -0.1 p.p. Net Income 96,795 73,082 69,912 38.5% 32.4% 254,168 182,563 39.2% Operating Revenue The service gross revenue in 3Q05 totaled R$796.8 million, 12.7% superior to that registered in the same quarter of the previous year. This growth is primarily due to the 34.5% expansion of the client base and the 64.7% value added service revenue growth. Mobile The gross handsets revenue in the quarter was R$ 189.6 million, a 16.0% telephone increase over 3Q04, a result of the increase in mobile telephone sales. In the 3Q05, sales record 688.2 thousand mobile telephones were sold, an increase of 52% compared to 452.4 thousand in the 3Q04. It is important to mention that among the handsets sold in the quarter, 39% were compatible with GPRS technology. The most-sold models were those enabled with MMS (41%), JAVA (32%) and Camera (22%), indicating that customers are demanding more sophisticated handsets. 5
- 6. Hence, total gross revenue in 3Q05 was R$986.5 million, 13.3% higher than in 3Q04. Total revenue net of taxes and discounts was R$736.1 million, surpassing by 13.6%, the figure posted in 3Q04. ARPU: The average revenue per user (ARPU) in 3Q05 was R$27.86, with a slight - new revenue reduction compared to 2Q05 (R$29.70), mainly due to the great volume of net breakdown additions registered in the period (+453,231). The decrease in comparison to the - Prepaid 3Q04 (R$34.40), results basically from the large growth of the total client base and expansion YOY from the discontinuation of the international and national long-distance services in 2005. Operational Costs and Expenses Reduction of In 3Q05, the network and interconnection cost totaled R$ 111.9 million, net work and 2.7% below the R$ 115.0 million registered in 3Q04, primarily due to the non- interconnection occurrence of the costs related to long distance services with the interruption of costs these services as of early 2005, which was greatly offset by the growth of outgoing revenues. The cost of goods sold reached R$134.7 million, 7.9% superior to the R$ 124.9 million in the 3Q04. This increase is primarily due to the 52% growth in the mobile telephone sold. It is important to point out that even within the competitive environment; the Company has maintained mobile telephone prices above the market’s average. Commercial expenses in the quarter (excluding depreciation/amortization Sale Record in 2005: / bad debt and personnel) totaled R$144.0 million, 33.2% superior to those - 872 thousand posted in 3Q04, primarily due to the strong sales growth in the period with gross gross additions addition of 872,142 clients in the quarter, versus 625,151 clients in 3Q04, a growth of 39.5%. The figure posted in this quarter represents a record for the Company in a single quarter. The sales increase in the period leveraged especially variable expenses related to commissions and the FISTEL rate - charged by ANATEL at each new activation and over the total base. In 3Q05, these expenses reached R$65.0 million and R$31.7 million, respectively. SAC: The subscribers acquisition cost (SAC) of the quarter reached R$106.9, Reduction of which represents a 22% reduction over the R$137.8 posted in 3Q04. This decrease 22% in 3Q05 is a result of the Company’s rational market strategy in the acquisition of new clients, versus 3Q04 which have benefited from the appreciation of the Brazilian Real against the U.S. Dollar and the lower average prices of mobile telephones. 6
- 7. General and administrative expenses (G&A) - excluding depreciation/amortization and personnel expenses – totaled R$ 26.2 million, 23.5% lower than in 3Q04. Two factors are related to this expense behavior: a) Reduction in the IT equipment maintenance costs in the 3Q05; and b) In 3Q04 non-recurring expenses related to the ownership restructuring process, with the incorporation of Tele Nordeste by the Company. Personnel expenses and costs totaled R$33.0 million– 19.5% higher than those registered in the 3Q04. This increase was mainly due to non-recurring expenses related to the network maintenance staff, which is in the process of being outsourced. In the 3Q05, bad debt expenses totaled R$24.3 million, increasing as a Update of bad debt provision percentage of total gross revenues from 1.7% in the 3Q04 to 2.5% in the 3Q05. The criteria increase is especially due to the adoption of more conservative criteria for the establishment of the bad debt provision, taking into account the strong growth in postpaid customers. It is worth pointing out that all these procedures aim to maintain the quality of our client base. EBITDA TIM Participações reported an increase of 9.4% in EBITDA (earnings before interest, taxes, depreciation and amortization) or R$255.2 million in the quarter, compared to R$233.3 million in 3Q04. This is proof that despite the competitive scenario and record gross additions in the quarter, the Company has achieved profitable growth. (R$ Thousands) EBITDA Reconciliation 3Q05 3Q04 9M05 9M04 Net Profit 96,795 69,912 254,166 182,563 (-) Provision for Income Tax and Social Contribution 37,202 42,082 97,472 87,160 (+/-) Non-Operational Results 7,593 (550) 1,833 4,193 (+/-) Minorities Interest - 19,250 21,464 46,574 (-) Net Financial Results 19,257 17,823 53,658 49,315 EBIT 122,333 112,870 321,277 271,176 (-) Amortization and Depretiation 132,817 120,444 393,714 354,255 EBITDA 255,150 233,314 714,991 625,431 Margin EBITDA margin was 34.7%, up 5.4 p.p. over 2Q05 margin. The service increase EBITDA margin, excluding handsets revenue and costs was 43.6%, 3.1 p.p. QoQ higher than in 2Q05. 7
- 8. EBITDA (R$ million) .p. 37.8% up 5.4 p 36.0% 34.9% 34.7% 29.3% 260.8 249.2 255.2 233.3 210.7 3Q04 4Q04 1Q05 2Q05 3Q05 EBITDA EBITDA Margin Depreciation and Amortization Depreciation and amortization in the period was R$132.8 million, versus R$120.4 million, an increase of 10.3% over 3Q04, in line with the Company’s 10.6% fixed asset growth in the last year, resulting mainly from the technological expansion and innovation of the network. EBIT EBIT – earnings before interest and taxes – was R$122.3 million, compared to R$112.9 million in 3Q04. EBIT Margin was 16.6%, 5.6 p.p. over the EBIT Margin registered in 2Q05; on a annual basis the EBIT margin was 0.8 p.p. lower compared to the 3Q04, mainly due to higher depreciation and amortization charges. Net Financial Result TIM Participações net financial result in 3Q05 was a positive R$19.3 million, an 8.0% increase over the positive R$17.8 million posted in the same period of 2004. 8
- 9. Net Income Operating Consolidated net income was R$96.8 million, up 38.5% and 32.4% over Result 3Q04 and 2Q05, respectively, representing a 13.1% net margin. Accumulated Expansion income by the end of September totaled R$254.2 million, representing earnings per share of R$0.29 per lot of 1,000 shares and earnings per ADR of R$2.90 per ADR (10,000 shares). Net Income (R$ Million) + 38.5% 96.8 83.4 84.3 69.9 73.1 3Q04 4Q04 1Q05 2Q05 3Q05 Indebtedness In September, 2005, the Company’s indebtedness amounted to R$135.7 million – 82% of the long-term compared to R$ 101.8 million reported at the end of 3Q04. Total indebtedness, including Loans and Financings from BNDES and Banco do Nordeste, has been offset by cash and equivalents, resulting in a R$ 746.0 million in net cash position. CAPEX In 3Q05, CAPEX equaled R$ 147.9 million, totaling R$336.1 million invested until September 2005, these investments have been basically directed to GSM capacity and quality expansion. Free Cash Flow Positive Free cash The Company generated a operating free cash flow of R$ 143.1 million Flow compared to the negative R$ 16.6 million Cash Flow registered in 3Q04. 9
- 10. Ownership Breakdown On September 30, 2005, the Capital of TIM Participações S.A. was as following: Common % Preferred % Total % TIM Brasil Serviços e Participações S.A. 150,804,603,591 50.33% 24,053,370,461 4.15% 174,857,974,052 19.88% ADR - 337,323,781,484 58.16% 337,323,781,484 38.35% Local Float 148,806,027,477 49.67% 218,588,704,147 37.69% 367,394,731,624 41.77% Total 299,610,631,068 100.00% 579,965,856,092 100.00% 879,576,487,160 100.00% Quarter Events Network Use (VU-M) Fare Increase From June 12 to July 17, 2005, TIM Participações entered into an agreement with operators in its operation area and implemented a temporary increase of 4.5% in network use (VU-M) for local calls between the operators Companies. In the Southern Region, VU-M was up from R$0.37635 to R$0.39328, while in the Northeastern region it increased from R$0.38701 to R$0.40442, net of taxes. Success in the Legal Dispute referring to ICMS Convênio 69/98 In 3Q05, TIM Sul S.A. subsidiary won the legal dispute related to VAT (Value-Added Tax) in Parana State, referred to as ICMS Convenio 69/98. Therefore, the R$ 9.7 million amount, paid as Judicial Deposits, has been returned to the Company and accounted for in its cash-line. 10
- 11. Outlook for the Next Quarter For the end of the year, despite expectations of fiercer competition, TIM Participações will keep its focus on profitable growth. In the fourth quarter, the Company expects to maintain its current levels of net additions. The Company estimated that the average revenue per user (ARPU) should remain reasonably stable per segment profile. Investment approved for 2005 was R$561.8 million, and the Company foresees achieving this goal by the end of the year. This topic may contain forward-looking statements. Such statements are not Disclaimer statements of historical facts, and reflect the beliefs and expectations of the Company's management. The words "anticipates”, "believes”, "estimates”, "expects”, "forecasts”, "plans”, "predicts”, "projects”, "targets" and similar words are intended to identify these statements, which necessarily involve known and unknown risks and uncertainties forecasted by the Company. Therefore, Company’s future operational results may differ from current expectations and whose read this release shall not based his/hers assumptions exclusively in the information herein stated. Forward- looking statements speak only as of the date they are made, and the Company does not undertake any obligation to update them in light of new information or future developments. About TIM Participações S.A. TIM Participações S.A. is the holding company of TIM Sul S.A. and TIM Nordeste Telecomunicações S.A., the mobile telecommunication operators that provides mobile telephony services in the states of Paraná, Santa Catarina, Piauí, Ceará, Rio Grande do Norte, Paraíba, Pernambuco, Alagoas and in the city of Pelotas, in the State of Rio Grande do Sul, an area containing 44.8 million inhabitants. TIM Participações is cont rolled by TIM Brasil Serviços e Participações S.A., a Brazilian subsidiary of Telecom Italia Group, the only company authorized to operate mobile communications throughout Brazil. TIM Participações offers GSM technology, Global System for Mobile Communications, the most widely used in the world. At the end of September 2005, its network covered 630 cities and served 86.8% of the urban population. The cities covered by the GSM Network also have access to the GPRS and EDGE technologies. These are innovations that facilitate the use of data and multimedia services across the country. The Company boasts one of the widest services and product portfolios, offering solutions tailored to specific needs. TIM is the most widely known brand in both regions, and has been “Top of Mind” since the Company started its operations. 11
- 12. List of Attachments Attachment 1: Balance Sheet (BR GAAP) Attachment 2: Income Statement (BR GAAP) Attachment 3: Cash Flow Statements (BR GAAP) Attachment 4: Operational Indicators– Southern Region Attachment 5: Operational Indicators- Northeastern Region Attachment 6: Consolidated Operational Indicators– TIM Participações Attachment 7: Glossary 12
- 13. Attachment 1 TIM PARTICIPAÇÕES S.A. Balance Sheet under the Corporate Law (R$ Thousands) DESCRIPTION September 05 July 05 % ASSETS 3,716,706 3,512,457 5.8% - - CURRENT ASSETS 1,876,243 1,685,482 11.3% Cash and cash equivalents 881,673 738,535 19.4% Accounts receivable 690,721 645,880 6.9% Inventories 50,779 37,662 34.8% Recoverable Taxes 91,497 94,684 -3.4% Deferred income and social contribution taxes 129,855 119,745 8.4% Other current assets 31,718 48,976 -35.2% NON CURRENT ASSETS 226,424 238,542 -5.1% Related parties 21,651 10,270 110.8% Recoverable Taxes 63,020 60,482 4.2% Deferred income and social contribution taxes 107,125 126,456 -15.3% Judicial deposits 25,989 35,102 -26.0% Other 8,639 6,232 38.6% PERMANENT ASSETS 1,614,039 1,588,433 1.6% Investments 8,704 9,100 -4.4% Property, plant and equipment 1,605,335 1,579,333 1.6% LIABILITIES 3,716,706 3,512,457 5.8% CURRENT LIABILITIES 833,932 737,760 13.0% Trade accounts payable 8,741 11,569 -24.4% Loans and financing 24,370 44,226 -44.9% Suppliers 570,917 447,320 27.6% Salaries and related charges 27,312 22,373 22.1% Taxes, charges and contributions 121,477 118,267 2.7% Related parties 41,447 51,629 -19.7% Payable dividends and interest on shareholders' equity 19,714 23,084 -14.6% Other 19,954 19,292 3.4% NON CURRENT LIABILITIES 157,033 164,039 -4.3% Loans and financing 111,321 116,652 -4.6% Trade accounts payable 2,860 - N.A. Taxes, charges and contributions 11,634 16,634 -30.1% Provision for contingencies 27,521 27,056 1.7% Supplementary pension plan 3,697 3,697 0.0% MINORITY INTEREST - - - SHAREHOLDERS' EQUITY 2,725,741 2,610,658 4.4% Capital 1,472,075 1,472,075 0.0% Capital reserves 192,081 185,680 3.4% Income reserves 779,827 779,827 0.0% Net Profit 281,758 173,076 62.8% The complete Financial Statements, including its Explanatory Notes are available on the Website: www.timpartri.com.br 13
- 14. Attachment 2 TIM PARTICIPAÇÕES S.A. Results (BR GAAP – R$ Thousands) DESCRIPTION 3Q05 3Q04 % 9M05 9M04 YTD % Gross Revenues 986,450 870,825 13.3% 2,830,048 2,427,588 16.6% Telecommunications Services 796,834 707,305 12.7% 2,314,205 2,009,389 15.2% Core 730,625 667,593 9.4% 2,117,653 1,908,982 10.9% VAS 50,013 30,361 64.7% 153,005 77,477 97.5% Others 16,196 9,352 73.2% 43,547 22,930 89.9% Handset sales and other revenues 189,616 163,521 16.0% 515,843 418,199 23.3% Handset Sales 189,616 163,521 16.0% 515,843 418,199 23.3% Discounts and deductions -250,337 -222,845 12.3% -715,516 -610,660 17.2% Taxes and discounts on services -182,933 -168,505 8.6% -540,110 -479,261 12.7% Taxes and discounts on handset sales -67,404 -54,340 24.0% -175,405 -131,399 33.5% Net Revenues 736,113 647,981 13.6% 2,114,532 1,816,929 16.4% Services 613,901 538,799 13.9% 1,774,095 1,530,129 15.9% Handset and other revenues 122,212 109,181 11.9% 340,437 286,800 18.7% Operating Expenses -480,963 -414,667 16.0% -1,399,541 -1,191,498 17.5% Personal expenses -32,999 -27,619 19.5% -92,043 -84,608 8.8% Selling & marketing expenses -144,043 -108,068 33.3% -396,618 -295,969 34.0% Network & interconnection -111,870 -115,021 -2.7% -334,607 -307,771 8.7% G&A -26,231 -34,274 -23.5% -85,313 -83,512 2.2% Cost Of Goods and Service -134,715 -124,888 7.9% -388,788 -350,886 10.8% Bad Debt -24,317 -14,968 62.5% -90,226 -82,457 9.4% Other operational revenues (expenses) -6,787 10,171 N.A. -11,946 13,703 N.A. EBITDA 255,150 233,314 9.4% 714,991 625,431 14.3% EBITDA - Margin over total net revenues 34.7% 36.0% -1.3 p.p 33.8% 34.4% -0.6 p.p Depreciation -93,773 -85,549 9.6% -279,887 -254,269 10.1% Amortization -39,043 -34,895 11.9% -113,827 -99,986 13.8% EBIT 122,333 112,870 8.4% 321,277 271,176 18.5% EBIT - Margin over total net revenues 16.6% 17.4% -0.8 p.p 15.2% 14.9% 0.3 p.p Other non-operational revenues (expenses) -7,593 550 N.A. -1,833 -4,193 -56.3% Net Financial Results 19,257 17,823 8.0% 53,658 49,315 8.8% Financial expenses -23,088 -16,000 44.3% -53,692 -47,236 13.7% Net exchange variance -670 -853 -21.4% -2,086 -3,010 -30.7% Financial income 43,015 34,676 24.0% 109,436 99,561 9.9% Net income before taxes and Minorities 133,997 131,244 2.1% 373,102 316,297 18.0% Income tax and social contribution -37,202 -42,082 -11.6% -97,472 -87,160 11.8% Minority interest - -19,250 N.A. -21,464 -46,574 -53.9% Net Income 96,795 69,912 38.5% 254,166 182,563 39.2% The complete Financial Statements, including its Explanatory Notes are available on the Website: www.timpartri.com.br 14
- 15. Attachment 3 TIM PARTICIPAÇÕES S.A. Cash Flow Statements (BR GAAP – R$ Thousands) Consolidated 3Q05 9M Operating Activities Net income 96,795 254,166 Adjustments to reconcile net income cash Depreciation and amortization 120,207 355,879 Minority interest - 21,464 Monetary and foreign exchange variations on loans 1,767 5,457 Others (27) 1,787 Chages in operating assets and liabilities 97,905 (211,543) Net cash provided by operating activities 316,647 427,210 Investing Activities Capital increase - Stock options - 2,006 Computation of capital reserve 6,401 6,401 Capital expenditure (147,949) (336,115) (141,548) (327,708) Financing Activities New loans - 85,319 Loan repayments (30,755) (66,677) Dividends and interest on shareholders equity (1,206) (92,803) (31,961) (74,161) Increase in cash and cash equivalents 143,138 25,341 Cash and cash equivalent at the end of the period 881,673 881,673 Cash and cash equivalent at the beggining of the period (738,535) (856,332) 15
- 16. Attachment 4 Operational Indicators for the Northeastern Region Var. % Var.% Var. % 3Q05 2Q05 3Q04 9M05 9M04 Q-o-Q Y-o-Y 9M Estimated Population in the Region (million) 28.8 28.8 28.5 0.1% 1.0% 28.8 28.5 1.0% Municipalities Served - GSM 329 316 218 4.1% 50.9% 329 218 50.9% Estimated Total Penetration 31.3% 28.2% 20.7% 3.0 p.p. 10.5 p.p. 31.3% 20.7% 10.5 p.p. Market Share 37.2% 37.8% 42.8% -0.6 p.p. -5.6 p.p. 37.2% 42.8% -5.6 p.p. Total Lines 3,349,016 3,066,048 2,531,994 9.2% 32.3% 3,349,016 2,531,994 32.3% Prepaid 2,659,202 2,372,341 1,821,583 12.1% 46.0% 2,659,202 1,821,583 46.0% Postpaid 689,814 693,707 710,411 -0.6% -2.9% 689,814 710,411 -2.9% Gross Additions 456,542 401,891 259,232 13.6% 76.1% 1,121,703 659,363 70.1% Net Additions 282,968 275,430 147,148 2.7% 92.3% 682,670 359,469 89.9% Churn 5.6% 4.5% 4.6% 1.1 p.p 1.0 p.p 15.3% 12.9% 2.4 p.p TOTAL ARPU R$25.86 R$28.39 R$34.35 -8.9% -24.7% R$27.89 R$33.49 -16.7% TOTAL MOU 85 87 98 -2.3% -13.4% 87 97 -10.6% Investment (R$ million) 77.1 46.0 84.2 67.6% -8.5% 147.3 146.0 0.9% Employees 1,097 1,026 1,058 6.9% 3.7% 1,097 1,058 3.7% Attachment 5 Operational Indicators for the South Region Var. % Var.% Var. % 3Q05 2Q05 3Q04 9M05 9M04 Q-o-Q Y-o-Y 9M Estimated Population in the Region (million) 15.9 15.9 15.7 0.2% 1.2% 15.9 15.7 1.2% Municipalities Served - GSM 301 300 279 0.3% 7.9% 301 279 7.9% Estimated Total Penetration 48.9% 46.4% 33.2% 2.5 p.p. 15.7 p.p. 48.9% 33.2% 15.7 p.p. Market Share 46.1% 46.4% 50.2% -0.3 p.p. -4.1 p.p. 46.1% 50.2% -4.1 p.p. Total Lines 3,594,297 3,424,034 2,628,908 5.0% 36.7% 3,594,297 2,628,908 36.7% Prepaid 2,834,016 2,702,877 2,008,556 4.9% 41.1% 2,834,016 2,008,556 41.1% Postpaid 760,281 721,157 620,352 5.4% 22.6% 760,281 620,352 22.6% Gross Additions 415,600 439,492 365,919 -5.4% 13.6% 1,200,637 997,572 20.4% Net Additions 170,263 270,800 211,115 -37.1% -19.4% 604,045 573,024 5.4% Churn 7.1% 5.3% 6.1% 1.8 p.p 1.0 p.p 18.5% 18.4% 0.1 p.p TOTAL ARPU R$29.69 R$30.86 R$34.50 -3.8% -14.0% R$31.18 R$35.99 -13.3% TOTAL MOU 72 64 82 13.6% -11.8% 72 86 -16.1% Investment (R$ million) 70.9 93.6 107.0 -24.3% -33.8% 188.8 221.0 -14.6% Employees 1,244 1,220 1,059 2.0% 17.5% 1,244 1,059 17.5% Attachment 6 Operational Indicators Consolidated Data – TIM Participações S.A. Var. % Var.% Var. % 3Q05 2Q05 3Q04 9M05 9M04 Q-o-Q Y-o-Y 9M Estimated Population in the Region (million) 44.8 44.6 44.3 0.4% 1.1% 44.8 44.3 1.1% Municipalities Served - GSM 630 616 587 2.3% 7.3% 630 587 7.3% Estimated Total Penetration 37.6% 34.7% 25.2% 2.9 p.p. 12.4 p.p. 37.6% 25.2% 12.4 p.p. Market Share 41.3% 41.9% 46.3% -0.6 p.p. -5.0 p.p. 41.3% 46.3% -5.0 p.p. Total Lines 6,943,313 6,490,082 5,160,902 7.0% 34.5% 6,943,313 5,160,902 34.5% Prepaid 5,493,218 5,075,218 3,830,139 8.2% 43.4% 5,493,218 3,830,139 43.4% Postpaid 1,450,095 1,414,864 1,330,763 2.5% 9.0% 1,450,095 1,330,763 9.0% Gross Additions 872,142 841,383 625,151 3.7% 39.5% 2,322,340 1,656,935 40.2% Net Additions 453,231 546,230 358,263 -17.0% 26.5% 1,286,715 932,493 38.0% Churn 6.4% 4.9% 5.4% 1.5 p.p 1.0 p.p 17.0% 15.6% 1.4 p.p TOTAL ARPU R$27.86 R$29.70 R$34.40 -6.2% -19.0% R$29.63 R$34.76 -14.8% TOTAL MOU 78 79 90 -1.0% -13.2% 79 91 -13.5% Investment (R$ million) 147.9 139.6 191.2 6.0% -22.6% 336.1 367.0 -8.4% Employees 2,341 2,246 2,117 4.2% 10.6% 2,341 2,117 10.6% 16
- 17. Attachment 7 Glossary Operating indicators Financial Terms Customers = Number of wireless lines in service EBIT = Earnings before interest and tax Gross additions = Total of customers acquired in the EBITDA = Earnings before interest, tax, depreciation and period amortization Net additions = Gross Additions – number of customers EBITDA Margin = EBITDA/ Net Operating Revenue disconnected CAP EX – (capital expenditure) capital investment Market share = Company’s total number of customers / Subsidy = (net revenue from goods – cost of sales + vendors number of customers in its operating area discounts) / gross additions Marginal Market share = participation of estimated net Net debt = gross debt – cash additions in the operating area. PL – Shareholders’ Equity Market penetration = Company’s total number of customers + estimated number of customers of competitors / each 100 inhabitants in the Company’s Technology and Services operating area Churn rate = number of customers disconnected in the TDMA = Time Division Multiple Access period GSM = Global System for Mobile Communications – A system ARP U = Average Revenue per User – net monthly storing and coding cell phone data, such as user calls and revenue per customers in the period data, enabling a user to be recognized any where in the Blended ARPU = ARPU of the total customer base country by the GSM network. The GSM is now the standard (contract + prepaid) most used in the world. Contract ARPU = ARPU of contract service customers EDGE = Enhanced Data rates for Global E volution – A Prepaid ARPU = ARPU of prepaid service customers technique developed to increase the speed of data MOU = minutes of use – monthly average. in minutes of transmission via cell phone, creating a real broadband for traffic per customer = (Total number of outgoing minutes + handsets with the GSM technology. The first EDGE handsets incoming minutes) / monthly average of customers in the available offer speeds that can reach up to 200 Kbps, period depending on the handset model. Contract MOU = MOU of contract service customers SMS = Short Message Service – ability to send and receive Prepaid MOU = MOU of prepaid service customers alphanumerical messages. SAC = Customer acquisition cost = (marketing expenses + commission + Fistel + “comodato” + costs of retention) xxxxxxxxxxxxxxxxxxxxxxxxxxxxxxxxxxxxxxxxx This press release may contain forward-looking statements. Such statements are not statements of historical facts, and reflect the beliefs and expectations of the Company's management. The words "anticipates”, "believes”, "estimates”, "expects”, "forecasts”, "plans”, "predicts”, "projects”, "targets" and similar words are intended to identify these statements, which necessarily involve known and unknown risks and uncertainties forecasted by the Company. Therefore, Company’s future operational results may differ from current expectations and whose read this release shall not based his/hers assumptions exclusively in the information herein stated. Forward-looking statements speak only as of the date they are made, and the Company does not undertake any obligation to update them in light of new information or future developments. 17