Improving science (communication) through data visualizationZachary Labe
Creating visuals of data is an important part of our jobs as scientists. We use figures for journal publications, presentations, posters, lab group meetings, science communication, and more. In this workshop, we'll use examples from climate science to discuss a framework and network of resources available for making accessible figures. I will also share examples of what not to do and how to improve these figures moving forward.
Improving scientific graphics of climate (change) dataZachary Labe
Creating visuals of data is a critical part of our jobs as scientists. We use figures for journal publications, presentations, posters, and science communication. This week we'll discuss a framework for making better figures, particularly in the climate sciences. I will also give examples of what not to do, and how we can improve these figures moving forward. e
Coleen Vogel - An inconvenient truth - the Hell Niño in south africaSTEPS Centre
Workshop on climate change and uncertainty from below and above, Delhi. http://steps-centre.org/2016/blog/climate-change-and-uncertainty-from-above-and-below/
ASSAR - Adaptation at scale in semi-arid regionsSTEPS Centre
Workshop on climate change and uncertainty from below and above, Delhi. http://steps-centre.org/2016/blog/climate-change-and-uncertainty-from-above-and-below/
Presented by Vladimir Smakhtin at the National Workshop on “Use of Space Based Information for Disaster Management” Colombo, Sri Lanka, November 17, 2014.
S Ramage GEO UN-GGIM HLF Mexico Nov 2017Steven Ramage
Considerations around geospatial approaches for working on the UN 2030 Agenda for sustainable development, including links between different SDGs, civil society participation and standards.
The Visual Framing of the Three Cycles of Climate Control in The New York Tim...Jason Lee Thompson
This research explored the visual framing of climate control in The New York Times
through three cycles of media history. Although no peer-reviewed study has explored this
specific topic, a wealth of prior communication articles on both the visual and textual aspects of
climate change and geoengineering in the media was mined in order to discover the frames
present. Once the visual frames of climate control (war, fix, people, and impacts) were revealed a
content analysis was conducted in order to see which frame elements were most and least
frequent considering the images of climate control. When combining all three cycles the frame
with the highest overall mean was the fix frame (M=1.7517, SD=1.34128) indicating that it is the
most occurring climate control frame per image. The frame with the lowest overall mean was the
war frame (M=.5137, SD=1.02544). Frame frequency from cycle to cycle was relatively constant
since only the impacts frame had a significant mean difference between cycle one and cycle two
(M= .72453, p= .042). This initial analysis did not provide support for Downs issue-attention
cycle theory. Although when the frame element frequencies were graphed three spikes were
separated by three valleys considering climate control imagery in The New York Times through
iv
about one and half centuries. This information can go towards making correlations with: events,
exposure to certain stimuli, and judging effectiveness of communication strategies over time.
The discussion considered whether currently the war and fix frames could be too small in order
to produce effective communication with a distrustful public. Also the recent people frame
increase correlates with non-acceptance regarding climate change considering Republicans.
Presentation on Aerosols, cloud properties Esayas Meresa
This slide was prepared for the course Applications of GIS and RS for water resources in Mekelle University, Institute of Geo-information and earth observation Science(I-GEOS) by Mr. Esayas Meresa.
This is the 7th lesson the course - Climate Change & Global Environment taught at the Faculty of Social Sciences and Humanities of the Rajarata University of Sri Lanka
A series of visualizations to stimulate thinking about climate change. Using UKCP09 high emissions projections and a variety of scenes from Gloucestershire and the Cotswolds.
6. Climate science as body of knowledgeAdam Briggle
The sixth lecture in the philosophy of climate change. It covers ten basic points about climate science, offers one note of caution, and distills two key implications.
Geosystem Approach: El Nino Southern Oscillation EffectsKamlesh Kumar
Earth system as a whole is very complex and dynamic, for that matter we prepare models to represent the functioning linkages and processes for better understanding. However, the geo-systems can not be summed up in just one model. Hence, we use system analysis approach, if we see Earth as a giant system, there're many sub-systems for better comprehension representing only a particular component of the system.
Here, I've tried to cover the geo-system approach siting a globe affecting example of the El Nino Southern Oscillation (ENSO) phenomena.
Responsible research and innovation in a rapidly changing and increasingly te...RRI Tools
Responsible research and innovation in a rapidly changing and increasingly telecoupled world
Barron Joseph Orr
Professor and Geospatial Extension Specialist, University of Alicante & University of Arizona
RRI Tools Final Conference - Brussels, 21-22 November 2016
PLENARY SESSION: Facing the societal challenges of our time
The True Science of Climate Change - October 2023 r7.pdfKeithShotbolt
This Study investigates the greenhouse effect of various gases and the water cycle with associated transfer of latent heat. It concludes that the major cause of climate change is water vapour emitted from vast crop irrigation in semi-arid or desert areas.
The True Science of Climate Change - April 2023 r3.pdfKeith_Shotbolt
This Study reviews the sciences of Earth's atmospheric circulation, the Greenhouse Effect and the Water Cycle. It includes observations by 15 leading authorities, and concludes that increased atmospheric water vapour from crop irrigation is by far the main cause of observed changes to climate. Increased atmospheric carbon dioxide, still less than 1 part in 2,000 (0.05%), has had no identifiable influence on world temperatures, polar sea ice extents, and glaciers.
Remote sensing of the environment and Earth observation sciences are relatively young research domains that are highly interdisciplinary, combining expertise in biology, ecology, geography, physics, and computing science. Combining data from space-based and airborne sensors with traditional field observations provides powerful insights on how different ecosystems function and what drives changes in them at a global scale. With the turn of the 21st century we have seen a major expansion of our Earth observation capabilities with hundreds of new satellite systems in orbit around our planet and a myriad of new environmental sensor systems at the surface keeping an eye on how our planet is changing and how those changes influence our societies.
This presentation reviews the basics of remote sensing of vegetation biophysics for ecology and environmental monitoring and explores in greater depth how we can use these new technologies to better understand how more sensitive ecosystems respond to global change forces and can act as canaries in the coal mine for the early detection of climate change risks. I will also discuss how our research capabilities in this field are changing with the start-up of commercial aerospace agencies, the ever-decreasing size and cost of consumer electronics, and the emergence of affordable unmanned aerial vehicles, or ‘drones’.
Dynamics in the History and Economic Development of Man: Refocusing on Ecolog...AEIJjournal2
Man’s history and development endeavours have beenadvancing alongside a trail of ecological
ramifications and climate change. Since prehistoric times, scientists have not recorded an accelerated shift
in the ecologyof the planet during any other epoch beside that of modern man. The paper seeks to explore
how man’s history and developmentaffects ecologyand climate. It uses desk analysis to recollect data from
global assessment reportsand runs a One paired Sample Means t-Test, 1 tailed, 8 df, at Pearson
Correlation value 0.458 and 0.5 alpha level. Findings show that, there is globalclimate change, seen in
global warming trends; andimbalance in ecological footprint, seen in depletion of air, water and land
sinks. The t-Test reveals significant net loss of global forest cover.The study also,apparently found that,
processes ofdevelopment generally tend to damage ecology. Therefore,the study recommends a refocus to
sustainable means of development.
DYNAMICS IN THE HISTORY AND ECONOMIC DEVELOPMENT OF MAN: REFOCUSING ON ECOLOG...AEIJjournal2
Man’s history and development endeavours have beenadvancing alongside a trail of ecological
ramifications and climate change. Since prehistoric times, scientists have not recorded an accelerated shift
in the ecologyof the planet during any other epoch beside that of modern man. The paper seeks to explore
how man’s history and developmentaffects ecologyand climate. It uses desk analysis to recollect data from
global assessment reportsand runs a One paired Sample Means t-Test, 1 tailed, 8 df, at Pearson
Correlation value 0.458 and 0.5 alpha level. Findings show that, there is globalclimate change, seen in
global warming trends; andimbalance in ecological footprint, seen in depletion of air, water and land
sinks. The t-Test reveals significant net loss of global forest cover.The study also,apparently found that,
processes ofdevelopment generally tend to damage ecology. Therefore,the study recommends a refocus to
sustainable means of development.
GraphRAG is All You need? LLM & Knowledge GraphGuy Korland
Guy Korland, CEO and Co-founder of FalkorDB, will review two articles on the integration of language models with knowledge graphs.
1. Unifying Large Language Models and Knowledge Graphs: A Roadmap.
https://arxiv.org/abs/2306.08302
2. Microsoft Research's GraphRAG paper and a review paper on various uses of knowledge graphs:
https://www.microsoft.com/en-us/research/blog/graphrag-unlocking-llm-discovery-on-narrative-private-data/
Transcript: Selling digital books in 2024: Insights from industry leaders - T...BookNet Canada
The publishing industry has been selling digital audiobooks and ebooks for over a decade and has found its groove. What’s changed? What has stayed the same? Where do we go from here? Join a group of leading sales peers from across the industry for a conversation about the lessons learned since the popularization of digital books, best practices, digital book supply chain management, and more.
Link to video recording: https://bnctechforum.ca/sessions/selling-digital-books-in-2024-insights-from-industry-leaders/
Presented by BookNet Canada on May 28, 2024, with support from the Department of Canadian Heritage.
Slack (or Teams) Automation for Bonterra Impact Management (fka Social Soluti...Jeffrey Haguewood
Sidekick Solutions uses Bonterra Impact Management (fka Social Solutions Apricot) and automation solutions to integrate data for business workflows.
We believe integration and automation are essential to user experience and the promise of efficient work through technology. Automation is the critical ingredient to realizing that full vision. We develop integration products and services for Bonterra Case Management software to support the deployment of automations for a variety of use cases.
This video focuses on the notifications, alerts, and approval requests using Slack for Bonterra Impact Management. The solutions covered in this webinar can also be deployed for Microsoft Teams.
Interested in deploying notification automations for Bonterra Impact Management? Contact us at sales@sidekicksolutionsllc.com to discuss next steps.
UiPath Test Automation using UiPath Test Suite series, part 4DianaGray10
Welcome to UiPath Test Automation using UiPath Test Suite series part 4. In this session, we will cover Test Manager overview along with SAP heatmap.
The UiPath Test Manager overview with SAP heatmap webinar offers a concise yet comprehensive exploration of the role of a Test Manager within SAP environments, coupled with the utilization of heatmaps for effective testing strategies.
Participants will gain insights into the responsibilities, challenges, and best practices associated with test management in SAP projects. Additionally, the webinar delves into the significance of heatmaps as a visual aid for identifying testing priorities, areas of risk, and resource allocation within SAP landscapes. Through this session, attendees can expect to enhance their understanding of test management principles while learning practical approaches to optimize testing processes in SAP environments using heatmap visualization techniques
What will you get from this session?
1. Insights into SAP testing best practices
2. Heatmap utilization for testing
3. Optimization of testing processes
4. Demo
Topics covered:
Execution from the test manager
Orchestrator execution result
Defect reporting
SAP heatmap example with demo
Speaker:
Deepak Rai, Automation Practice Lead, Boundaryless Group and UiPath MVP
Search and Society: Reimagining Information Access for Radical FuturesBhaskar Mitra
The field of Information retrieval (IR) is currently undergoing a transformative shift, at least partly due to the emerging applications of generative AI to information access. In this talk, we will deliberate on the sociotechnical implications of generative AI for information access. We will argue that there is both a critical necessity and an exciting opportunity for the IR community to re-center our research agendas on societal needs while dismantling the artificial separation between the work on fairness, accountability, transparency, and ethics in IR and the rest of IR research. Instead of adopting a reactionary strategy of trying to mitigate potential social harms from emerging technologies, the community should aim to proactively set the research agenda for the kinds of systems we should build inspired by diverse explicitly stated sociotechnical imaginaries. The sociotechnical imaginaries that underpin the design and development of information access technologies needs to be explicitly articulated, and we need to develop theories of change in context of these diverse perspectives. Our guiding future imaginaries must be informed by other academic fields, such as democratic theory and critical theory, and should be co-developed with social science scholars, legal scholars, civil rights and social justice activists, and artists, among others.
Dev Dives: Train smarter, not harder – active learning and UiPath LLMs for do...UiPathCommunity
💥 Speed, accuracy, and scaling – discover the superpowers of GenAI in action with UiPath Document Understanding and Communications Mining™:
See how to accelerate model training and optimize model performance with active learning
Learn about the latest enhancements to out-of-the-box document processing – with little to no training required
Get an exclusive demo of the new family of UiPath LLMs – GenAI models specialized for processing different types of documents and messages
This is a hands-on session specifically designed for automation developers and AI enthusiasts seeking to enhance their knowledge in leveraging the latest intelligent document processing capabilities offered by UiPath.
Speakers:
👨🏫 Andras Palfi, Senior Product Manager, UiPath
👩🏫 Lenka Dulovicova, Product Program Manager, UiPath
Accelerate your Kubernetes clusters with Varnish CachingThijs Feryn
A presentation about the usage and availability of Varnish on Kubernetes. This talk explores the capabilities of Varnish caching and shows how to use the Varnish Helm chart to deploy it to Kubernetes.
This presentation was delivered at K8SUG Singapore. See https://feryn.eu/presentations/accelerate-your-kubernetes-clusters-with-varnish-caching-k8sug-singapore-28-2024 for more details.
GDG Cloud Southlake #33: Boule & Rebala: Effective AppSec in SDLC using Deplo...James Anderson
Effective Application Security in Software Delivery lifecycle using Deployment Firewall and DBOM
The modern software delivery process (or the CI/CD process) includes many tools, distributed teams, open-source code, and cloud platforms. Constant focus on speed to release software to market, along with the traditional slow and manual security checks has caused gaps in continuous security as an important piece in the software supply chain. Today organizations feel more susceptible to external and internal cyber threats due to the vast attack surface in their applications supply chain and the lack of end-to-end governance and risk management.
The software team must secure its software delivery process to avoid vulnerability and security breaches. This needs to be achieved with existing tool chains and without extensive rework of the delivery processes. This talk will present strategies and techniques for providing visibility into the true risk of the existing vulnerabilities, preventing the introduction of security issues in the software, resolving vulnerabilities in production environments quickly, and capturing the deployment bill of materials (DBOM).
Speakers:
Bob Boule
Robert Boule is a technology enthusiast with PASSION for technology and making things work along with a knack for helping others understand how things work. He comes with around 20 years of solution engineering experience in application security, software continuous delivery, and SaaS platforms. He is known for his dynamic presentations in CI/CD and application security integrated in software delivery lifecycle.
Gopinath Rebala
Gopinath Rebala is the CTO of OpsMx, where he has overall responsibility for the machine learning and data processing architectures for Secure Software Delivery. Gopi also has a strong connection with our customers, leading design and architecture for strategic implementations. Gopi is a frequent speaker and well-known leader in continuous delivery and integrating security into software delivery.
LF Energy Webinar: Electrical Grid Modelling and Simulation Through PowSyBl -...DanBrown980551
Do you want to learn how to model and simulate an electrical network from scratch in under an hour?
Then welcome to this PowSyBl workshop, hosted by Rte, the French Transmission System Operator (TSO)!
During the webinar, you will discover the PowSyBl ecosystem as well as handle and study an electrical network through an interactive Python notebook.
PowSyBl is an open source project hosted by LF Energy, which offers a comprehensive set of features for electrical grid modelling and simulation. Among other advanced features, PowSyBl provides:
- A fully editable and extendable library for grid component modelling;
- Visualization tools to display your network;
- Grid simulation tools, such as power flows, security analyses (with or without remedial actions) and sensitivity analyses;
The framework is mostly written in Java, with a Python binding so that Python developers can access PowSyBl functionalities as well.
What you will learn during the webinar:
- For beginners: discover PowSyBl's functionalities through a quick general presentation and the notebook, without needing any expert coding skills;
- For advanced developers: master the skills to efficiently apply PowSyBl functionalities to your real-world scenarios.
LF Energy Webinar: Electrical Grid Modelling and Simulation Through PowSyBl -...
Environment and climate: The space perspective - Simonetta Cheli
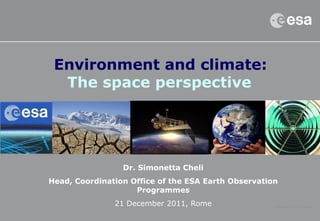
1. Environment and climate:
The space perspective
Dr. Simonetta Cheli
Head, Coordination Office of the ESA Earth Observation
Programmes
21 December 2011, Rome
2. Point of departure: Earth from space
• Called a “fragile oasis”,
Earth is our home with
finite resources
• Powered by the Sun
• Newly “discovered” with
the advent of the space age
3. The human race: ever growing
• According to the UN
Population Reference
Bureau, the world’s
population is reaching the
new milestone of 7 Billion
in October 2011
• The speed of growth is
alarming, with estimated 9
Billion by mid-century
4. The human footprint: not just a metaphor
Credit: University of Heidelberg
Example 1: The global distribution of NO2 as an indicator of atmospheric pollution.
Data are based on observations from Envisat. Correlation with human settlements
and (industrial) activity.
5. The human footprint: not just a metaphor
Example 2: Artificial surface patterns as result of human land use for agriculture /
food production (Phoenix, Arizona; and Imperial Valley [USA]).
6. The human footprint: not just a metaphor
Credit: University of Sheffield
Example 3: Traces of human activity in hostile environments – soil irrigation in the
southern Sahara as seen by the Envisat mission (detail).
8. The vantage of outer space
Credit: University of Sheffield
The advantage of satellite
observations from space:
Perpetual observations
Global coverage
Short revisit cycles and long-term
data sets
“Accessibility” through over-flight
Newest measurement technologies
International cooperation
9. In orbit: ESA Earth Observation missions
17 missions in space by
2015
More than 4000 projects
worldwide use their
data – increasing
further
More than 100 Terabyte
of data per year
30 partner missions
10. The discovery of the “System Earth”:
Earth systems science
Earth system science
seeks to integrate various
fields of scientific study to
understand the Earth as a
system.
It considers interaction
between the atmosphere,
hydrosphere, lithosphere
(geosphere), biosphere,
and cryosphere.
11. The IPCC Report 2007
– a 3.4°C increase in annual temperature (up to
3.7°C in spring), and
– a 23% decrease in winter rainfall, and
– a 13% decrease in spring rainfall
Precipitation: decrease in arid
regions and increase in wet areas
Storms: significantly stronger
Sea level rise: up to 48cm until 2100
Global temperature increase between
+ 2.4 and 6.4 degrees until 2100
Point of departure: A changing
environment
Surface air temperature anomalies
for southern Africa until 2100
Africa: Predictions for the southern
African region (averaged):
12. GMES: Global Monitoring for Environment &
Security
Flagship programme of EU and ESA:
European independency and contribution
to GEO
The Sentinel-Satellites and partner missions
will provide long-term space observations
7 satellite launches between 2013 and 2015
Services for a multitude of users and benefits
for all European citizens & beyond
EC discusses extension of GMES Africa
Open and Free Data Policy planned
13. The work of science
communities and ESA
for 11 selected ECVs
has started
ESA is coordinating
the programme at
international level, e.g.
with EUMETSAT and
EU
The Climate Change
Summits in
Copenhagen &
Cancun have
underlined the
importance of this
activity
The “ESA Climate Change Initiative”
Surface temperature changes based on natural forcings only (blue) or
natural and anthropogenic forcings (pink); observation average (black)
Source: IPCC 2007
14. UN Development Goals
Water: the “ blue gold” of
the 21st
century
The geopolitics of climate
change: stability, security
of supply
Access to and use of
energy
From global warming to
global warring
Climate Change: a threat to security –
demanding better preparedness
15. Climate Change and Security: an inherent link
Climate variations influence:
agricultural productivity
resource availability
health risk
migration patterns
and ultimately
conflict level of societies
* ‘2500 Years of European Climate Variability and Human
Susceptibility’, Büntgen et al., Science, 2011
16. A recent study in NATURE (Hsiang et al., Aug. 2011) found that in El Nino years,
twice as many civil wars occurred on global level, suggesting that there is a link
between climatic developments and societal stress levels.
Civil conflicts and climate: an association
17. Example: The Dafur Crisis – assistance from
orbit
• Satellite maps and geographical information
products directly for users in the field
• Use of ten sensors from nine spacecraft
• Envisat's ASAR identifies roads, shows land
relief and is sensitive to the presence of water
• Maps are produced within 10-12 hours of
satellite image acquisition
• Information is supplied to NGOs to intervene
more effectively
18. Conclusions
Spaceship Earth: not only a metaphor
Climate and environmental variations
have a fundamental impact on how we
live, behave and plan our actions
Worsening conditions lead to stress on
societies
Space technologies help to assess the
state of the planet and understand its
functioning
Space applications help the sustainable
management of food and water resources
and to release stress on societies
19. ESRIN – the ESA centre in Italy
Some 30.000 visitors per year
and a wealth of international
scientific conferences
642 staff and contractors are
working on site
– Earth Observation
– Vega Department
– Corporate Informatics
– Telecommunications
– Contracts, Site, Personnel,
Communication
– ASI Science Data Centre
– ESA Security Office