SlideShare a Scribd company logo
1 of 24
Download to read offline
Advanced Energy: An International Journal (AEIJ), Vol. 10, No. 1, January 2023
DOI: 10.5121/aeij.2023.10101 1
DYNAMICS IN THE HISTORY AND ECONOMIC
DEVELOPMENT OF MAN: REFOCUSING ON
ECOLOGICAL DISTURBANCE
AND CLIMATE CHANGE
Mululu Chirwa
Department of Geography and Environmental Studies,
University of Zambia, Lusaka, Zambia
ABSTRACT
Man’s history and development endeavours have beenadvancing alongside a trail of ecological
ramifications and climate change. Since prehistoric times, scientists have not recorded an accelerated shift
in the ecologyof the planet during any other epoch beside that of modern man. The paper seeks to explore
how man’s history and developmentaffects ecologyand climate. It uses desk analysis to recollect data from
global assessment reportsand runs a One paired Sample Means t-Test, 1 tailed, 8 df, at Pearson
Correlation value 0.458 and 0.5 alpha level. Findings show that, there is globalclimate change, seen in
global warming trends; andimbalance in ecological footprint, seen in depletion of air, water and land
sinks. The t-Test reveals significant net loss of global forest cover.The study also,apparently found that,
processes ofdevelopment generally tend to damage ecology. Therefore,the study recommends a refocus to
sustainable means of development.
KEYWORDS
Ecological Footprint, Climate Change, Sustainable Development, Built Environmental, Integrated
Planning
1. BACKGROUND AND INTRODUCTION
From age to age, the evolution of man has been proliferated by significant stages of development.
According to mainstream history, man has long been advancing himself to find better means of
meeting his needs (Arlt and Daviau, 2009). Unlike his earlier days on the planet, man’s
motivation for development is now driven by a plethora of multiple contingencies (Wengrow,
2018). From the pre-Neolithic age when the urge to develop was primarily driven by survival
instinct, today such motivation is also driven by pleasure, luxury, pride, and superiority (Hale,
Ricotta, Freed, Smith, and Huang, 2019). His evolution followed a development path from the
early, middle and late stone age; to the early and late iron age (Muhanna, 2017). From there, it
advanced to the industrial revolution and the Age of computers or Artificial Intelligence (AI)
(Ibid, 2017). Evolution significantly altered the way mankind works, produces, packages, trades,
consumes and disposes, causing negative impact on ecology. The study endeavours to show how
compromised mode of production, consumption and waste disposal projects on the future of the
planet. It systematically analysis how history can teach us a lesson about how mismanagement of
natural resource can jeopardize ecology. It also plots how human development has been
advancing alongside the speedy loss of ecological footprint and exacerbating climate change.
The first part of the paper defines the scope of the study area and outlines the problem statement;
aim; objectives; hypotheses; research questions and rationale of the study. The second, defines
Advanced Energy: An International Journal (AEIJ), Vol. 10, No. 1, January 2023
2
the key concepts and reviews their interplay of each other. The third partoutlines the
methodology of the study indicating the target population, revealing sampling technique and
outlining collected collection/ analysis. The fourth chapter presents and discusses the findings of
the study. The fifth chapter draws the conclusions and makes recommendations about the
findings of the study.
1.1 Scope of the Study Area
The study has taken a global perspective of climate change because, first, the phenomenon can be
established when the multiplicity of variables defining it are gathered across a relatively wide
geographic scale(Harvey, 2018). Second, the matter of climate change is of global implication.
The analysis selects some parts of the world where there are indicators pointing to climate
change.
1.2 Statement of the Problem
Human evolution has seen the development of man from one age to another. Civilization with its
unyielding quest to make life easier made operations easier and speed up processes in raw
material extraction, transport, communication, manufacturing, processing, trading, and the
consumption of goods and services as well as wastedisposal. The industrial revolution of Europe
in the late 1700s came with mass production and with it, mass generation of waste (Clark, 2014).
The unprecedented effects were hazardous -pollution, environmental degradation and climate
change. The consequences of these hazards are unforgiving -global warming, disturbance in
weather patterns, loss of catchment, flooding, heightened frequency of tropical storms, loss of
fresh air and water, outbreak of epidemics and disease, overcrowding in urban centers, sprawl,
urban gentrification and depletion of green spaces (Rymarczyk, 2020). The study seeks to
highlight this predicament in the light of man’s evolution. Although some studies have been done
to show trends in climate change and its ramifications, their still remains much to be exploited
about history’s direct contribution to the matter of climate change and environmental
degradation.
1.3 Aim
The aim of the study is to establish the extent to which human development has contributed to
climate change and the erosion of ecological footprint over the past 500 plus years, and show
how all this has affected quality of life on earth.
1.4 Objectives
i. To explore the dispensations of human civilization over the past five plus centuries
ii. To determine the extent of climate change over the past five plus centuries
iii. To establish the correlation between human development and climate change
iv. To assess the net change in global vegetative cover in a 67 year-period from 1948-2015
v. To ascertain the ecological ramifications of climate change on wildlife and the quality of
human life
1.5 Research Questions
Objective (i)
What are the most important stages of human development in the past 500 years?
Objective (ii)
Advanced Energy: An International Journal (AEIJ), Vol. 10, No. 1, January 2023
3
Has there been climate change on earth within the past 500 years of human history?
Objective (iii)
Is there a correlation between human historical development and climate change?
Objective (v)
What impact has climate change had upon the ecology, biodiversity and quality of human life?
1.6 Hypotheses
Objective (iv)
Ho: There has not beenglobal net loss in forest cover over built environment duringthe 67-year
period from 1948-2015.
H1:There has been global net loss in forest cover over built environment during the 67-year
period from 1948-2015.
1.7 Significance of the Study
The study endeavours to surface information that can contribute to the debate around human
development versus climate change. It assembles data that shows a clearer perspective about the
way human history interweaves into the fabric of ecological transformation and climate change.
Such knowledge can bridge the gap in literature on how human evolution plays a role in the path
of sustainable development. Also, the study can provide global institutions, agencies, and NGOs
with relevant data to help them prepare world trajectories against climate change. Apart from
that, the information gathered can furnish civil engineers in environmental agencies with
grassroot indicators for risk assessment, and to build instruments for measuring ecological
depletion. This way, they can better inform policy. It can also serve as a guide for integrated
planning among urban planners. The historical background of man’s development provides
warning signs against impending doom to communities whose industrial advancement is still
young and vibrant, such as in African and generally -the global south, so that they can avoid
mistakes that more advanced civilizations made in the past.
2. LITERATURE REVIEW
2.1 The Historical Development of Man and Technology
The history of man over the past 500 years can generally bedemarcated into the Neolithic Age,
the Iron Age, the Age of Industrial revolution (Knowledge Explosion), andthe Age of
Computers(Artificial Intelligence) (Scarre and Fagan, 2016). During the Neolithic period, man’s
way of life was simple, with an economy mainly consisting of hunting and gathering on small-
scale primitive subsistent farms(Ibid, 2016).Before BC2000, communities in many parts of the
world except for the Middle East were primarily hunter-gatherers(Muhanna, 2017).Agriculture
had not yet gained ground and settlement infrastructure was basically made up of small grass-
thatched houses made out of mud (Arlt and Daviau, 2009). In the progress of time, populations
grew and the Industrial Revolution began(Clark, 2014).Sources indicate that, it started in Britain
during the 1700s following the explosion of knowledge in science and technology (Xu, David,
and Kim, 2018). With the invention of a powered engine, it was now possible to harvest and
process raw materials in larger quantities (Ibid, 2018). Countries across Europe and overseas
began to industrialize and this came urbanization (Rymarczyk, 2020). According to Rymarczyk,
urbanization came with pressure on settlement because, people needed constant water and food
supply, shelter, education and health facilities, recreation and waste management systems.
Advanced Energy: An International Journal (AEIJ), Vol. 10, No. 1, January 2023
4
From the foregoing, it seems undeniable that the industrial revolution is one of the most
important transition of man’s development and appears to make the greatest impact on
environmental degradation. This is because it came with mass deforestation, draining of marshes,
emission of chlorofluorocarbons (CFCs), and discharge of effluence (Rymarczyk, 2020). All
these resulted in the erosion of green spaces, the loss of biodiversity, drying up of surface water
bodies, lowering of the water table, and pollution in all its forms (Rashid, Irum, Malik, Ashraf,
Rongqiong, Liu, Ullah, Ali and Yousaf, 2018; Jorgenson, 2003). The industrial age has also seen
another advancement in the development of man called the Computer Age. This heightened use
of machine technology in almost all economic sectors has truncated another pressing demand for
energy (Rymarczyk, 2020). The correlation between economic growth and environmental
degradation seems to puzzle even the elite of elites. The dilemma is to reconcile the gap between
advanced communities and those lagging behind by strengthening economies while preserving
ecological footprint for posterity.
2.2 Climate Change
According to Harvey (2018), climate change is the significant change in the overall pattern of
weather defying the long-term pre-existing or natural conditions. Climate prevails over a long
time and rarely changes. Suffice to note that, geological evidence shows that climate has been
changing from epoch to epoch (Singer, 2006). The reasons for such changes are still being
researched. Nevertheless, it is assumed that the modern human race (homo sapiens) and their
associated technology have been on the face of the earth for less than 20 000 years, and 300 years
ago climate change seems to have taken rapid shifts (Labat, Goddéris, Probst and Guyot, 2004).
More robust assessment to unearth the way climate was changing in prehistoric times is being
done to establish whether our contribution to the predicament is significant or not. Nonetheless,
climate change itself is a part of a malfunctional ecosystem attempting to balance itself (Held and
Soden, 2006). This indicates careless manipulation of both the living and non-living environment
which are the sources of natural resources. Such things could have happened in the past, perhaps
as a function of natural terrestrial or extra-terrestrial catastrophe. However, in man’s history, the
age of industry has its fair share of contributing to the predicament. In the meantime, it is phrones
is to act prudently and create a preventive strategy against future calamity. The first step is to
understand the dynamics involved, and for the purpose of the study a historical exegesis of how
human civilization once mishandled can disturb natural ecology has been used to establish such
knowledge.
2.3 Ecological Footprint
The earth is a unit mass of matter found in the dynamic complex of nature governed by universal
laws. It is made up of an environment that functions by a symbiotic balance of living and non-
living organisms. Ecology can basically be described as the interaction between the living and
non-living environment as well as their sub-interaction to create natural balance and continuity
(Rees, 2018). Ecology is a system that constitutes habitat and symbiotic relationships among
organisms. Its footprint spans across the entire earth with an earth-atmosphere system is sustained
by a complex network of interaction between endowments on the earth’s surface and atmospheric
forces (Held, and Soden, 2006). For instance, if vegetative cover is sufficiently eroded, then river
catchment is lost and the rate of evapotranspiration is reduced (Labat, et al., 2004). This in turn
reduces the amount of rainfall received in a catchment. If such a situation is extrapolated across a
broader space, then it significantly transforms the average conditions for smooth interaction in
the earth-atmosphere system. Such global ramifications are due to erosion of the ecological
footprint, which in this case can be defined as, the removal of original/natural resources
(vegetative cover) of the earth.
Advanced Energy: An International Journal (AEIJ), Vol. 10, No. 1, January 2023
5
The world in on a trajectory to find means of striking a balance to cope with the ‘poverty-
environmental degradation’ trap. The most significant strides are seen in the advancement and
implementation of the SDGs (UN-Habitat, 2019). This new trajectory has given birth to fresh
concepts and methods in the field of planning, such as regional integration, inclusivity, mixed
land-use, green building, garden city, and ‘city within a city’ (UN-Habitat, 2022). Therefore,
planners have restructured the concept of planning to suit the growing needto preserve ecology.
And so, land-use planning isreshaping to ensure integrated mixture of both natural and built
environment (Dovey, Shafique, Van Ostrum and Chatterjee, 2021; Ibid, 2022).The study reveals
the conflict between urbanization and ecology preservation.
2.4 Development and Climate Change
Development refers to change of something, in this context, improvement or progress (Klasen,
2018). Man’s development implies advancement in the modus operandi to create capacity for
meeting all of a population’s basic needs (Ibid, 2018). This definition rests upon the bedrock of
optimal and balance of population. Optimal population refers to the sufficiency of a population to
maximize its natural resource for its benefit, while balanced population refers to the ability of
natural resources to sufficiently furnish the population size (Yumashev, Ślusarczyk, Kondrashev,
and Mikhaylov, 2020; Rabie, 2013). While the ratio between population sizeto resource base is
critical, it is the ability of the population to access basic needs of life that really matters. This
involves the transformation of raw materials into products and services and avail them to the
mass of the people (Yumashevet al., 2020; Klasen, 2018). The process of converting raw
materials into finished goods often requires industry. The larger the population, the higher the
demand and consequently the large the industries. If production is deficient, then goods and
services become scarce which leads to inflation. Therefore, a healthy Gross Domestic Product
(GDP) is key for the development of a country (Klasen, 2018).
Also, the mass of the people should have access to these resources which would translate into
favourable Human Development Index(HDI). The index refers to income per capita or the
amount of money that an individual in a country will have to spend for an entire year if all the
resources of the country were equally distributed (Ibid, 2018). This entails that, healthy
economies inherently have individuals within a population sustaining enough buying power to
decently meet all their basic needs and more (Chibuye, 2014). Nonetheless, economic growth
must not override resource repletion and waste management. Otherwise, a growing economy that
lacks resources to sustain it, alongside a contaminated environment compromises quality of life
by brewing depravity, poverty, sickness and disease, hunger and starvation, and even death. For
civilizations that have continued on the trajectory of economic development negating
environmental concerns, the ravages of climate change have come with unforgiving
consequences.
2.5 Climate Change and its Ramifications on Quality of Life
Climate change has a telling impact upon the quality of both human and non-human life. The
most obvious effects of climate change are witnessed in extreme weather, heat waves, tropical
storms, torrential rains, floods, droughts, increased glaciation, and global warming (Bartke,
Forster, Githiri, Jering, Kago, Schlimmer, and Sietchiping, 2021). These outcomes of climate
change have both direct or immediate repercussions as well as indirect and long-range
repercussions, impacting the quality of human life on earth. Quality of human life can be defined
as the measure of access by a person to basic needs (Chibuye, 2014). The most basic of such
needs is safety and security, food and nutrition, fresh water and air, health and descent shelter
(UN-Habitat, 2018). Therefore, it always remains crucial to provide an environment that sustains
the provision of these things. Hidden from the radar of economists and most developers are the
Advanced Energy: An International Journal (AEIJ), Vol. 10, No. 1, January 2023
6
far-reaching damages caused by climate change. For example, climate change can cause heat
waves that result in tropical storms leading todeath (Pieterse, 2010). Meanwhile, the ripple effects
of tropical storms or tsunamis are the floods that sweep across houses causingwater pollution and
consequently water-borne diseases(Nchito, 2007). Also, the torn down infrastructure sometimes
leaves irreparable damage which bites into the economy, while the loss of lives leaves emotional
scars (Vlek and Steg, 2007). Although we may perceive it to be a simple matter, the underlying
reality is that, what really enablesany organism to exist is its host (environment) (Ndebele-
Murisa, Mubaya, Pretorius, Mamombe, Iipinge, Nchito, Mfune, Siame, and Mwalukanga, 2020).
3. METHODOLOGY
3.1 Research Design and Approach
The study is a desk analysis that surveyed data from a relatively large number of places in the
world. Since the study sought to cover a wider geography, the desk analysis was more ideal
(Bostley, 2019). The study recollected data from remote sensing surveys done by the
ForestResource Assessment (FRA) (FRA, 2020). These were extracted from photo interpretation
of a global sample of high-resolution imagery through a worldwide network of national experts.
The surveys involved the use of modern remote sensing tools and methods. The study approach
was a mixed method. Quantitatively, the study recollected large quantities of geospatial images,
and therefore used the count of hexagonal pixels obtained from Landsat and Sentinel Mosaics.
The recollected geospatial images were captured and measured by surveyors from the National
Research Council(NRC) and the areal cover of ecology and trends in climate change was
recorded year after year (NRC: 2015.Data on forest cover, was analysed using statistical testing.
Meanwhile, qualitatively, the study explored data recollected from field surveys done by the FRA
via interviews of indigenous people in several countries across the globe.
3.2 Sampling Technique
The sample is drawn from a population of spaces mapped out of a global grid of equal area
hexagons documented by the FRA. A stratified random sampling technique was used by the
agency to conduct the survey and reduce uncertainty of the forest area change estimates. The
technique was based on eighty (80) strata derived using a combination of twenty (20) Global
Ecological Zones for categories of change in the cover of trees. The map under assessment hada
total of about 430 000 remote sensing samples of hexagons covering 40 hectares and centroid
spreading across 1 hectare from all over the world. Purposive sampling was used by the FRA to
select indigenous people for interviews across several countries. Also, countries were selected
based on evident disproportionate removal of forest cover or widespread built environment. Apart
from these, the study also purposively sampled timeline analysis graphs and images from the
NRC showing global trends in the change of climate. The graphs were selected based on the
climatic index they were projecting and its significant contribution to the nature of climate and
ecology. In this wise temperature, land, ocean, air, and vegetation sinks were part of the
variables.
3.3 Data collection instrument
The data was collected through carefully reading the Global Forest Resource Assessment report
prepared by the FRA from the early 1700s upto the year 2020. The assessment was done from the
data obtainedfrom remote sensing and survey. The FRA and NRC conducted remote sensing
through the Collect Online Earth Platform, and Google Earth alongside Bing Maps to collect
auxiliary data. Other modern geospatial tools with improved data entry, data visualization, review
Advanced Energy: An International Journal (AEIJ), Vol. 10, No. 1, January 2023
7
and analysis functions were also usedto collect data, especially from countries where forest
information was limited or not available. The surveys were done via interview of local residents
who were familiar with the geography of the selected countries.Finally,some pictures werealso
recollected from the assessment reports and press releases.
3.4 Data Analysis
The study analysed data from the global assessment reports on change of global forest cover over
the years using a One paired Two Sample Mean t-Test at Pearson correlation 0.458, 1 tailed at 8
degrees of freedom and alpha level 0.5. The other data was interpreted from graphs showing
trends of climate change over the years extrapolated from the global data assessment of
greenhouse gases, temperature, forests, land and water sinks. These were compiled by the NRC
using the Open Floris Collect Earth software tool to visually interpret about 213 000 sample
plots. The Collect Earth tool was also used in the analysis of data to access and display high
resolution images from Google Earth and Bing Maps. The assessment tool also generated grids
through Google Earth Engine, that allowed ready access to Landsat and Modis image archives.
4. FINDINGS OF THE STUDY AND DISCUSSION
4.1 Pre-Historic Times and Climate Change 800, 000 years ago: The Ice Age
Climate change is not a recent phenomenon. In the past epochs, the earth underwent various
phases of climate change. One of the most recent traceable epochs of climate change is the
Miocene epoch within which is encapsulated in the Ice
Age (Rashid et al., 2018). During this epoch when modern human life had not yet evolved, the
earth underwent climate change when global temperatures dropped below the ‘normal’ average.
Temperatures drastically dropped all across the world and this phenomenon resulted in the
freezing of almost all parts of the earthending most life forms(Rashid et al., 2018).One theory
explaining this was the collision of a meteorite into the earth causing ecological catastrophe
(Rashid et al., 2018; Rees, 2018). The other theory, advanced by some geological studies
postulate that, the earth naturally undergoes periodic rise and fall in global temperatures(Rees,
2018).
The graph in figure1 shows the trend of temperature during the Ice Age. One important
observation made by the NRCon climate change during Ice Age and the post-modern climate
change is the vast difference in temperature variation between them. During the Ice Age, after
BC800 000 to around BC100 000, Carbon dioxide (CO2) and temperature levels in the
atmosphere underwent cycles of change every 100 000 years. Each 100000 years division saw a
rise and decline in temperature levels systematically. As the CO2 levels rose, so did the
temperature and the vice versa. The cyclical pattern shows a system of balance in the climatic
patterns separated by a 200 000 years interval. For instance,CO2 levels rose only upto a
maximum threshold of 300parts per billion (ppb) during the entire ice age period and this was the
time when temperatures also rose to a maximum average threshold of about +4o
C. However, after
the Ice Age, CO2 alongside temperature in the atmosphere have been increasing. As at 2010, the
amount of CO2 in the atmosphere was over 390ppb varying from the maximum overage of the
Ice Age by a staggering 90ppb.Compounded to this accumulation of excessCO2 in the
atmosphere is the further addition of other heat retaining gases (CFCs) in the atmosphere such as
Methane (CH4) and Nitrous Oxide (N2O), which together with carbon dioxide are accelerating the
rise of global temperature.
Advanced Energy: An International Journal (AEIJ), Vol. 10, No. 1, January 2023
8
Figure 1. Climate Change during the Ice Age
Source: National Research Council, 2010d
4.2 Important dispensations of human civilization over the past five centuries
From pre-historic times, human civilization has seen the development of technology from the
simple to the complex. The human economy has advanced from hunting and gathering to
agriculture, from agriculture to iron-working, and from Iron-working to the period of knowledge
explosion which ushered in the industrial revolution in the 1700s. Invention during the industrial
revolution gave way to the computer age or the age of artificial intelligence (AI). This series of
indelible advancement in human civilization is shown in table 1.
Table 1.Historic times and human civilization after the ice age
S/N Yearsof
Invention
Age
(Dispensation)
Time-line
(Period)
Human Development
(Civilization)
1 > BC10000 Prehistoric > 10, 000 Hunting &Gathering
2 BC10000s Neolithic 10, 000 – 2, 000 Agriculture& Settlement
3 BC2000s Iron Age 2, 000 – 500 Technology
4 AD1700s Industrial
Revolution
500 – 200 Manufacturing& Urbanization
5 AD1900s Computer Age 200 - date Artificial Intelligence
Source: Adapted by Author, 2022
These dispensations of human civilization have not gone without impacting the trends of global
climatic shift. It may be true that the natural tendency of the earth is to undergo changes in
weather patterns after a certain period. However, the rate at which the changes are happening in
recent times is alarming. The phenomenon also reveals a seeming correlation between human
civilization and climate change.
Advanced Energy: An International Journal (AEIJ), Vol. 10, No. 1, January 2023
9
4.3 Extent of Climate Change during the past three centuries
Findings of the study have also shown that, the reality of climate change has been radically
observed in the past three centuries beginning from the late 1800s to the year 2000. During this
period, there has been a phenomenal rise in global land and ocean temperatures. Temperature
indices on both the land and continental plains have shown a rise such as never been recorded
since pre-historic times. The sharp rise in temperature levels shows a net rise of a +6 score within
only a space of approximately three centuries. The figure 4 shows the trends in the sharp rise of
temperature within the 200 plus years.
Figure 4. Rise in Global Temperatures in the past three centuries
Source: https://nap.nationalacademies.org/read/14673/chapter/2#3
There is still more evidence of global climate change in the world today. For instance, the past
two centuries have seen a rise in the atmospheric concentration of Carbon Dioxide (CO2).
According to the earth system research, there has been a sharp and steady rise in the
concentration of CO2 in the earth’s atmosphere. This means that, CO2 has continued to increase
steadily in the atmosphere since the 1960s as shown in the figure 5.
Advanced Energy: An International Journal (AEIJ), Vol. 10, No. 1, January 2023
10
Figure 5. Rise in Atmospheric CO2 Concentration in the world
Source: National Research Council, 2011a
It is not only the rise in CO2 concentration in the atmosphere but, findings also show that
alongside are two other Chlorofluorocarbon gases that have also sharply risen. These are
Methane (CH4) and Nitrous Oxide (N2O) which, just like CO2 are gases with High Heat
Retention Capacity (HHRC). The diagram in figure 6 shows the trend of the three gases on the
atmosphere for the past 2000 years.
Figure 6.Sharp rise in Atmospheric CO2 CH4, and N2O Concentration in the world from the late 1800s.
Source: National Research Council, 2011a
According to the figure 6, during the past 2000 years in the period from 0AD upto the 1800s, the
concentration of the three gases -CO2, CH4, and N2O was relatively the same. Findings show that,
there was no significant rise. The lab tests reveal that, within the period from 0AD to 1800AD, on
average CO2 only had a concentration range variation of about 15parts per million (ppm), CH4
had a concentration range variation of only about 250ppb, while N2O had a concentration range
variation of only about 15ppb. However, the graph shows that immediately after the late 1800s,
all three gases shot up to levels never seen before. For example, CO2 shot up from its normal
Advanced Energy: An International Journal (AEIJ), Vol. 10, No. 1, January 2023
11
average of 280ppm in the year 1880 to a staggering 380ppm in the year 2000, N2O shot up from
270ppb in 1880 to about 320ppb in the year 2000, meanwhile CH4 shot up from an average of
800ppb in 1880 to a whooping 1950ppm in the year 2000.
It is the margin of variation in concentration of the gases that is alarming. For example, CO2
concentration in the atmosphere stayed the same from 1800 years at an average of only 280ppm
while in the last 200 years it has risen to a maximum average of 380ppm. Also, the variation
between the AD1800 years and last 200 years is disproportionately insurmountable. For instance,
there was minimal range of only 15ppm in the 1800 period but this changed in the last 200 years
to become a range of 100ppm. This produced a net surplus of about 75ppm of atmospheric CO2
concentration within the last 200s year of the past AD2000 years. The same goes for N2O whose
range was also 15ppb within the 1800 years dispensation, but later suddenly shot up to a range of
50ppm, producing a net surplus of 35ppm of N2O concentration in the atmosphere during the last
200 years. Methane equally became more abundant in the atmosphere. From the range of 250ppb
during the AD1800 years to a phenomenal 1,150ppb range variation in the last 200 years,
producing a net surplus of about 900ppbs of CH4 concentration in the atmosphere. This
insurmountable increase in concentration of the three gases in the atmosphere in the past 200
years in comparison to the 1800 years before clearly indicates an abnormality that seems to have
transpired after the late 1800s. It is also interesting to note that this period which marks the sharp
rise in CFC gas concentration coincides with the industrial revolution. The industrial revolution
in Europe began in the late 1700s and by the late 1800s, various factories had spread across most
European countries and CFC gas emission started skyrocketing. As industry and urbanization
gained momentum in human society, so did CFC emission. Therefore, there is a correlation
between human development and climate change embedded in the mutual relationship between
industry and increased emission of CFCs into the atmosphere.
Apart from that, the change in land-use from simplistic Neolithic (agrarian) rural communities to
the complex industrial urban communities, has seen a general depletion of the two most
significant components of the eco-system -land and water. Research has shown that within the
past 200 years, land and water resources have drastically reduced. This has compounded the
problem of CFC emission thus expediting climate change. The figure 7 shows a summary
diagram of how factors combine to produce an atmosphere of increased CFC concentration.
According to the findings, the use of fossil fuels to run industry has significantly changed the use
of land and water. This means that fossil fuel consumption due to industry has reduced land and
ocean sinks. This in turn has resulted in proliferated rise in CFC concentration in the atmosphere
predisposing the earth to global warming and climate change.
Advanced Energy: An International Journal (AEIJ), Vol. 10, No. 1, January 2023
12
Figure 7.Interplay of industry and land-use change in CFC gas atmospheric concentration
Source: National Research Council, 2011a
4.4 Man’s Disturbance of world Ecology and contribution to Climate Change
Unlike in Neolithic times, the advent of industry, has seem mankind grossly disturb several
aspects of ecology and climate. Among the critical elements that mankind has affected in
ecological balance in vegetation cover or more specific -forest cover. The study sought to
uncover the extent to which human activity has removed or replenished forest cover on earth. In
order to establish this, a 67-year period was selected from the year 1948 when more concrete data
on global forest cover was recorded by FAO to the year 2015 when the last consolidated forest
assessment report was released.
4.4.1 A Timeline Ratio of Natural Vegetative Spatial cover against Brown Spaces
In order to comprehend the gravity of the ecological transformation across the globe, it is
imperative to consider the ratio of forest cover relative to how much cover is removed within a
certain period. Such an analysis provides insight into the trends of how deforestation has reduced
forest cover in the progress of time. Finding of the study are shown in the table2 indicating the
trend of global forest cover and how it has been depleting over time.
Advanced Energy: An International Journal (AEIJ), Vol. 10, No. 1, January 2023
13
Table 2. Global Ecological Deficit through a Timeline Ratio of Vegetative Cover against its removal
Year Global Forest
Cover
(Billion Hectares)
Net Global
Forest Change
Annual Net
Change
Global Brown
Spaces
Ecological
Deficit
1948 4.0 - Not
Reported
Unclear Unclear
1953 3.8 -0.2 Not
Reported
Increased Yes
1958 4.4 +1.4 Not
Reported
Decreased No
1963 4.1 -0.3 Not
Reported
Increased Yes
1988 3.6 -0.5 Not
Reported
Increased Yes
1990 3.4 -9.9 Not
Reported
Increased Yes
1995 3.4 -11.3 Not
Reported
Increased Yes
2000 3.8 -9.4 -0.18 Increased Yes
2005 3.8 0 -0.11 Increased Yes
2010 4.0 +0.2 -0.08 Decreased No
2015 3.99 -0.01 -0.08 Increased Yes
Source: FAO Assessment Reports
For the most part, the period from the year 1948 to 2015 has seen a sustained erosion of
vegetation across the globe. The direct inference of this is generally ecological deficit.
Approximately, out of the 10 dispensations observed, 80% of them showed ecological deficit and
only 20% showed surplus. This significant (80%) difference in ecological deficit indicates that,
the world is consuming more of vegetation than it is replenishing. A typical example is about
countries on the African continent which are now exploiting forests at an increasing rate.
According to the FAR (2005), in Africa, overall progress towards sustainable forest management
in the continent appears to have been limited during the last fifteen years. There are some
indications that net loss of forest area has slowed down and that forest areas designated for
conservation of biological diversity has increased slightly. However, the continued, rapid loss of
forest area – the largest of any region in the world during this 15-year period – is particularly
disconcerting. This is a similar story for even other parts of the global south such as India, South
America and some parts of the Middle East.
4.4.2 Net Loss of Global Forest Cover over a 67-year period (1948 to 2015)
There has been a net loss of forest cover between the year 1948 to 2015. This net loss is as a
result of the rate at which forest cover has been eroded and seemingly replaced worldwide. The
trends reveal a pattern of fluctuation in removal and replacement of forest cover. However,
according to the findings of the study from an assessment of past records, the final correlation
yields a negative t-Statistic value of -0.185 which indicates an overall net loss. The table 3 shows
the findings after running a One-tailed, paired Two-Sample Means t-Test which yielded a
significant result. Findings were that the p-value was 0.429 which was less that the Pearson
correlation of 0.458. Also, the t Statistic (-0.185) is less than the t Critical (1.860) at one tail.
Therefore, from the foregoing, the result shows a negative correlation indicating a global net loss
of forest cover in the period between 1948 and 2015.
Advanced Energy: An International Journal (AEIJ), Vol. 10, No. 1, January 2023
14
Table 3. A Paired Two Sample Means t-Test of forest cover from the year 1948-2015
t-Test: Paired Two Sample for
Means
Forest Cover Billion
Hectares
Forest Cover Billion
Hectares
Period of change (years) before after
1948 - 1953 4 3.8
1953 - 1958 3.8 4.4
1958 - 1963 4.4 4.1
1963 - 1988 4.1 3.6
1988 - 1990 3.6 3.4
1990 - 1995 3.4 3.4
1995 - 2000 3.4 3.8
2000 - 2005 3.8 3.8
2005 - 2010 3.8 4
2010 - 2015 4 3.99
Mean 3.81111111 3.83222222
Variance 0.10611111 0.10959444
Observations 9 9
Pearson Correlation 0.4576021
Hypothesized Mean Difference 0
df 8
t Stat -0.1851479
P(T<=t) one-tail 0.42886044
t Critical one-tail 1.85954804
Source: Generated by Author, 2022
Therefore, from the foregoing, the Null Hypothesis (Ho) which states that there is no net loss of
vegetation over built environment in the world between the year 1948 to 2015 is rejected, while
the Alternative Hypothesis (H1) which states that there is a global net loss on forest cover over
built environment between the year 1948 to 2015 is accepted. Consequence, such a significant net
loss ought to be checked, lest the trend continues and the global loss of vegetation cover increases
exponentially with the passage of time. And if this happens, the ramifications of ecological
imbalance will ravage the planet at dangerous levels.
4.5 Global Ramifications of Ecological Disturbance and Climate Change
4.5.1 The Ecological ramifications of Climate Change
The ecological implications of climate change can be seen in the drastic change of average
temperature. Findings reveal that temperatures in the stratosphere have been dropping, while
temperatures in the troposphere have been rising above the normal average. The figure 9 shows
the cooling trends in the stratosphere and the warming trends in the troposphere in the period
between 1960 to 2010. This means that those temperatures in the upper part of the atmosphere are
significantly dropping below the normal. Meanwhile, temperatures in the lower part of the
atmosphere with which we mostly interact are rising to disproportionate levels. The rise of
temperature in the troposphere has led to the predicament called global warming. Generally, all
eco-systems on earth directly interact with the troposphere. Infact, the earth-atmosphere system
Advanced Energy: An International Journal (AEIJ), Vol. 10, No. 1, January 2023
15
basically comprises the land, water, vegetation and all the weather elements of the troposphere.
Therefore, a rise in temperature affects all the aspects of ecology.
An analysis of the collective impact of different factors in the earth-atmosphere system shows a
net effect of human activity as being the largest contributor to global warming. The study
established that there are some factors that influence of cooling and warming of the atmosphere.
Among these factors include the emission of greenhouse gases, depletion of ozone, availability of
water vapor, surface reflexivity, particle and cloud reflexivity. According to the findings,
greenhouse gases emitted largely through human activity (industry and urbanization) is the
greatest contributor to global warming. The gases which mainly include CO2, N2O, and CH4 have
high HRC, and therefore trap heat in the atmosphere. These gases can stay within the atmosphere
for a span of between 10 to 30 years and continue to absorb and contain heat for as long as they
are present.
Figure 9. Cooling and Warming trends in the Atmosphere
Source: National Research Council, 2011a
Apart from the three CFCs aforementioned, other gases such as Carbon Monoxide (CO) and
Sulphur Dioxide (SO2) which are continuously released from mines and manufacturing industries
are largely responsible for the depletion of ozone (O3). These gases tend to split O3 by extracting
an oxide (O) from it so that it becomes oxygen (O2). The findings show that depletion of O3 is
creating increased warming conditions due to increased penetration of Ultra-Violet Radiation
(UVR) and other thermal energy waves into the atmosphere. Water vapor content has also
reduced as temperatures rise further. Surface reflexivity has been affected by two factors with
counteracting effects. For instance, land-use that is now mainly characterized by urban built
environment has greatly increases reflexivity, thereby raising temperatures. Additionally, soot
from carbon which collects on snowflakes reduces reflexivity and generally create warmer
conditions in the atmosphere. The figure 10 shows a summary of the interplay of natural and
human influence upon the balance of the earth-atmosphere system. The figure shows how human
beings are altering the natural course of atmospheric temperature equilibrium. Given a collection
of all the factors at play in the earth-atmosphere system, there interaction has ultimately led to an
energy net gain from both natural influences and human activity. Most importantly human
activity has transcended its impact on global warming against natural factors on a scale of 1: 2.5.
Advanced Energy: An International Journal (AEIJ), Vol. 10, No. 1, January 2023
16
This significant difference in the ratio to which human activity is far exceeding natural influence
in global warming places the
catastrophe of climate change solely upon human beings. The greatest contributor to the earth-
atmospheric ecological imbalance is greenhouse gas emission and these are a direct by-product of
industry and urbanization.
Figure 10.Interaction of natural and human Influence on the average temperature of the atmosphere
Source: National Research Council: 2010d
Apart from the atmospheric part of the earth-atmosphere system, climate change has also
adversely affected the earth part of the system. In this way, the land, water and vegetation
resources have been altered in composition and functionality. For instance, sources indicate that
oceanic potential Hydrogen (pH) has been dropping insurmountably. According to the studies,
between the years 1989 to 2007 the oceanic pH within the depth of about 0-30 meters have
dropped from an average of 8.12 down to about 8.08. This poses a danger not only to aquatic but
terrestrial life as well. Lower pH entails decreased alkaline conditions and increased acidity, a
predicament with high chances of further repercussions on other parts of the environment and
biodiversity. Apart from the decrease in pH, the quantity of seaweed has also been increasing
following the rise of CO2 content in the atmosphere. For instance, studies show that the
consumption of CO2 by seaweed between the year 1989 to 2007 has increased from a volume of
330 units to about 360 units, giving a net excess of 30 units. This scenario if depicted in the
figure 11 showing how seaweed is steadily increasing alongside CO2 and how the oceanic pH is
also decreasing.
Advanced Energy: An International Journal (AEIJ), Vol. 10, No. 1, January 2023
17
Figure 11. Escalating seaweed alongside CO2 and the dropping of oceanic pH
Source: National Research Council: 2010d
The increase in seaweed following increased volume of CO2 means that invasive species are
multiplying at an alarming rate threatening natural species. This entails that aquatic life is
endangered and so are other aspects of vegetation and animal life that survive on aquatic
creatures. This challenge rallies alongside acidity of the water bodies that pose a threat to life in
any of its form that survives at an average pH. The general shift in ecological composition of
different ecosystems is also fast changing biodiversity. Findings also reveal that, subtle shifts in
gaseous composition, pH levels and temperature degrees are resigning the ecological footprint.
The predicament is recreating natural habitation into something unfamiliar to the existing
biodiversity. The current natural environment being suited to the excising conditions are likely to
experience a struggle to adapt to the new changes in ecological construction. This will entail that
other species may emerge that are better suited for the new conditions and this leads to the
development and evolution of foreign/invasive species. It may not be so clear as to what the
foreign species adapted to the new ecology can do but at least some studies have revealed that
most of such species are invasive and terribly harmful to the current species. A typical example if
the black beetle found the Californian forests which has ravaged the vegetation there to the brink
of extinction. The beetle literally feeds on entire branches removing chlorophyl and sucking the
life out the plants. The photo in figure 12 shows how the black beetle has ravaged a forest in
California -USA.
Figure 12. How the invasive Black Beatle has ravaged a forest in California
Source: National Research Council: 2010d
Advanced Energy: An International Journal (AEIJ), Vol. 10, No. 1, January 2023
18
In Africa, Zambia in particular, number of invasive species have evolved apart for the Kafue
weed such as water hyacinth. These weeds have mainly been a source of the destruction of crops
in the areas where they have appeared. They have made agriculture almost impossible in the
areas where the Kafue River passes. Other invasive species in Zambia include the MimomsaPigra
plant from South America, which is ravaging wildlife especially in the area around the Kafue
flats.
4.5.2 Social-economic Ramifications of Climate change
Climate change has phenomenal impact upon human life. The unprecedented shifts in weather
patterns have produced catastrophe such as floods and outbreak of disease in several parts of the
world. Global warming has not only raised the sea levels but created conditions favorable for
certain fleas to survive. Various microbes harmful to human health such as the bacteria and
viruses like the Chaleo Vibrio (Cholera Virus) has in modern history ravaged Europe, Asia and
Africa (Ndebele-Murisaet al., 2020). Although Europe and Asia contained the situation in the
early 1900s, Africa and India seemed to have failed for the most part to contain it. The
predicament seems to affect the two localities on earth perhaps due to the abundance of informal
settlements or slums in urban areas. It is these spaces of urban blight where bacteria and viruses
that cause water bone diseases are commonly found. This is probably due to their unsanitary
conditions. And so, the challenge of informal settlement becomes top priority in forwarding the
urban agenda on several international forums. In the most recent years, during the period between
2020-2022, a strange virus called Corona Virus -19 (COVID) emerged and enveloped most
countries with cooler climatic conditions. It was viewed by the WHO that the virus flourishes
best in temperate regions where temperatures where relatively quite low. Nonetheless, it is
interesting to note that the same virus as well as its hybrid still spread to countries in the tropics
(mostly found in Africa) and infected large populations as well (Chigbu and Onyebueke, 2021).
This is indicative that temperatures in Africa during the cold season have dropped below the
normal. Throughout the world, millions of people lost their lives at a rate never experienced
before since the last outbreak of small pox. Perhaps, COVID-19 was the first tip of the iceberg
showing us the fate a future whose ecology is completely distorted.
Overall, we can also say that climate change has a cost implication upon the lives of people. the
economic implication is created by the loss of human resource, infrastructure breakdown, and the
disruption of trade and commerce. The COVID -19 pandemic literally halted the peak
performance of business. Many people lost employment during the 2020-2021 lockdown (Chigbu
and Onyebueke, 2021). Generally, the laws of supply and demand were grossly disturbed and this
was typically seen in the agriculture sector in United States of America, where gallons and
gallons of milk was disposed-off into canals as refuse due to lack of demand. The world was
clearly headed for an economic meltdown similar to that of 2008.
4.6 The Future of Global Ecology and Climate Change
Findings show the pillars upon which human survival and advancement is premised upon in order
to project like-hood of ecological depletion,thus, unveil the future of climate change. Findings
also reveal that humanity is grappling with a dichotomyof population change and poverty across
the globe. These are matters that have grave ramifications upon ecological preservation (UN-
Habitat, 2022; Giddings, Hopwood and O’Brien, 2002). The two matters are also significantly
part of the motivation behind human technological advancement and the quest to develop. As a
matter of fact, the two are among the Sustainable Development Goals (SDGs). Findings also
show that, in an attempt to attain such goals, the global community is contending with a complex
situation whereby, development naturally demands supply from the ecology, while the ecology
also demands replenishment. Failure to reconcile the twois likely to breakdown ecological
Advanced Energy: An International Journal (AEIJ), Vol. 10, No. 1, January 2023
19
stamina and unleash all the dangers of climate change. Therefore, the concept of sustainable
development becomes handy but also complicated at the same time. In order to understand the
potential of population change in the matters of climate change, the section that follows maps out
populations change across the world. This is to give light into the situation obtaining in the world
about how much needs to be addressed to aid the status quo for most parts of the world.
4.6.1 Population Change in the trajectory of world Ecology and Climate Change
The world map in figure 2 shows the population change across the world in the period between
1990-2013.
Figure2. Mapping of Population Change against Potential Climate Change around the world
Source: Adapted from FAO Assessment Report, 2015
According to map evidence, much of the world falls in the category of between 25 to >100
percent increase in population and only less than 25 percent have minimal, zero, or negative
growth. This shows the recent historical trajectory of world population dynamics. Populations are
generally expanding and this is increasing the pressure on development agendum for many
nations. Extremely few (<5 percent) countries which are located in the Scandinavian world are
the ones that have attained an impressive global trajectory with a promising future for decreased
pressure upon natural ecology. If the majority are still striving with efforts to reach zero or
negative increase in population, then the challenge of population pressure upon the ecological
footprint continues. This in turn culminates in ripple concerns over the climate change issues. All
the parts of the world with increase in population are mapping out areas of potential ecological
degradation. And unless measures are put in place, the world still risks chances of losing the
ecological footprint.
4.6.2 Poverty in the trajectory of world Ecology and Climate Change
As mentioned earlier, in section 4.3, the other factor motivating ecological erosion is the
relentless quest to alleviate poverty across the world. Poverty is a social-economic ill in human
society and it is one of the main issues being addressed by global communities. Findings show
that, this zest to make as many people access basic social and economic needs has a telling
Advanced Energy: An International Journal (AEIJ), Vol. 10, No. 1, January 2023
20
impact on the environment because the obvious instruments are industry and technology.
However, these engines of mass production escalate the consumption of natural resources and
serve to accelerate the rate of ecological degradation and climate change. As at 2015, the
prevalence of poverty in the world according to FAO is shown in the figure 3.As shown in the
findings, literally the entire global south including parts of Central Africa, Central America, India
and the islands of East Indies, except for Australia is still ravaged by poverty and this state of
affairs calls for more implementation of developmental plans. If there are still traces of large
portions of land ravaged by poverty, then there is still greater potential for developers to deplete
the ecology.
Figure 3. Mapping of poverty against the potential of Climate Changeacross the globe
Source: Adapted from FAO Assessment Report,
2015https://nap.nationalacademies.org/read/14673/chapter/2#3
It is the exploitation of natural resource which further robs it of the natural elements needed to
support healthy conditions on the planet. And if this potential for further exploitation exists, then
the future of climate change is still in limbo. Today, there are not so many ways of alleviating
poverty except through developmental agendas that resort to depletion of natural resource. Strides
are being initiated to develop ways of combating poverty with minimal damage to the ecology.
Nonetheless, such strides are still insufficient to reach the mass number of people who still need
to be salvaged from the shackles of poverty especially in Africa.
4.6.3 Economic development in the trajectory of world Ecology and Climate Change
Findings of the study have established that there is a correlation between human development and
climate change. Human development has dictated the pace of land use change and led to
increased emission of greenhouse gases. Primarily change of land-use in the past 200 years has
been characterized by the establishment of industries and the spread of urbanization.
Compounding this land-use changes is the continued rapid growth of human population cross
most parts of the world. The meaning of such population growth in the dynamics of climate
change is that, industry will continue releasing of greenhouse gases and temperatures are likely to
continue rising (Harvey, 2018). The double flanked problem is that, industry and urbanization
consume massive amounts of natural resources in terms of land, water and forest, while at the
same time emitting greenhouse gases. This means that ecological erosion and pollution are
happening at phenomenal rates around the globe at phenomenal (Ibid, 2018).
Advanced Energy: An International Journal (AEIJ), Vol. 10, No. 1, January 2023
21
Another critical component of the ecology has been introduced in the mix of land and oceanic
degradation -forest cover. This is yet another aspect of the ecology that has been significantly
impacted by human development. Again, both industry and urbanization has grossly reduced
forest cover across the world. Today, there is nothing exploited by industry more than forests.
Many sectors of the economy demand timber, and so, the lumbering industry has received more
attention that several others. The challenge in the industry is that trees are not only exploited to
produce manufactured goods in industries but are also indiscriminately cut down for clearance to
establish industrial plants or even settlement as well as shifting cultivation (Cudworth, 2005).
This makes forest cover one of the most threatened aspects of the ecology. The global trend
across history shows that brown spaces are not only draining marshes but swallowing up forest
cover.
The world map today shows how the built environment is encroaching green spaces and
overtaking vegetative cover. Although urban planning seems to be taking sustainable planning
concepts to include green spaces, this kind of integrated planning has largely been ignored in the
past 200 years by many communities in the world (UN-Habitat, 2020; Mori and Christodoulou,
2012). This is especially common in the global south were unplanned or informal settlements are
rife. It is an international urban challenge which the UN seeks to address in this 21st
century but
so far has recorded minimal success (UN-Habitat, 2022). Despite efforts to transform planning
into a means of establishing smart cities to incorporate greening, brown development continues to
override in many cases. For example, shopping malls in urban centres have for some time
removed vegetation and paved vast spaces depriving land sinks and vegetative cover. There are
now new approaches and concepts in planning that seek to address such issues.The figure 8
shows how brown spaces are predominant the green spaces.
Figure 8.Spaces of brown development and degrees of potential for deforestation
Source: FAO Assessment Report, 2015
All the spaces mapped out with brown are areas of high deforestation due to peak
industrialization. Those are spaces most vulnerable to desertification. Nevertheless, they are also
communities that have taken matters of forest management more seriously that the spaces
mapped-out in brighter colours. It also seems that the communities that are less developed have
more forest cover compared to that are developed. Perhaps the developed countries depleted their
forests in a bid to attain development. And this becomes the trap thesis of poverty. If
development will come to the global south and poverty should be eradicated, then deforestation
Advanced Energy: An International Journal (AEIJ), Vol. 10, No. 1, January 2023
22
must rise to a certain threshold. And yet with deforestation also comes climate change and other
ecological ramifications.
5. CONCLUSIONS
The advancement of human so-called civilization from Prehistory, Neolithic, Iron, Technology,
Industry, and Artificial Intelligence are forerunners of quantum ecological transformation.
Prehistoric and Neolithic times have shown a more natural/normal curve of ecological cycles.
The iron age increased productivity and structured human settlement of human without
significantly altering ecology. Agriculture consumed forest and iron-working expedited this but
also without significantly disturbing ecology. Arguably, the industrial revolution has contributed
the greatest deal to ecological disturbance and climate change. The late 19th
century began to
realize higher levels of CFCs and temperature in the atmosphere. This period upset a chain
reaction and other parts of the ecosystem such as water and land reacted to the atmospheric
restructuring. All these changes inevitably began to impact biodiversity in terms of flora and
fauna both in terrestrial and aquatic domains. The industrial revolution has spread across the
globe and its concomitant ecological ramifications have followed it. The industrial revolution has
also precipitated the birth of further technological advancement called artificial intelligence. This
is the current trend of human achievement and is dictating the pace of productivity and economic
development. Nonetheless, economies of various countries that are still developing must be
reoriented on the path of sustainability to stop the possibility of future catastrophe. Therefore,
urgent action to curb the escalating ecological disturbance through integrated conceptual planning
and initiatives from the SDGs ought to be quickly implemented to protect the planet from
impending doom.
ACKNOWLEDGEMENTS
I thank the Almighty God for the opportunity to write this paper and to make my submission to
the CiVEJ and AIRCC. Firstly, I thank the Academia forum for the notification online which
alerted me about the chance to make the submission. Secondly, I also thank Mrs. Sinkamba J.N.,
Dr. Muchanga M.,Miss Chilufya K., Miss Chirwa F., Mr. Kaulule C., Mr. Phiri G. and Miss
Tembo G., for their continued support in my scholarly and academic endeavors. I am also
grateful to Dr. Chibamba D., Eld. Mwika G., and Mr. Chirwa R., for their encouragement as I
wrote. I thank my Eco-club team for their zeal for community development which continues to be
a beckon of hope rekindling the drive in me to help informal settlements. I lastly thank my family
for moral support.
REFERENCES
[1] Arlt, H. and Daviau, D.G. eds., 2009. Culture, Civilization and Human Society–Volume II (Vol. 4).
EOLSS Publications.
[2] Bartke, S., Forster, T., Githiri, G., Jering, A., Kago, J., Schlimmer, S. and Sietchiping, R., 2021. The
UN-Habitat Urban-Rural Linkages Guiding Principles: Assessment of the Adoptability to Topical
Land Management Challenges in Germany, Kenya and Tanzania. In International Yearbook of Soil
Law and Policy 2019 (pp. 369-398). Springer, Cham.
[3] Bostley. A., 2019. Basics of Research Design: A Guide to selecting appropriate research design. 6.
76 - 89.
[4] Chibuye, 2014. InterogatingUtban Poverty Lines. Oxford
[5] Chigbu, U.E. and Onyebueke, V.U., 2021. The COVID-19 pandemic in informal settlements:(re)
considering urban planning interventions. The Town Planning Review, 92(1), pp.115-121.
[6] Clark, G., 2014. The industrial revolution. In Handbook of economic growth 2, 217-262. Elsevier.
Advanced Energy: An International Journal (AEIJ), Vol. 10, No. 1, January 2023
23
[7] Dovey, K., Shafique, T., van Oostrum, M. and Chatterjee, I., 2021. Informal settlement is not a
euphemism for 'slum': what's at stake beyond the language? International Development Planning
Review, 43(2).
[8] Evidence, Impacts, and Choices: PDF Booklet. 2015. Washington, DC: The National Academies
Press.
https://doi.org/10.17226/14673.
[9] Food and Agriculture Organization of the United Nations. 2020. Global Forest Resources
Assessment.
https://www.fao.org/forest-resources-assessment/remote-sensing/global-ecological-zones-gez-
mapping/en/
[10] Giddings, B., Hopwood, B. and O'brien, G., 2002. Environment, economy and society: fitting them
together into sustainable development. Sustainable development, 10(4), pp.187-196.
[11] Habitat, U.N., 2019. The strategic plan 2020-2023.
[12] Habitat, U.N., 2022. World Cities Report 2022: Envisaging the Future of Cities.
[13] Habitat, U.N., 2018. Tracking progress towards inclusive, safe, resilient and sustainable cities and
human settlements
[14] Hale, A.J., Ricotta, D.N., Freed, J., Smith, C.C. and Huang, G.C., 2019. Adapting Maslow's hierarchy
of needs as a framework for resident wellness. Teaching and learning in medicine, 31(1), pp.109-118.
[15] Harvey, L.D., 2018. Global warming. Routledge.
[16] Held, I.M. and Soden, B.J., 2006. Robust responses of the hydrological cycle to global
warming. Journal of climate, 19(21), pp.5686-5699.
https://www.scribbr.com/statistics/t-test/
[17] Jorgenson, A.K., 2003. Consumption and environmental degradation: A cross-national analysis of the
ecological footprint. Social Problems, 50(3), pp.374-394.
[18] Klasen, S., 2018. Human development indices and indicators: A critical evaluation. Human
Development Report Office Background Paper, 1
[19] Labat, D., Goddéris, Y., Probst, J.L. and Guyot, J.L., 2004. Evidence for global runoff increase
related to climate warming. Advances in water resources, 27(6), pp.631-642.
[20] Muhanna, E., 2017. The World in a Book. In The World in a Book. Princeton University Press.
[21] National Research Council: 2011d
[22] National Research Council: 2010d
[23] Nchito, W.S., 2007. Flood risk in unplanned settlements in Lusaka. Environment and
Urbanization, 19(2), pp.539-551.
[24] Ndebele-Murisa, M.R., Mubaya, C.P., Pretorius, L., Mamombe, R., Iipinge, K., Nchito, W., Mfune,
J.K., Siame, G. and Mwalukanga, B., 2020. City to city learning and knowledge exchange for climate
resilience in southern Africa. PloS one, 15(1).
[25] Pieterse, J.N., 2010. Development theory. Sage.
[26] Rashid, A., Irum, A., Malik, I.A., Ashraf, A., Rongqiong, L., Liu, G., Ullah, H., Ali, M.U. and
Yousaf, B., 2018. Ecological footprint of Rawalpindi; Pakistan's first footprint analysis from
urbanization perspective. Journal of Cleaner Production, 170, pp.362-368.
[27] Rees, W., 2018. Ecological footprint. In Companion to environmental studies (pp. 43-48). Routledge.
[28] Rymarczyk, J., 2020. Technologies, opportunities and challenges of the industrial revolution 4.0:
theoretical considerations. Entrepreneurial business and economics review, 8(1), pp.185-198.
[29] Scarre, C. and Fagan, B.M., 2016. Ancient civilizations. Routledge.
[30] Singer, S.F., 2006. Unstoppable global warming: Every 1,500 years. Rowman & Littlefield
[31] Vlek, C. and Steg, L., 2007. Human Behaviour and Environmental Sustainability: Problems, Driving
Forces, and Research Topics. Journal of social issues, 63(1), pp.1-19.
[32] Wengrow, D., 2018. What makes civilization? the ancient near East and the future of the West.
Oxford University Press.
[33] Xu, M., David, J.M. and Kim, S.H., 2018. The fourth industrial revolution: Opportunities and
challenges. International journal of financial research, 9(2), pp.90-95.
[34] Yumashev, A., Ślusarczyk, B., Kondrashev, S. and Mikhaylov, A., 2020. Global indicators of
sustainable development: Evaluation of the influence of the human development index on
consumption and quality of energy. Energies, 13(11), p.2768.
Advanced Energy: An International Journal (AEIJ), Vol. 10, No. 1, January 2023
24
AUTHOR
Mululu Chirwa is a qualified Spatial Planner and Educator of Geography with
experience in field research. He is a holder of a MSc degree in Spatial Planning. He is a
researcher and a writer with deep interest in civil engineering and spatial planning. He
patronizes an Eco-Club where he inspires and cultivates innovation and technology to
offer solutions to community challenges. Mululu is also passionate about reshaping
informal landscape and improving the lives of the vulnerable in society. He has done
research and written an article to help foster resilience in two informal settlements in
the city of Lusaka. He is currently working to expand the Eco-Club into a more
formidable organization to encompass stakeholders that can help merge ideas with practice to help informal
communities. He is also the section head -Geography at Kabulonga Girls Secondary School of Lusaka.
Mululu also won two awards of excellence in applied sciences at the University of Zambia during a
postgraduate seminar presentation among a group of 84 participants. He also pioneered a team of students
to win an award in a ‘smart city’ challenge competition organized by Plan International and Worldwide
Fund.

More Related Content

Similar to DYNAMICS IN THE HISTORY AND ECONOMIC DEVELOPMENT OF MAN: REFOCUSING ON ECOLOGICAL DISTURBANCE AND CLIMATE CHANGE

Journal of Geographical Research | Vol.6, Iss.3 July 2023
Journal of Geographical Research | Vol.6, Iss.3 July 2023Journal of Geographical Research | Vol.6, Iss.3 July 2023
Journal of Geographical Research | Vol.6, Iss.3 July 2023Bilingual Publishing Group
 
Ecological approaches in planning for sustainable cities A review of the lite...
Ecological approaches in planning for sustainable cities A review of the lite...Ecological approaches in planning for sustainable cities A review of the lite...
Ecological approaches in planning for sustainable cities A review of the lite...GJESM Publication
 
IntroductionWelcome to the year 2050. Where there are no more .docx
IntroductionWelcome to the year 2050. Where there are no more .docxIntroductionWelcome to the year 2050. Where there are no more .docx
IntroductionWelcome to the year 2050. Where there are no more .docxvrickens
 
History of environmental planning and management since mid 20th century
History of environmental planning and management since mid   20th centuryHistory of environmental planning and management since mid   20th century
History of environmental planning and management since mid 20th centuryGeofrey Yator
 
Critical threats to the global environment.Daniel BravoS
Critical threats to the global environment.Daniel BravoSCritical threats to the global environment.Daniel BravoS
Critical threats to the global environment.Daniel BravoSMargenePurnell14
 
Global Warming
Global WarmingGlobal Warming
Global Warmingtungyik
 
Global Warming
Global WarmingGlobal Warming
Global Warmingtungyik
 
Global Warming
Global WarmingGlobal Warming
Global Warmingtungyik
 
C041031927
C041031927C041031927
C041031927IOSR-JEN
 
BIODIVERSITY AND CLIMATE CHANGE
BIODIVERSITY AND CLIMATE CHANGEBIODIVERSITY AND CLIMATE CHANGE
BIODIVERSITY AND CLIMATE CHANGEMassa Critica
 
Requisite for New Pattern towards Sustainable Growth in Africa
Requisite for New Pattern towards Sustainable Growth in AfricaRequisite for New Pattern towards Sustainable Growth in Africa
Requisite for New Pattern towards Sustainable Growth in AfricaIJSRED
 
World Scientists'Warning to Humanity on the Health of Planet Earth- 16,000 sc...
World Scientists'Warning to Humanity on the Health of Planet Earth- 16,000 sc...World Scientists'Warning to Humanity on the Health of Planet Earth- 16,000 sc...
World Scientists'Warning to Humanity on the Health of Planet Earth- 16,000 sc...Energy for One World
 
coralie-rigaud-DDO9-memoire-2012
coralie-rigaud-DDO9-memoire-2012coralie-rigaud-DDO9-memoire-2012
coralie-rigaud-DDO9-memoire-2012Coralie Rigaud
 
The Threats and Benefits of ScienceScience is a broad subject th.docx
The Threats and Benefits of ScienceScience is a broad subject th.docxThe Threats and Benefits of ScienceScience is a broad subject th.docx
The Threats and Benefits of ScienceScience is a broad subject th.docxchristalgrieg
 
The Depletion Of Natural Elements Has A Negative Impact On...
The Depletion Of Natural Elements Has A Negative Impact On...The Depletion Of Natural Elements Has A Negative Impact On...
The Depletion Of Natural Elements Has A Negative Impact On...Crystal Alvarez
 
Toward Integrated Analysis of Socio- Ecological Data for Improved Targeting o...
Toward Integrated Analysis of Socio- Ecological Data for Improved Targeting o...Toward Integrated Analysis of Socio- Ecological Data for Improved Targeting o...
Toward Integrated Analysis of Socio- Ecological Data for Improved Targeting o...CIAT
 

Similar to DYNAMICS IN THE HISTORY AND ECONOMIC DEVELOPMENT OF MAN: REFOCUSING ON ECOLOGICAL DISTURBANCE AND CLIMATE CHANGE (19)

Journal of Geographical Research | Vol.6, Iss.3 July 2023
Journal of Geographical Research | Vol.6, Iss.3 July 2023Journal of Geographical Research | Vol.6, Iss.3 July 2023
Journal of Geographical Research | Vol.6, Iss.3 July 2023
 
Ecological approaches in planning for sustainable cities A review of the lite...
Ecological approaches in planning for sustainable cities A review of the lite...Ecological approaches in planning for sustainable cities A review of the lite...
Ecological approaches in planning for sustainable cities A review of the lite...
 
IntroductionWelcome to the year 2050. Where there are no more .docx
IntroductionWelcome to the year 2050. Where there are no more .docxIntroductionWelcome to the year 2050. Where there are no more .docx
IntroductionWelcome to the year 2050. Where there are no more .docx
 
Climate Change Essays
Climate Change EssaysClimate Change Essays
Climate Change Essays
 
History of environmental planning and management since mid 20th century
History of environmental planning and management since mid   20th centuryHistory of environmental planning and management since mid   20th century
History of environmental planning and management since mid 20th century
 
Critical threats to the global environment.Daniel BravoS
Critical threats to the global environment.Daniel BravoSCritical threats to the global environment.Daniel BravoS
Critical threats to the global environment.Daniel BravoS
 
Global Warming
Global WarmingGlobal Warming
Global Warming
 
Global Warming
Global WarmingGlobal Warming
Global Warming
 
Global Warming
Global WarmingGlobal Warming
Global Warming
 
C041031927
C041031927C041031927
C041031927
 
Visions+of+the+Future
Visions+of+the+FutureVisions+of+the+Future
Visions+of+the+Future
 
BIODIVERSITY AND CLIMATE CHANGE
BIODIVERSITY AND CLIMATE CHANGEBIODIVERSITY AND CLIMATE CHANGE
BIODIVERSITY AND CLIMATE CHANGE
 
Requisite for New Pattern towards Sustainable Growth in Africa
Requisite for New Pattern towards Sustainable Growth in AfricaRequisite for New Pattern towards Sustainable Growth in Africa
Requisite for New Pattern towards Sustainable Growth in Africa
 
World Scientists'Warning to Humanity on the Health of Planet Earth- 16,000 sc...
World Scientists'Warning to Humanity on the Health of Planet Earth- 16,000 sc...World Scientists'Warning to Humanity on the Health of Planet Earth- 16,000 sc...
World Scientists'Warning to Humanity on the Health of Planet Earth- 16,000 sc...
 
coralie-rigaud-DDO9-memoire-2012
coralie-rigaud-DDO9-memoire-2012coralie-rigaud-DDO9-memoire-2012
coralie-rigaud-DDO9-memoire-2012
 
The Threats and Benefits of ScienceScience is a broad subject th.docx
The Threats and Benefits of ScienceScience is a broad subject th.docxThe Threats and Benefits of ScienceScience is a broad subject th.docx
The Threats and Benefits of ScienceScience is a broad subject th.docx
 
The Depletion Of Natural Elements Has A Negative Impact On...
The Depletion Of Natural Elements Has A Negative Impact On...The Depletion Of Natural Elements Has A Negative Impact On...
The Depletion Of Natural Elements Has A Negative Impact On...
 
Toward Integrated Analysis of Socio- Ecological Data for Improved Targeting o...
Toward Integrated Analysis of Socio- Ecological Data for Improved Targeting o...Toward Integrated Analysis of Socio- Ecological Data for Improved Targeting o...
Toward Integrated Analysis of Socio- Ecological Data for Improved Targeting o...
 
What Is Environmental Degradation
What Is Environmental DegradationWhat Is Environmental Degradation
What Is Environmental Degradation
 

More from AEIJjournal2

Direct Alcohol Alkaline Fuel Cell as Future Prospectus
Direct Alcohol Alkaline Fuel Cell as Future ProspectusDirect Alcohol Alkaline Fuel Cell as Future Prospectus
Direct Alcohol Alkaline Fuel Cell as Future ProspectusAEIJjournal2
 
COMPARING ECONOMIC FEASIBILITY OF DOMESTIC SOLAR WATER HEATER INSTALLATION IN...
COMPARING ECONOMIC FEASIBILITY OF DOMESTIC SOLAR WATER HEATER INSTALLATION IN...COMPARING ECONOMIC FEASIBILITY OF DOMESTIC SOLAR WATER HEATER INSTALLATION IN...
COMPARING ECONOMIC FEASIBILITY OF DOMESTIC SOLAR WATER HEATER INSTALLATION IN...AEIJjournal2
 
FREE CONVECTION HEAT TRANSFER OF NANOFLUIDS FROM A HORIZONTAL PLATE EMBEDDED ...
FREE CONVECTION HEAT TRANSFER OF NANOFLUIDS FROM A HORIZONTAL PLATE EMBEDDED ...FREE CONVECTION HEAT TRANSFER OF NANOFLUIDS FROM A HORIZONTAL PLATE EMBEDDED ...
FREE CONVECTION HEAT TRANSFER OF NANOFLUIDS FROM A HORIZONTAL PLATE EMBEDDED ...AEIJjournal2
 
GDQ SIMULATION FOR FLOW AND HEAT TRANSFER OF A NANOFLUID OVER A NONLINEARLY S...
GDQ SIMULATION FOR FLOW AND HEAT TRANSFER OF A NANOFLUID OVER A NONLINEARLY S...GDQ SIMULATION FOR FLOW AND HEAT TRANSFER OF A NANOFLUID OVER A NONLINEARLY S...
GDQ SIMULATION FOR FLOW AND HEAT TRANSFER OF A NANOFLUID OVER A NONLINEARLY S...AEIJjournal2
 
ASSESSING PERCEPTUAL VIDEO QUALITY IN WIMAX NETWORKS
ASSESSING PERCEPTUAL VIDEO QUALITY IN WIMAX NETWORKS ASSESSING PERCEPTUAL VIDEO QUALITY IN WIMAX NETWORKS
ASSESSING PERCEPTUAL VIDEO QUALITY IN WIMAX NETWORKS AEIJjournal2
 
Layer-Type Power Transformer Thermal Analysis Considering Effective Parameter...
Layer-Type Power Transformer Thermal Analysis Considering Effective Parameter...Layer-Type Power Transformer Thermal Analysis Considering Effective Parameter...
Layer-Type Power Transformer Thermal Analysis Considering Effective Parameter...AEIJjournal2
 
STUDY OF THE EQUIVALENT CIRCUIT OF A DYESENSITIZED SOLAR CELLS
STUDY OF THE EQUIVALENT CIRCUIT OF A DYESENSITIZED SOLAR CELLSSTUDY OF THE EQUIVALENT CIRCUIT OF A DYESENSITIZED SOLAR CELLS
STUDY OF THE EQUIVALENT CIRCUIT OF A DYESENSITIZED SOLAR CELLSAEIJjournal2
 
TRANSIENT STABILITY IMPROVEMENT OF POWER SYSTEMS BY OPTIMAL SIZING AND ALLOCA...
TRANSIENT STABILITY IMPROVEMENT OF POWER SYSTEMS BY OPTIMAL SIZING AND ALLOCA...TRANSIENT STABILITY IMPROVEMENT OF POWER SYSTEMS BY OPTIMAL SIZING AND ALLOCA...
TRANSIENT STABILITY IMPROVEMENT OF POWER SYSTEMS BY OPTIMAL SIZING AND ALLOCA...AEIJjournal2
 
A Review on RDB to RDF Mapping for Semantic Web
A Review on RDB to RDF Mapping for Semantic WebA Review on RDB to RDF Mapping for Semantic Web
A Review on RDB to RDF Mapping for Semantic WebAEIJjournal2
 
Dynamics in the History and Economic Development of Man: Refocusing on Ecolog...
Dynamics in the History and Economic Development of Man: Refocusing on Ecolog...Dynamics in the History and Economic Development of Man: Refocusing on Ecolog...
Dynamics in the History and Economic Development of Man: Refocusing on Ecolog...AEIJjournal2
 
SIMULATION OF THE SOLAR CELLS WITH PC1D, APPLICATION TO CELLS BASED ON SILICON
SIMULATION OF THE SOLAR CELLS WITH PC1D, APPLICATION TO CELLS BASED ON SILICONSIMULATION OF THE SOLAR CELLS WITH PC1D, APPLICATION TO CELLS BASED ON SILICON
SIMULATION OF THE SOLAR CELLS WITH PC1D, APPLICATION TO CELLS BASED ON SILICONAEIJjournal2
 
DESIGN AND DEVELOPMENT OF WIND TURBINE EMULATOR TO OPERATE WITH 1.5KW INDUCTI...
DESIGN AND DEVELOPMENT OF WIND TURBINE EMULATOR TO OPERATE WITH 1.5KW INDUCTI...DESIGN AND DEVELOPMENT OF WIND TURBINE EMULATOR TO OPERATE WITH 1.5KW INDUCTI...
DESIGN AND DEVELOPMENT OF WIND TURBINE EMULATOR TO OPERATE WITH 1.5KW INDUCTI...AEIJjournal2
 
EVALUATING MATHEMATICAL HEAT TRANSFER EFFECTIVENESS EQUATIONS USING CFD TECHN...
EVALUATING MATHEMATICAL HEAT TRANSFER EFFECTIVENESS EQUATIONS USING CFD TECHN...EVALUATING MATHEMATICAL HEAT TRANSFER EFFECTIVENESS EQUATIONS USING CFD TECHN...
EVALUATING MATHEMATICAL HEAT TRANSFER EFFECTIVENESS EQUATIONS USING CFD TECHN...AEIJjournal2
 
Co integration Relationship Between Economic Growth, Export and Electricity C...
Co integration Relationship Between Economic Growth, Export and Electricity C...Co integration Relationship Between Economic Growth, Export and Electricity C...
Co integration Relationship Between Economic Growth, Export and Electricity C...AEIJjournal2
 
Effect of Zn Concentration On Structural and Optical Proprieties Of ZNO Thin ...
Effect of Zn Concentration On Structural and Optical Proprieties Of ZNO Thin ...Effect of Zn Concentration On Structural and Optical Proprieties Of ZNO Thin ...
Effect of Zn Concentration On Structural and Optical Proprieties Of ZNO Thin ...AEIJjournal2
 
Split Second Analysis Covering High Pressure Gas Flow Dynamics At Pipe Outlet...
Split Second Analysis Covering High Pressure Gas Flow Dynamics At Pipe Outlet...Split Second Analysis Covering High Pressure Gas Flow Dynamics At Pipe Outlet...
Split Second Analysis Covering High Pressure Gas Flow Dynamics At Pipe Outlet...AEIJjournal2
 
The Force Convection Heat Transfer of A Nanofluid Over A Flat Plate: Using Th...
The Force Convection Heat Transfer of A Nanofluid Over A Flat Plate: Using Th...The Force Convection Heat Transfer of A Nanofluid Over A Flat Plate: Using Th...
The Force Convection Heat Transfer of A Nanofluid Over A Flat Plate: Using Th...AEIJjournal2
 
A MODIFIED ANT COLONY ALGORITHM FOR SOLVING THE UNIT COMMITMENT PROBLEM
A MODIFIED ANT COLONY ALGORITHM FOR SOLVING THE UNIT COMMITMENT PROBLEMA MODIFIED ANT COLONY ALGORITHM FOR SOLVING THE UNIT COMMITMENT PROBLEM
A MODIFIED ANT COLONY ALGORITHM FOR SOLVING THE UNIT COMMITMENT PROBLEMAEIJjournal2
 
Impedance Spectroscopy Analysis of a Liquid Tin Anode Fuel Cell in Voltage Re...
Impedance Spectroscopy Analysis of a Liquid Tin Anode Fuel Cell in Voltage Re...Impedance Spectroscopy Analysis of a Liquid Tin Anode Fuel Cell in Voltage Re...
Impedance Spectroscopy Analysis of a Liquid Tin Anode Fuel Cell in Voltage Re...AEIJjournal2
 

More from AEIJjournal2 (20)

Direct Alcohol Alkaline Fuel Cell as Future Prospectus
Direct Alcohol Alkaline Fuel Cell as Future ProspectusDirect Alcohol Alkaline Fuel Cell as Future Prospectus
Direct Alcohol Alkaline Fuel Cell as Future Prospectus
 
COMPARING ECONOMIC FEASIBILITY OF DOMESTIC SOLAR WATER HEATER INSTALLATION IN...
COMPARING ECONOMIC FEASIBILITY OF DOMESTIC SOLAR WATER HEATER INSTALLATION IN...COMPARING ECONOMIC FEASIBILITY OF DOMESTIC SOLAR WATER HEATER INSTALLATION IN...
COMPARING ECONOMIC FEASIBILITY OF DOMESTIC SOLAR WATER HEATER INSTALLATION IN...
 
FREE CONVECTION HEAT TRANSFER OF NANOFLUIDS FROM A HORIZONTAL PLATE EMBEDDED ...
FREE CONVECTION HEAT TRANSFER OF NANOFLUIDS FROM A HORIZONTAL PLATE EMBEDDED ...FREE CONVECTION HEAT TRANSFER OF NANOFLUIDS FROM A HORIZONTAL PLATE EMBEDDED ...
FREE CONVECTION HEAT TRANSFER OF NANOFLUIDS FROM A HORIZONTAL PLATE EMBEDDED ...
 
GDQ SIMULATION FOR FLOW AND HEAT TRANSFER OF A NANOFLUID OVER A NONLINEARLY S...
GDQ SIMULATION FOR FLOW AND HEAT TRANSFER OF A NANOFLUID OVER A NONLINEARLY S...GDQ SIMULATION FOR FLOW AND HEAT TRANSFER OF A NANOFLUID OVER A NONLINEARLY S...
GDQ SIMULATION FOR FLOW AND HEAT TRANSFER OF A NANOFLUID OVER A NONLINEARLY S...
 
ASSESSING PERCEPTUAL VIDEO QUALITY IN WIMAX NETWORKS
ASSESSING PERCEPTUAL VIDEO QUALITY IN WIMAX NETWORKS ASSESSING PERCEPTUAL VIDEO QUALITY IN WIMAX NETWORKS
ASSESSING PERCEPTUAL VIDEO QUALITY IN WIMAX NETWORKS
 
Layer-Type Power Transformer Thermal Analysis Considering Effective Parameter...
Layer-Type Power Transformer Thermal Analysis Considering Effective Parameter...Layer-Type Power Transformer Thermal Analysis Considering Effective Parameter...
Layer-Type Power Transformer Thermal Analysis Considering Effective Parameter...
 
STUDY OF THE EQUIVALENT CIRCUIT OF A DYESENSITIZED SOLAR CELLS
STUDY OF THE EQUIVALENT CIRCUIT OF A DYESENSITIZED SOLAR CELLSSTUDY OF THE EQUIVALENT CIRCUIT OF A DYESENSITIZED SOLAR CELLS
STUDY OF THE EQUIVALENT CIRCUIT OF A DYESENSITIZED SOLAR CELLS
 
TRANSIENT STABILITY IMPROVEMENT OF POWER SYSTEMS BY OPTIMAL SIZING AND ALLOCA...
TRANSIENT STABILITY IMPROVEMENT OF POWER SYSTEMS BY OPTIMAL SIZING AND ALLOCA...TRANSIENT STABILITY IMPROVEMENT OF POWER SYSTEMS BY OPTIMAL SIZING AND ALLOCA...
TRANSIENT STABILITY IMPROVEMENT OF POWER SYSTEMS BY OPTIMAL SIZING AND ALLOCA...
 
A Review on RDB to RDF Mapping for Semantic Web
A Review on RDB to RDF Mapping for Semantic WebA Review on RDB to RDF Mapping for Semantic Web
A Review on RDB to RDF Mapping for Semantic Web
 
Dynamics in the History and Economic Development of Man: Refocusing on Ecolog...
Dynamics in the History and Economic Development of Man: Refocusing on Ecolog...Dynamics in the History and Economic Development of Man: Refocusing on Ecolog...
Dynamics in the History and Economic Development of Man: Refocusing on Ecolog...
 
SIMULATION OF THE SOLAR CELLS WITH PC1D, APPLICATION TO CELLS BASED ON SILICON
SIMULATION OF THE SOLAR CELLS WITH PC1D, APPLICATION TO CELLS BASED ON SILICONSIMULATION OF THE SOLAR CELLS WITH PC1D, APPLICATION TO CELLS BASED ON SILICON
SIMULATION OF THE SOLAR CELLS WITH PC1D, APPLICATION TO CELLS BASED ON SILICON
 
DESIGN AND DEVELOPMENT OF WIND TURBINE EMULATOR TO OPERATE WITH 1.5KW INDUCTI...
DESIGN AND DEVELOPMENT OF WIND TURBINE EMULATOR TO OPERATE WITH 1.5KW INDUCTI...DESIGN AND DEVELOPMENT OF WIND TURBINE EMULATOR TO OPERATE WITH 1.5KW INDUCTI...
DESIGN AND DEVELOPMENT OF WIND TURBINE EMULATOR TO OPERATE WITH 1.5KW INDUCTI...
 
EVALUATING MATHEMATICAL HEAT TRANSFER EFFECTIVENESS EQUATIONS USING CFD TECHN...
EVALUATING MATHEMATICAL HEAT TRANSFER EFFECTIVENESS EQUATIONS USING CFD TECHN...EVALUATING MATHEMATICAL HEAT TRANSFER EFFECTIVENESS EQUATIONS USING CFD TECHN...
EVALUATING MATHEMATICAL HEAT TRANSFER EFFECTIVENESS EQUATIONS USING CFD TECHN...
 
Co integration Relationship Between Economic Growth, Export and Electricity C...
Co integration Relationship Between Economic Growth, Export and Electricity C...Co integration Relationship Between Economic Growth, Export and Electricity C...
Co integration Relationship Between Economic Growth, Export and Electricity C...
 
Effect of Zn Concentration On Structural and Optical Proprieties Of ZNO Thin ...
Effect of Zn Concentration On Structural and Optical Proprieties Of ZNO Thin ...Effect of Zn Concentration On Structural and Optical Proprieties Of ZNO Thin ...
Effect of Zn Concentration On Structural and Optical Proprieties Of ZNO Thin ...
 
Split Second Analysis Covering High Pressure Gas Flow Dynamics At Pipe Outlet...
Split Second Analysis Covering High Pressure Gas Flow Dynamics At Pipe Outlet...Split Second Analysis Covering High Pressure Gas Flow Dynamics At Pipe Outlet...
Split Second Analysis Covering High Pressure Gas Flow Dynamics At Pipe Outlet...
 
The Force Convection Heat Transfer of A Nanofluid Over A Flat Plate: Using Th...
The Force Convection Heat Transfer of A Nanofluid Over A Flat Plate: Using Th...The Force Convection Heat Transfer of A Nanofluid Over A Flat Plate: Using Th...
The Force Convection Heat Transfer of A Nanofluid Over A Flat Plate: Using Th...
 
A MODIFIED ANT COLONY ALGORITHM FOR SOLVING THE UNIT COMMITMENT PROBLEM
A MODIFIED ANT COLONY ALGORITHM FOR SOLVING THE UNIT COMMITMENT PROBLEMA MODIFIED ANT COLONY ALGORITHM FOR SOLVING THE UNIT COMMITMENT PROBLEM
A MODIFIED ANT COLONY ALGORITHM FOR SOLVING THE UNIT COMMITMENT PROBLEM
 
Impedance Spectroscopy Analysis of a Liquid Tin Anode Fuel Cell in Voltage Re...
Impedance Spectroscopy Analysis of a Liquid Tin Anode Fuel Cell in Voltage Re...Impedance Spectroscopy Analysis of a Liquid Tin Anode Fuel Cell in Voltage Re...
Impedance Spectroscopy Analysis of a Liquid Tin Anode Fuel Cell in Voltage Re...
 
Impedance Spectroscopy Analysis of a Liquid Tin Anode Fuel Cell in Voltage Re...
Impedance Spectroscopy Analysis of a Liquid Tin Anode Fuel Cell in Voltage Re...Impedance Spectroscopy Analysis of a Liquid Tin Anode Fuel Cell in Voltage Re...
Impedance Spectroscopy Analysis of a Liquid Tin Anode Fuel Cell in Voltage Re...
 

Recently uploaded

(NANDITA) Hadapsar Call Girls Just Call 7001035870 [ Cash on Delivery ] Pune ...
(NANDITA) Hadapsar Call Girls Just Call 7001035870 [ Cash on Delivery ] Pune ...(NANDITA) Hadapsar Call Girls Just Call 7001035870 [ Cash on Delivery ] Pune ...
(NANDITA) Hadapsar Call Girls Just Call 7001035870 [ Cash on Delivery ] Pune ...ranjana rawat
 
Horizon Net Zero Dawn – keynote slides by Ben Abraham
Horizon Net Zero Dawn – keynote slides by Ben AbrahamHorizon Net Zero Dawn – keynote slides by Ben Abraham
Horizon Net Zero Dawn – keynote slides by Ben Abrahamssuserbb03ff
 
The Most Attractive Pune Call Girls Shirwal 8250192130 Will You Miss This Cha...
The Most Attractive Pune Call Girls Shirwal 8250192130 Will You Miss This Cha...The Most Attractive Pune Call Girls Shirwal 8250192130 Will You Miss This Cha...
The Most Attractive Pune Call Girls Shirwal 8250192130 Will You Miss This Cha...ranjana rawat
 
Call Girls In Okhla DELHI ~9654467111~ Short 1500 Night 6000
Call Girls In Okhla DELHI ~9654467111~ Short 1500 Night 6000Call Girls In Okhla DELHI ~9654467111~ Short 1500 Night 6000
Call Girls In Okhla DELHI ~9654467111~ Short 1500 Night 6000Sapana Sha
 
Call Girls Mumbai Gayatri 8617697112 Independent Escort Service Mumbai
Call Girls Mumbai Gayatri 8617697112 Independent Escort Service MumbaiCall Girls Mumbai Gayatri 8617697112 Independent Escort Service Mumbai
Call Girls Mumbai Gayatri 8617697112 Independent Escort Service MumbaiCall girls in Ahmedabad High profile
 
Sustainable Clothing Strategies and Challenges
Sustainable Clothing Strategies and ChallengesSustainable Clothing Strategies and Challenges
Sustainable Clothing Strategies and ChallengesDr. Salem Baidas
 
VIP Call Girls Ramanthapur ( Hyderabad ) Phone 8250192130 | ₹5k To 25k With R...
VIP Call Girls Ramanthapur ( Hyderabad ) Phone 8250192130 | ₹5k To 25k With R...VIP Call Girls Ramanthapur ( Hyderabad ) Phone 8250192130 | ₹5k To 25k With R...
VIP Call Girls Ramanthapur ( Hyderabad ) Phone 8250192130 | ₹5k To 25k With R...Suhani Kapoor
 
BOOK Call Girls in (Dwarka) CALL | 8377087607 Delhi Escorts Services
BOOK Call Girls in (Dwarka) CALL | 8377087607 Delhi Escorts ServicesBOOK Call Girls in (Dwarka) CALL | 8377087607 Delhi Escorts Services
BOOK Call Girls in (Dwarka) CALL | 8377087607 Delhi Escorts Servicesdollysharma2066
 
(ANIKA) Call Girls Wagholi ( 7001035870 ) HI-Fi Pune Escorts Service
(ANIKA) Call Girls Wagholi ( 7001035870 ) HI-Fi Pune Escorts Service(ANIKA) Call Girls Wagholi ( 7001035870 ) HI-Fi Pune Escorts Service
(ANIKA) Call Girls Wagholi ( 7001035870 ) HI-Fi Pune Escorts Serviceranjana rawat
 
VIP Call Girls Moti Ganpur ( Hyderabad ) Phone 8250192130 | ₹5k To 25k With R...
VIP Call Girls Moti Ganpur ( Hyderabad ) Phone 8250192130 | ₹5k To 25k With R...VIP Call Girls Moti Ganpur ( Hyderabad ) Phone 8250192130 | ₹5k To 25k With R...
VIP Call Girls Moti Ganpur ( Hyderabad ) Phone 8250192130 | ₹5k To 25k With R...Suhani Kapoor
 
VIP Call Girls Mahadevpur Colony ( Hyderabad ) Phone 8250192130 | ₹5k To 25k ...
VIP Call Girls Mahadevpur Colony ( Hyderabad ) Phone 8250192130 | ₹5k To 25k ...VIP Call Girls Mahadevpur Colony ( Hyderabad ) Phone 8250192130 | ₹5k To 25k ...
VIP Call Girls Mahadevpur Colony ( Hyderabad ) Phone 8250192130 | ₹5k To 25k ...Suhani Kapoor
 
VIP Call Girls Service Chaitanyapuri Hyderabad Call +91-8250192130
VIP Call Girls Service Chaitanyapuri Hyderabad Call +91-8250192130VIP Call Girls Service Chaitanyapuri Hyderabad Call +91-8250192130
VIP Call Girls Service Chaitanyapuri Hyderabad Call +91-8250192130Suhani Kapoor
 
webinaire-green-mirror-episode-2-Smart contracts and virtual purchase agreeme...
webinaire-green-mirror-episode-2-Smart contracts and virtual purchase agreeme...webinaire-green-mirror-episode-2-Smart contracts and virtual purchase agreeme...
webinaire-green-mirror-episode-2-Smart contracts and virtual purchase agreeme...Cluster TWEED
 
VIP Call Girl Gorakhpur Aashi 8250192130 Independent Escort Service Gorakhpur
VIP Call Girl Gorakhpur Aashi 8250192130 Independent Escort Service GorakhpurVIP Call Girl Gorakhpur Aashi 8250192130 Independent Escort Service Gorakhpur
VIP Call Girl Gorakhpur Aashi 8250192130 Independent Escort Service GorakhpurSuhani Kapoor
 
Environmental Toxicology (environmental biology)
Environmental Toxicology (environmental biology)Environmental Toxicology (environmental biology)
Environmental Toxicology (environmental biology)RaviPrajapat11
 

Recently uploaded (20)

(NANDITA) Hadapsar Call Girls Just Call 7001035870 [ Cash on Delivery ] Pune ...
(NANDITA) Hadapsar Call Girls Just Call 7001035870 [ Cash on Delivery ] Pune ...(NANDITA) Hadapsar Call Girls Just Call 7001035870 [ Cash on Delivery ] Pune ...
(NANDITA) Hadapsar Call Girls Just Call 7001035870 [ Cash on Delivery ] Pune ...
 
Green Marketing
Green MarketingGreen Marketing
Green Marketing
 
Horizon Net Zero Dawn – keynote slides by Ben Abraham
Horizon Net Zero Dawn – keynote slides by Ben AbrahamHorizon Net Zero Dawn – keynote slides by Ben Abraham
Horizon Net Zero Dawn – keynote slides by Ben Abraham
 
The Most Attractive Pune Call Girls Shirwal 8250192130 Will You Miss This Cha...
The Most Attractive Pune Call Girls Shirwal 8250192130 Will You Miss This Cha...The Most Attractive Pune Call Girls Shirwal 8250192130 Will You Miss This Cha...
The Most Attractive Pune Call Girls Shirwal 8250192130 Will You Miss This Cha...
 
Call Girls In Okhla DELHI ~9654467111~ Short 1500 Night 6000
Call Girls In Okhla DELHI ~9654467111~ Short 1500 Night 6000Call Girls In Okhla DELHI ~9654467111~ Short 1500 Night 6000
Call Girls In Okhla DELHI ~9654467111~ Short 1500 Night 6000
 
Call Girls Mumbai Gayatri 8617697112 Independent Escort Service Mumbai
Call Girls Mumbai Gayatri 8617697112 Independent Escort Service MumbaiCall Girls Mumbai Gayatri 8617697112 Independent Escort Service Mumbai
Call Girls Mumbai Gayatri 8617697112 Independent Escort Service Mumbai
 
Sustainable Clothing Strategies and Challenges
Sustainable Clothing Strategies and ChallengesSustainable Clothing Strategies and Challenges
Sustainable Clothing Strategies and Challenges
 
Escort Service Call Girls In Shakti Nagar, 99530°56974 Delhi NCR
Escort Service Call Girls In Shakti Nagar, 99530°56974 Delhi NCREscort Service Call Girls In Shakti Nagar, 99530°56974 Delhi NCR
Escort Service Call Girls In Shakti Nagar, 99530°56974 Delhi NCR
 
Call Girls In Dhaula Kuan꧁❤ 🔝 9953056974🔝❤꧂ Escort ServiCe
Call Girls In Dhaula Kuan꧁❤ 🔝 9953056974🔝❤꧂ Escort ServiCeCall Girls In Dhaula Kuan꧁❤ 🔝 9953056974🔝❤꧂ Escort ServiCe
Call Girls In Dhaula Kuan꧁❤ 🔝 9953056974🔝❤꧂ Escort ServiCe
 
VIP Call Girls Ramanthapur ( Hyderabad ) Phone 8250192130 | ₹5k To 25k With R...
VIP Call Girls Ramanthapur ( Hyderabad ) Phone 8250192130 | ₹5k To 25k With R...VIP Call Girls Ramanthapur ( Hyderabad ) Phone 8250192130 | ₹5k To 25k With R...
VIP Call Girls Ramanthapur ( Hyderabad ) Phone 8250192130 | ₹5k To 25k With R...
 
BOOK Call Girls in (Dwarka) CALL | 8377087607 Delhi Escorts Services
BOOK Call Girls in (Dwarka) CALL | 8377087607 Delhi Escorts ServicesBOOK Call Girls in (Dwarka) CALL | 8377087607 Delhi Escorts Services
BOOK Call Girls in (Dwarka) CALL | 8377087607 Delhi Escorts Services
 
Green Banking
Green Banking Green Banking
Green Banking
 
(ANIKA) Call Girls Wagholi ( 7001035870 ) HI-Fi Pune Escorts Service
(ANIKA) Call Girls Wagholi ( 7001035870 ) HI-Fi Pune Escorts Service(ANIKA) Call Girls Wagholi ( 7001035870 ) HI-Fi Pune Escorts Service
(ANIKA) Call Girls Wagholi ( 7001035870 ) HI-Fi Pune Escorts Service
 
VIP Call Girls Moti Ganpur ( Hyderabad ) Phone 8250192130 | ₹5k To 25k With R...
VIP Call Girls Moti Ganpur ( Hyderabad ) Phone 8250192130 | ₹5k To 25k With R...VIP Call Girls Moti Ganpur ( Hyderabad ) Phone 8250192130 | ₹5k To 25k With R...
VIP Call Girls Moti Ganpur ( Hyderabad ) Phone 8250192130 | ₹5k To 25k With R...
 
VIP Call Girls Mahadevpur Colony ( Hyderabad ) Phone 8250192130 | ₹5k To 25k ...
VIP Call Girls Mahadevpur Colony ( Hyderabad ) Phone 8250192130 | ₹5k To 25k ...VIP Call Girls Mahadevpur Colony ( Hyderabad ) Phone 8250192130 | ₹5k To 25k ...
VIP Call Girls Mahadevpur Colony ( Hyderabad ) Phone 8250192130 | ₹5k To 25k ...
 
Call Girls In R.K. Puram 9953056974 Escorts ServiCe In Delhi Ncr
Call Girls In R.K. Puram 9953056974 Escorts ServiCe In Delhi NcrCall Girls In R.K. Puram 9953056974 Escorts ServiCe In Delhi Ncr
Call Girls In R.K. Puram 9953056974 Escorts ServiCe In Delhi Ncr
 
VIP Call Girls Service Chaitanyapuri Hyderabad Call +91-8250192130
VIP Call Girls Service Chaitanyapuri Hyderabad Call +91-8250192130VIP Call Girls Service Chaitanyapuri Hyderabad Call +91-8250192130
VIP Call Girls Service Chaitanyapuri Hyderabad Call +91-8250192130
 
webinaire-green-mirror-episode-2-Smart contracts and virtual purchase agreeme...
webinaire-green-mirror-episode-2-Smart contracts and virtual purchase agreeme...webinaire-green-mirror-episode-2-Smart contracts and virtual purchase agreeme...
webinaire-green-mirror-episode-2-Smart contracts and virtual purchase agreeme...
 
VIP Call Girl Gorakhpur Aashi 8250192130 Independent Escort Service Gorakhpur
VIP Call Girl Gorakhpur Aashi 8250192130 Independent Escort Service GorakhpurVIP Call Girl Gorakhpur Aashi 8250192130 Independent Escort Service Gorakhpur
VIP Call Girl Gorakhpur Aashi 8250192130 Independent Escort Service Gorakhpur
 
Environmental Toxicology (environmental biology)
Environmental Toxicology (environmental biology)Environmental Toxicology (environmental biology)
Environmental Toxicology (environmental biology)
 

DYNAMICS IN THE HISTORY AND ECONOMIC DEVELOPMENT OF MAN: REFOCUSING ON ECOLOGICAL DISTURBANCE AND CLIMATE CHANGE

  • 1. Advanced Energy: An International Journal (AEIJ), Vol. 10, No. 1, January 2023 DOI: 10.5121/aeij.2023.10101 1 DYNAMICS IN THE HISTORY AND ECONOMIC DEVELOPMENT OF MAN: REFOCUSING ON ECOLOGICAL DISTURBANCE AND CLIMATE CHANGE Mululu Chirwa Department of Geography and Environmental Studies, University of Zambia, Lusaka, Zambia ABSTRACT Man’s history and development endeavours have beenadvancing alongside a trail of ecological ramifications and climate change. Since prehistoric times, scientists have not recorded an accelerated shift in the ecologyof the planet during any other epoch beside that of modern man. The paper seeks to explore how man’s history and developmentaffects ecologyand climate. It uses desk analysis to recollect data from global assessment reportsand runs a One paired Sample Means t-Test, 1 tailed, 8 df, at Pearson Correlation value 0.458 and 0.5 alpha level. Findings show that, there is globalclimate change, seen in global warming trends; andimbalance in ecological footprint, seen in depletion of air, water and land sinks. The t-Test reveals significant net loss of global forest cover.The study also,apparently found that, processes ofdevelopment generally tend to damage ecology. Therefore,the study recommends a refocus to sustainable means of development. KEYWORDS Ecological Footprint, Climate Change, Sustainable Development, Built Environmental, Integrated Planning 1. BACKGROUND AND INTRODUCTION From age to age, the evolution of man has been proliferated by significant stages of development. According to mainstream history, man has long been advancing himself to find better means of meeting his needs (Arlt and Daviau, 2009). Unlike his earlier days on the planet, man’s motivation for development is now driven by a plethora of multiple contingencies (Wengrow, 2018). From the pre-Neolithic age when the urge to develop was primarily driven by survival instinct, today such motivation is also driven by pleasure, luxury, pride, and superiority (Hale, Ricotta, Freed, Smith, and Huang, 2019). His evolution followed a development path from the early, middle and late stone age; to the early and late iron age (Muhanna, 2017). From there, it advanced to the industrial revolution and the Age of computers or Artificial Intelligence (AI) (Ibid, 2017). Evolution significantly altered the way mankind works, produces, packages, trades, consumes and disposes, causing negative impact on ecology. The study endeavours to show how compromised mode of production, consumption and waste disposal projects on the future of the planet. It systematically analysis how history can teach us a lesson about how mismanagement of natural resource can jeopardize ecology. It also plots how human development has been advancing alongside the speedy loss of ecological footprint and exacerbating climate change. The first part of the paper defines the scope of the study area and outlines the problem statement; aim; objectives; hypotheses; research questions and rationale of the study. The second, defines
  • 2. Advanced Energy: An International Journal (AEIJ), Vol. 10, No. 1, January 2023 2 the key concepts and reviews their interplay of each other. The third partoutlines the methodology of the study indicating the target population, revealing sampling technique and outlining collected collection/ analysis. The fourth chapter presents and discusses the findings of the study. The fifth chapter draws the conclusions and makes recommendations about the findings of the study. 1.1 Scope of the Study Area The study has taken a global perspective of climate change because, first, the phenomenon can be established when the multiplicity of variables defining it are gathered across a relatively wide geographic scale(Harvey, 2018). Second, the matter of climate change is of global implication. The analysis selects some parts of the world where there are indicators pointing to climate change. 1.2 Statement of the Problem Human evolution has seen the development of man from one age to another. Civilization with its unyielding quest to make life easier made operations easier and speed up processes in raw material extraction, transport, communication, manufacturing, processing, trading, and the consumption of goods and services as well as wastedisposal. The industrial revolution of Europe in the late 1700s came with mass production and with it, mass generation of waste (Clark, 2014). The unprecedented effects were hazardous -pollution, environmental degradation and climate change. The consequences of these hazards are unforgiving -global warming, disturbance in weather patterns, loss of catchment, flooding, heightened frequency of tropical storms, loss of fresh air and water, outbreak of epidemics and disease, overcrowding in urban centers, sprawl, urban gentrification and depletion of green spaces (Rymarczyk, 2020). The study seeks to highlight this predicament in the light of man’s evolution. Although some studies have been done to show trends in climate change and its ramifications, their still remains much to be exploited about history’s direct contribution to the matter of climate change and environmental degradation. 1.3 Aim The aim of the study is to establish the extent to which human development has contributed to climate change and the erosion of ecological footprint over the past 500 plus years, and show how all this has affected quality of life on earth. 1.4 Objectives i. To explore the dispensations of human civilization over the past five plus centuries ii. To determine the extent of climate change over the past five plus centuries iii. To establish the correlation between human development and climate change iv. To assess the net change in global vegetative cover in a 67 year-period from 1948-2015 v. To ascertain the ecological ramifications of climate change on wildlife and the quality of human life 1.5 Research Questions Objective (i) What are the most important stages of human development in the past 500 years? Objective (ii)
  • 3. Advanced Energy: An International Journal (AEIJ), Vol. 10, No. 1, January 2023 3 Has there been climate change on earth within the past 500 years of human history? Objective (iii) Is there a correlation between human historical development and climate change? Objective (v) What impact has climate change had upon the ecology, biodiversity and quality of human life? 1.6 Hypotheses Objective (iv) Ho: There has not beenglobal net loss in forest cover over built environment duringthe 67-year period from 1948-2015. H1:There has been global net loss in forest cover over built environment during the 67-year period from 1948-2015. 1.7 Significance of the Study The study endeavours to surface information that can contribute to the debate around human development versus climate change. It assembles data that shows a clearer perspective about the way human history interweaves into the fabric of ecological transformation and climate change. Such knowledge can bridge the gap in literature on how human evolution plays a role in the path of sustainable development. Also, the study can provide global institutions, agencies, and NGOs with relevant data to help them prepare world trajectories against climate change. Apart from that, the information gathered can furnish civil engineers in environmental agencies with grassroot indicators for risk assessment, and to build instruments for measuring ecological depletion. This way, they can better inform policy. It can also serve as a guide for integrated planning among urban planners. The historical background of man’s development provides warning signs against impending doom to communities whose industrial advancement is still young and vibrant, such as in African and generally -the global south, so that they can avoid mistakes that more advanced civilizations made in the past. 2. LITERATURE REVIEW 2.1 The Historical Development of Man and Technology The history of man over the past 500 years can generally bedemarcated into the Neolithic Age, the Iron Age, the Age of Industrial revolution (Knowledge Explosion), andthe Age of Computers(Artificial Intelligence) (Scarre and Fagan, 2016). During the Neolithic period, man’s way of life was simple, with an economy mainly consisting of hunting and gathering on small- scale primitive subsistent farms(Ibid, 2016).Before BC2000, communities in many parts of the world except for the Middle East were primarily hunter-gatherers(Muhanna, 2017).Agriculture had not yet gained ground and settlement infrastructure was basically made up of small grass- thatched houses made out of mud (Arlt and Daviau, 2009). In the progress of time, populations grew and the Industrial Revolution began(Clark, 2014).Sources indicate that, it started in Britain during the 1700s following the explosion of knowledge in science and technology (Xu, David, and Kim, 2018). With the invention of a powered engine, it was now possible to harvest and process raw materials in larger quantities (Ibid, 2018). Countries across Europe and overseas began to industrialize and this came urbanization (Rymarczyk, 2020). According to Rymarczyk, urbanization came with pressure on settlement because, people needed constant water and food supply, shelter, education and health facilities, recreation and waste management systems.
  • 4. Advanced Energy: An International Journal (AEIJ), Vol. 10, No. 1, January 2023 4 From the foregoing, it seems undeniable that the industrial revolution is one of the most important transition of man’s development and appears to make the greatest impact on environmental degradation. This is because it came with mass deforestation, draining of marshes, emission of chlorofluorocarbons (CFCs), and discharge of effluence (Rymarczyk, 2020). All these resulted in the erosion of green spaces, the loss of biodiversity, drying up of surface water bodies, lowering of the water table, and pollution in all its forms (Rashid, Irum, Malik, Ashraf, Rongqiong, Liu, Ullah, Ali and Yousaf, 2018; Jorgenson, 2003). The industrial age has also seen another advancement in the development of man called the Computer Age. This heightened use of machine technology in almost all economic sectors has truncated another pressing demand for energy (Rymarczyk, 2020). The correlation between economic growth and environmental degradation seems to puzzle even the elite of elites. The dilemma is to reconcile the gap between advanced communities and those lagging behind by strengthening economies while preserving ecological footprint for posterity. 2.2 Climate Change According to Harvey (2018), climate change is the significant change in the overall pattern of weather defying the long-term pre-existing or natural conditions. Climate prevails over a long time and rarely changes. Suffice to note that, geological evidence shows that climate has been changing from epoch to epoch (Singer, 2006). The reasons for such changes are still being researched. Nevertheless, it is assumed that the modern human race (homo sapiens) and their associated technology have been on the face of the earth for less than 20 000 years, and 300 years ago climate change seems to have taken rapid shifts (Labat, Goddéris, Probst and Guyot, 2004). More robust assessment to unearth the way climate was changing in prehistoric times is being done to establish whether our contribution to the predicament is significant or not. Nonetheless, climate change itself is a part of a malfunctional ecosystem attempting to balance itself (Held and Soden, 2006). This indicates careless manipulation of both the living and non-living environment which are the sources of natural resources. Such things could have happened in the past, perhaps as a function of natural terrestrial or extra-terrestrial catastrophe. However, in man’s history, the age of industry has its fair share of contributing to the predicament. In the meantime, it is phrones is to act prudently and create a preventive strategy against future calamity. The first step is to understand the dynamics involved, and for the purpose of the study a historical exegesis of how human civilization once mishandled can disturb natural ecology has been used to establish such knowledge. 2.3 Ecological Footprint The earth is a unit mass of matter found in the dynamic complex of nature governed by universal laws. It is made up of an environment that functions by a symbiotic balance of living and non- living organisms. Ecology can basically be described as the interaction between the living and non-living environment as well as their sub-interaction to create natural balance and continuity (Rees, 2018). Ecology is a system that constitutes habitat and symbiotic relationships among organisms. Its footprint spans across the entire earth with an earth-atmosphere system is sustained by a complex network of interaction between endowments on the earth’s surface and atmospheric forces (Held, and Soden, 2006). For instance, if vegetative cover is sufficiently eroded, then river catchment is lost and the rate of evapotranspiration is reduced (Labat, et al., 2004). This in turn reduces the amount of rainfall received in a catchment. If such a situation is extrapolated across a broader space, then it significantly transforms the average conditions for smooth interaction in the earth-atmosphere system. Such global ramifications are due to erosion of the ecological footprint, which in this case can be defined as, the removal of original/natural resources (vegetative cover) of the earth.
  • 5. Advanced Energy: An International Journal (AEIJ), Vol. 10, No. 1, January 2023 5 The world in on a trajectory to find means of striking a balance to cope with the ‘poverty- environmental degradation’ trap. The most significant strides are seen in the advancement and implementation of the SDGs (UN-Habitat, 2019). This new trajectory has given birth to fresh concepts and methods in the field of planning, such as regional integration, inclusivity, mixed land-use, green building, garden city, and ‘city within a city’ (UN-Habitat, 2022). Therefore, planners have restructured the concept of planning to suit the growing needto preserve ecology. And so, land-use planning isreshaping to ensure integrated mixture of both natural and built environment (Dovey, Shafique, Van Ostrum and Chatterjee, 2021; Ibid, 2022).The study reveals the conflict between urbanization and ecology preservation. 2.4 Development and Climate Change Development refers to change of something, in this context, improvement or progress (Klasen, 2018). Man’s development implies advancement in the modus operandi to create capacity for meeting all of a population’s basic needs (Ibid, 2018). This definition rests upon the bedrock of optimal and balance of population. Optimal population refers to the sufficiency of a population to maximize its natural resource for its benefit, while balanced population refers to the ability of natural resources to sufficiently furnish the population size (Yumashev, Ślusarczyk, Kondrashev, and Mikhaylov, 2020; Rabie, 2013). While the ratio between population sizeto resource base is critical, it is the ability of the population to access basic needs of life that really matters. This involves the transformation of raw materials into products and services and avail them to the mass of the people (Yumashevet al., 2020; Klasen, 2018). The process of converting raw materials into finished goods often requires industry. The larger the population, the higher the demand and consequently the large the industries. If production is deficient, then goods and services become scarce which leads to inflation. Therefore, a healthy Gross Domestic Product (GDP) is key for the development of a country (Klasen, 2018). Also, the mass of the people should have access to these resources which would translate into favourable Human Development Index(HDI). The index refers to income per capita or the amount of money that an individual in a country will have to spend for an entire year if all the resources of the country were equally distributed (Ibid, 2018). This entails that, healthy economies inherently have individuals within a population sustaining enough buying power to decently meet all their basic needs and more (Chibuye, 2014). Nonetheless, economic growth must not override resource repletion and waste management. Otherwise, a growing economy that lacks resources to sustain it, alongside a contaminated environment compromises quality of life by brewing depravity, poverty, sickness and disease, hunger and starvation, and even death. For civilizations that have continued on the trajectory of economic development negating environmental concerns, the ravages of climate change have come with unforgiving consequences. 2.5 Climate Change and its Ramifications on Quality of Life Climate change has a telling impact upon the quality of both human and non-human life. The most obvious effects of climate change are witnessed in extreme weather, heat waves, tropical storms, torrential rains, floods, droughts, increased glaciation, and global warming (Bartke, Forster, Githiri, Jering, Kago, Schlimmer, and Sietchiping, 2021). These outcomes of climate change have both direct or immediate repercussions as well as indirect and long-range repercussions, impacting the quality of human life on earth. Quality of human life can be defined as the measure of access by a person to basic needs (Chibuye, 2014). The most basic of such needs is safety and security, food and nutrition, fresh water and air, health and descent shelter (UN-Habitat, 2018). Therefore, it always remains crucial to provide an environment that sustains the provision of these things. Hidden from the radar of economists and most developers are the
  • 6. Advanced Energy: An International Journal (AEIJ), Vol. 10, No. 1, January 2023 6 far-reaching damages caused by climate change. For example, climate change can cause heat waves that result in tropical storms leading todeath (Pieterse, 2010). Meanwhile, the ripple effects of tropical storms or tsunamis are the floods that sweep across houses causingwater pollution and consequently water-borne diseases(Nchito, 2007). Also, the torn down infrastructure sometimes leaves irreparable damage which bites into the economy, while the loss of lives leaves emotional scars (Vlek and Steg, 2007). Although we may perceive it to be a simple matter, the underlying reality is that, what really enablesany organism to exist is its host (environment) (Ndebele- Murisa, Mubaya, Pretorius, Mamombe, Iipinge, Nchito, Mfune, Siame, and Mwalukanga, 2020). 3. METHODOLOGY 3.1 Research Design and Approach The study is a desk analysis that surveyed data from a relatively large number of places in the world. Since the study sought to cover a wider geography, the desk analysis was more ideal (Bostley, 2019). The study recollected data from remote sensing surveys done by the ForestResource Assessment (FRA) (FRA, 2020). These were extracted from photo interpretation of a global sample of high-resolution imagery through a worldwide network of national experts. The surveys involved the use of modern remote sensing tools and methods. The study approach was a mixed method. Quantitatively, the study recollected large quantities of geospatial images, and therefore used the count of hexagonal pixels obtained from Landsat and Sentinel Mosaics. The recollected geospatial images were captured and measured by surveyors from the National Research Council(NRC) and the areal cover of ecology and trends in climate change was recorded year after year (NRC: 2015.Data on forest cover, was analysed using statistical testing. Meanwhile, qualitatively, the study explored data recollected from field surveys done by the FRA via interviews of indigenous people in several countries across the globe. 3.2 Sampling Technique The sample is drawn from a population of spaces mapped out of a global grid of equal area hexagons documented by the FRA. A stratified random sampling technique was used by the agency to conduct the survey and reduce uncertainty of the forest area change estimates. The technique was based on eighty (80) strata derived using a combination of twenty (20) Global Ecological Zones for categories of change in the cover of trees. The map under assessment hada total of about 430 000 remote sensing samples of hexagons covering 40 hectares and centroid spreading across 1 hectare from all over the world. Purposive sampling was used by the FRA to select indigenous people for interviews across several countries. Also, countries were selected based on evident disproportionate removal of forest cover or widespread built environment. Apart from these, the study also purposively sampled timeline analysis graphs and images from the NRC showing global trends in the change of climate. The graphs were selected based on the climatic index they were projecting and its significant contribution to the nature of climate and ecology. In this wise temperature, land, ocean, air, and vegetation sinks were part of the variables. 3.3 Data collection instrument The data was collected through carefully reading the Global Forest Resource Assessment report prepared by the FRA from the early 1700s upto the year 2020. The assessment was done from the data obtainedfrom remote sensing and survey. The FRA and NRC conducted remote sensing through the Collect Online Earth Platform, and Google Earth alongside Bing Maps to collect auxiliary data. Other modern geospatial tools with improved data entry, data visualization, review
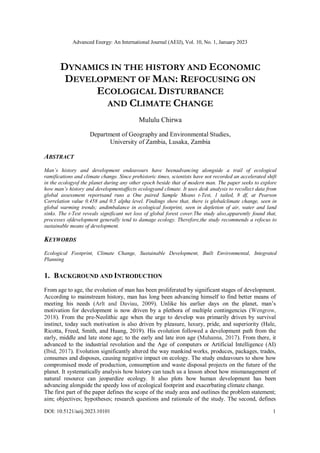
  • 7. Advanced Energy: An International Journal (AEIJ), Vol. 10, No. 1, January 2023 7 and analysis functions were also usedto collect data, especially from countries where forest information was limited or not available. The surveys were done via interview of local residents who were familiar with the geography of the selected countries.Finally,some pictures werealso recollected from the assessment reports and press releases. 3.4 Data Analysis The study analysed data from the global assessment reports on change of global forest cover over the years using a One paired Two Sample Mean t-Test at Pearson correlation 0.458, 1 tailed at 8 degrees of freedom and alpha level 0.5. The other data was interpreted from graphs showing trends of climate change over the years extrapolated from the global data assessment of greenhouse gases, temperature, forests, land and water sinks. These were compiled by the NRC using the Open Floris Collect Earth software tool to visually interpret about 213 000 sample plots. The Collect Earth tool was also used in the analysis of data to access and display high resolution images from Google Earth and Bing Maps. The assessment tool also generated grids through Google Earth Engine, that allowed ready access to Landsat and Modis image archives. 4. FINDINGS OF THE STUDY AND DISCUSSION 4.1 Pre-Historic Times and Climate Change 800, 000 years ago: The Ice Age Climate change is not a recent phenomenon. In the past epochs, the earth underwent various phases of climate change. One of the most recent traceable epochs of climate change is the Miocene epoch within which is encapsulated in the Ice Age (Rashid et al., 2018). During this epoch when modern human life had not yet evolved, the earth underwent climate change when global temperatures dropped below the ‘normal’ average. Temperatures drastically dropped all across the world and this phenomenon resulted in the freezing of almost all parts of the earthending most life forms(Rashid et al., 2018).One theory explaining this was the collision of a meteorite into the earth causing ecological catastrophe (Rashid et al., 2018; Rees, 2018). The other theory, advanced by some geological studies postulate that, the earth naturally undergoes periodic rise and fall in global temperatures(Rees, 2018). The graph in figure1 shows the trend of temperature during the Ice Age. One important observation made by the NRCon climate change during Ice Age and the post-modern climate change is the vast difference in temperature variation between them. During the Ice Age, after BC800 000 to around BC100 000, Carbon dioxide (CO2) and temperature levels in the atmosphere underwent cycles of change every 100 000 years. Each 100000 years division saw a rise and decline in temperature levels systematically. As the CO2 levels rose, so did the temperature and the vice versa. The cyclical pattern shows a system of balance in the climatic patterns separated by a 200 000 years interval. For instance,CO2 levels rose only upto a maximum threshold of 300parts per billion (ppb) during the entire ice age period and this was the time when temperatures also rose to a maximum average threshold of about +4o C. However, after the Ice Age, CO2 alongside temperature in the atmosphere have been increasing. As at 2010, the amount of CO2 in the atmosphere was over 390ppb varying from the maximum overage of the Ice Age by a staggering 90ppb.Compounded to this accumulation of excessCO2 in the atmosphere is the further addition of other heat retaining gases (CFCs) in the atmosphere such as Methane (CH4) and Nitrous Oxide (N2O), which together with carbon dioxide are accelerating the rise of global temperature.
  • 8. Advanced Energy: An International Journal (AEIJ), Vol. 10, No. 1, January 2023 8 Figure 1. Climate Change during the Ice Age Source: National Research Council, 2010d 4.2 Important dispensations of human civilization over the past five centuries From pre-historic times, human civilization has seen the development of technology from the simple to the complex. The human economy has advanced from hunting and gathering to agriculture, from agriculture to iron-working, and from Iron-working to the period of knowledge explosion which ushered in the industrial revolution in the 1700s. Invention during the industrial revolution gave way to the computer age or the age of artificial intelligence (AI). This series of indelible advancement in human civilization is shown in table 1. Table 1.Historic times and human civilization after the ice age S/N Yearsof Invention Age (Dispensation) Time-line (Period) Human Development (Civilization) 1 > BC10000 Prehistoric > 10, 000 Hunting &Gathering 2 BC10000s Neolithic 10, 000 – 2, 000 Agriculture& Settlement 3 BC2000s Iron Age 2, 000 – 500 Technology 4 AD1700s Industrial Revolution 500 – 200 Manufacturing& Urbanization 5 AD1900s Computer Age 200 - date Artificial Intelligence Source: Adapted by Author, 2022 These dispensations of human civilization have not gone without impacting the trends of global climatic shift. It may be true that the natural tendency of the earth is to undergo changes in weather patterns after a certain period. However, the rate at which the changes are happening in recent times is alarming. The phenomenon also reveals a seeming correlation between human civilization and climate change.
  • 9. Advanced Energy: An International Journal (AEIJ), Vol. 10, No. 1, January 2023 9 4.3 Extent of Climate Change during the past three centuries Findings of the study have also shown that, the reality of climate change has been radically observed in the past three centuries beginning from the late 1800s to the year 2000. During this period, there has been a phenomenal rise in global land and ocean temperatures. Temperature indices on both the land and continental plains have shown a rise such as never been recorded since pre-historic times. The sharp rise in temperature levels shows a net rise of a +6 score within only a space of approximately three centuries. The figure 4 shows the trends in the sharp rise of temperature within the 200 plus years. Figure 4. Rise in Global Temperatures in the past three centuries Source: https://nap.nationalacademies.org/read/14673/chapter/2#3 There is still more evidence of global climate change in the world today. For instance, the past two centuries have seen a rise in the atmospheric concentration of Carbon Dioxide (CO2). According to the earth system research, there has been a sharp and steady rise in the concentration of CO2 in the earth’s atmosphere. This means that, CO2 has continued to increase steadily in the atmosphere since the 1960s as shown in the figure 5.
  • 10. Advanced Energy: An International Journal (AEIJ), Vol. 10, No. 1, January 2023 10 Figure 5. Rise in Atmospheric CO2 Concentration in the world Source: National Research Council, 2011a It is not only the rise in CO2 concentration in the atmosphere but, findings also show that alongside are two other Chlorofluorocarbon gases that have also sharply risen. These are Methane (CH4) and Nitrous Oxide (N2O) which, just like CO2 are gases with High Heat Retention Capacity (HHRC). The diagram in figure 6 shows the trend of the three gases on the atmosphere for the past 2000 years. Figure 6.Sharp rise in Atmospheric CO2 CH4, and N2O Concentration in the world from the late 1800s. Source: National Research Council, 2011a According to the figure 6, during the past 2000 years in the period from 0AD upto the 1800s, the concentration of the three gases -CO2, CH4, and N2O was relatively the same. Findings show that, there was no significant rise. The lab tests reveal that, within the period from 0AD to 1800AD, on average CO2 only had a concentration range variation of about 15parts per million (ppm), CH4 had a concentration range variation of only about 250ppb, while N2O had a concentration range variation of only about 15ppb. However, the graph shows that immediately after the late 1800s, all three gases shot up to levels never seen before. For example, CO2 shot up from its normal
  • 11. Advanced Energy: An International Journal (AEIJ), Vol. 10, No. 1, January 2023 11 average of 280ppm in the year 1880 to a staggering 380ppm in the year 2000, N2O shot up from 270ppb in 1880 to about 320ppb in the year 2000, meanwhile CH4 shot up from an average of 800ppb in 1880 to a whooping 1950ppm in the year 2000. It is the margin of variation in concentration of the gases that is alarming. For example, CO2 concentration in the atmosphere stayed the same from 1800 years at an average of only 280ppm while in the last 200 years it has risen to a maximum average of 380ppm. Also, the variation between the AD1800 years and last 200 years is disproportionately insurmountable. For instance, there was minimal range of only 15ppm in the 1800 period but this changed in the last 200 years to become a range of 100ppm. This produced a net surplus of about 75ppm of atmospheric CO2 concentration within the last 200s year of the past AD2000 years. The same goes for N2O whose range was also 15ppb within the 1800 years dispensation, but later suddenly shot up to a range of 50ppm, producing a net surplus of 35ppm of N2O concentration in the atmosphere during the last 200 years. Methane equally became more abundant in the atmosphere. From the range of 250ppb during the AD1800 years to a phenomenal 1,150ppb range variation in the last 200 years, producing a net surplus of about 900ppbs of CH4 concentration in the atmosphere. This insurmountable increase in concentration of the three gases in the atmosphere in the past 200 years in comparison to the 1800 years before clearly indicates an abnormality that seems to have transpired after the late 1800s. It is also interesting to note that this period which marks the sharp rise in CFC gas concentration coincides with the industrial revolution. The industrial revolution in Europe began in the late 1700s and by the late 1800s, various factories had spread across most European countries and CFC gas emission started skyrocketing. As industry and urbanization gained momentum in human society, so did CFC emission. Therefore, there is a correlation between human development and climate change embedded in the mutual relationship between industry and increased emission of CFCs into the atmosphere. Apart from that, the change in land-use from simplistic Neolithic (agrarian) rural communities to the complex industrial urban communities, has seen a general depletion of the two most significant components of the eco-system -land and water. Research has shown that within the past 200 years, land and water resources have drastically reduced. This has compounded the problem of CFC emission thus expediting climate change. The figure 7 shows a summary diagram of how factors combine to produce an atmosphere of increased CFC concentration. According to the findings, the use of fossil fuels to run industry has significantly changed the use of land and water. This means that fossil fuel consumption due to industry has reduced land and ocean sinks. This in turn has resulted in proliferated rise in CFC concentration in the atmosphere predisposing the earth to global warming and climate change.
  • 12. Advanced Energy: An International Journal (AEIJ), Vol. 10, No. 1, January 2023 12 Figure 7.Interplay of industry and land-use change in CFC gas atmospheric concentration Source: National Research Council, 2011a 4.4 Man’s Disturbance of world Ecology and contribution to Climate Change Unlike in Neolithic times, the advent of industry, has seem mankind grossly disturb several aspects of ecology and climate. Among the critical elements that mankind has affected in ecological balance in vegetation cover or more specific -forest cover. The study sought to uncover the extent to which human activity has removed or replenished forest cover on earth. In order to establish this, a 67-year period was selected from the year 1948 when more concrete data on global forest cover was recorded by FAO to the year 2015 when the last consolidated forest assessment report was released. 4.4.1 A Timeline Ratio of Natural Vegetative Spatial cover against Brown Spaces In order to comprehend the gravity of the ecological transformation across the globe, it is imperative to consider the ratio of forest cover relative to how much cover is removed within a certain period. Such an analysis provides insight into the trends of how deforestation has reduced forest cover in the progress of time. Finding of the study are shown in the table2 indicating the trend of global forest cover and how it has been depleting over time.
  • 13. Advanced Energy: An International Journal (AEIJ), Vol. 10, No. 1, January 2023 13 Table 2. Global Ecological Deficit through a Timeline Ratio of Vegetative Cover against its removal Year Global Forest Cover (Billion Hectares) Net Global Forest Change Annual Net Change Global Brown Spaces Ecological Deficit 1948 4.0 - Not Reported Unclear Unclear 1953 3.8 -0.2 Not Reported Increased Yes 1958 4.4 +1.4 Not Reported Decreased No 1963 4.1 -0.3 Not Reported Increased Yes 1988 3.6 -0.5 Not Reported Increased Yes 1990 3.4 -9.9 Not Reported Increased Yes 1995 3.4 -11.3 Not Reported Increased Yes 2000 3.8 -9.4 -0.18 Increased Yes 2005 3.8 0 -0.11 Increased Yes 2010 4.0 +0.2 -0.08 Decreased No 2015 3.99 -0.01 -0.08 Increased Yes Source: FAO Assessment Reports For the most part, the period from the year 1948 to 2015 has seen a sustained erosion of vegetation across the globe. The direct inference of this is generally ecological deficit. Approximately, out of the 10 dispensations observed, 80% of them showed ecological deficit and only 20% showed surplus. This significant (80%) difference in ecological deficit indicates that, the world is consuming more of vegetation than it is replenishing. A typical example is about countries on the African continent which are now exploiting forests at an increasing rate. According to the FAR (2005), in Africa, overall progress towards sustainable forest management in the continent appears to have been limited during the last fifteen years. There are some indications that net loss of forest area has slowed down and that forest areas designated for conservation of biological diversity has increased slightly. However, the continued, rapid loss of forest area – the largest of any region in the world during this 15-year period – is particularly disconcerting. This is a similar story for even other parts of the global south such as India, South America and some parts of the Middle East. 4.4.2 Net Loss of Global Forest Cover over a 67-year period (1948 to 2015) There has been a net loss of forest cover between the year 1948 to 2015. This net loss is as a result of the rate at which forest cover has been eroded and seemingly replaced worldwide. The trends reveal a pattern of fluctuation in removal and replacement of forest cover. However, according to the findings of the study from an assessment of past records, the final correlation yields a negative t-Statistic value of -0.185 which indicates an overall net loss. The table 3 shows the findings after running a One-tailed, paired Two-Sample Means t-Test which yielded a significant result. Findings were that the p-value was 0.429 which was less that the Pearson correlation of 0.458. Also, the t Statistic (-0.185) is less than the t Critical (1.860) at one tail. Therefore, from the foregoing, the result shows a negative correlation indicating a global net loss of forest cover in the period between 1948 and 2015.
  • 14. Advanced Energy: An International Journal (AEIJ), Vol. 10, No. 1, January 2023 14 Table 3. A Paired Two Sample Means t-Test of forest cover from the year 1948-2015 t-Test: Paired Two Sample for Means Forest Cover Billion Hectares Forest Cover Billion Hectares Period of change (years) before after 1948 - 1953 4 3.8 1953 - 1958 3.8 4.4 1958 - 1963 4.4 4.1 1963 - 1988 4.1 3.6 1988 - 1990 3.6 3.4 1990 - 1995 3.4 3.4 1995 - 2000 3.4 3.8 2000 - 2005 3.8 3.8 2005 - 2010 3.8 4 2010 - 2015 4 3.99 Mean 3.81111111 3.83222222 Variance 0.10611111 0.10959444 Observations 9 9 Pearson Correlation 0.4576021 Hypothesized Mean Difference 0 df 8 t Stat -0.1851479 P(T<=t) one-tail 0.42886044 t Critical one-tail 1.85954804 Source: Generated by Author, 2022 Therefore, from the foregoing, the Null Hypothesis (Ho) which states that there is no net loss of vegetation over built environment in the world between the year 1948 to 2015 is rejected, while the Alternative Hypothesis (H1) which states that there is a global net loss on forest cover over built environment between the year 1948 to 2015 is accepted. Consequence, such a significant net loss ought to be checked, lest the trend continues and the global loss of vegetation cover increases exponentially with the passage of time. And if this happens, the ramifications of ecological imbalance will ravage the planet at dangerous levels. 4.5 Global Ramifications of Ecological Disturbance and Climate Change 4.5.1 The Ecological ramifications of Climate Change The ecological implications of climate change can be seen in the drastic change of average temperature. Findings reveal that temperatures in the stratosphere have been dropping, while temperatures in the troposphere have been rising above the normal average. The figure 9 shows the cooling trends in the stratosphere and the warming trends in the troposphere in the period between 1960 to 2010. This means that those temperatures in the upper part of the atmosphere are significantly dropping below the normal. Meanwhile, temperatures in the lower part of the atmosphere with which we mostly interact are rising to disproportionate levels. The rise of temperature in the troposphere has led to the predicament called global warming. Generally, all eco-systems on earth directly interact with the troposphere. Infact, the earth-atmosphere system
  • 15. Advanced Energy: An International Journal (AEIJ), Vol. 10, No. 1, January 2023 15 basically comprises the land, water, vegetation and all the weather elements of the troposphere. Therefore, a rise in temperature affects all the aspects of ecology. An analysis of the collective impact of different factors in the earth-atmosphere system shows a net effect of human activity as being the largest contributor to global warming. The study established that there are some factors that influence of cooling and warming of the atmosphere. Among these factors include the emission of greenhouse gases, depletion of ozone, availability of water vapor, surface reflexivity, particle and cloud reflexivity. According to the findings, greenhouse gases emitted largely through human activity (industry and urbanization) is the greatest contributor to global warming. The gases which mainly include CO2, N2O, and CH4 have high HRC, and therefore trap heat in the atmosphere. These gases can stay within the atmosphere for a span of between 10 to 30 years and continue to absorb and contain heat for as long as they are present. Figure 9. Cooling and Warming trends in the Atmosphere Source: National Research Council, 2011a Apart from the three CFCs aforementioned, other gases such as Carbon Monoxide (CO) and Sulphur Dioxide (SO2) which are continuously released from mines and manufacturing industries are largely responsible for the depletion of ozone (O3). These gases tend to split O3 by extracting an oxide (O) from it so that it becomes oxygen (O2). The findings show that depletion of O3 is creating increased warming conditions due to increased penetration of Ultra-Violet Radiation (UVR) and other thermal energy waves into the atmosphere. Water vapor content has also reduced as temperatures rise further. Surface reflexivity has been affected by two factors with counteracting effects. For instance, land-use that is now mainly characterized by urban built environment has greatly increases reflexivity, thereby raising temperatures. Additionally, soot from carbon which collects on snowflakes reduces reflexivity and generally create warmer conditions in the atmosphere. The figure 10 shows a summary of the interplay of natural and human influence upon the balance of the earth-atmosphere system. The figure shows how human beings are altering the natural course of atmospheric temperature equilibrium. Given a collection of all the factors at play in the earth-atmosphere system, there interaction has ultimately led to an energy net gain from both natural influences and human activity. Most importantly human activity has transcended its impact on global warming against natural factors on a scale of 1: 2.5.
  • 16. Advanced Energy: An International Journal (AEIJ), Vol. 10, No. 1, January 2023 16 This significant difference in the ratio to which human activity is far exceeding natural influence in global warming places the catastrophe of climate change solely upon human beings. The greatest contributor to the earth- atmospheric ecological imbalance is greenhouse gas emission and these are a direct by-product of industry and urbanization. Figure 10.Interaction of natural and human Influence on the average temperature of the atmosphere Source: National Research Council: 2010d Apart from the atmospheric part of the earth-atmosphere system, climate change has also adversely affected the earth part of the system. In this way, the land, water and vegetation resources have been altered in composition and functionality. For instance, sources indicate that oceanic potential Hydrogen (pH) has been dropping insurmountably. According to the studies, between the years 1989 to 2007 the oceanic pH within the depth of about 0-30 meters have dropped from an average of 8.12 down to about 8.08. This poses a danger not only to aquatic but terrestrial life as well. Lower pH entails decreased alkaline conditions and increased acidity, a predicament with high chances of further repercussions on other parts of the environment and biodiversity. Apart from the decrease in pH, the quantity of seaweed has also been increasing following the rise of CO2 content in the atmosphere. For instance, studies show that the consumption of CO2 by seaweed between the year 1989 to 2007 has increased from a volume of 330 units to about 360 units, giving a net excess of 30 units. This scenario if depicted in the figure 11 showing how seaweed is steadily increasing alongside CO2 and how the oceanic pH is also decreasing.
  • 17. Advanced Energy: An International Journal (AEIJ), Vol. 10, No. 1, January 2023 17 Figure 11. Escalating seaweed alongside CO2 and the dropping of oceanic pH Source: National Research Council: 2010d The increase in seaweed following increased volume of CO2 means that invasive species are multiplying at an alarming rate threatening natural species. This entails that aquatic life is endangered and so are other aspects of vegetation and animal life that survive on aquatic creatures. This challenge rallies alongside acidity of the water bodies that pose a threat to life in any of its form that survives at an average pH. The general shift in ecological composition of different ecosystems is also fast changing biodiversity. Findings also reveal that, subtle shifts in gaseous composition, pH levels and temperature degrees are resigning the ecological footprint. The predicament is recreating natural habitation into something unfamiliar to the existing biodiversity. The current natural environment being suited to the excising conditions are likely to experience a struggle to adapt to the new changes in ecological construction. This will entail that other species may emerge that are better suited for the new conditions and this leads to the development and evolution of foreign/invasive species. It may not be so clear as to what the foreign species adapted to the new ecology can do but at least some studies have revealed that most of such species are invasive and terribly harmful to the current species. A typical example if the black beetle found the Californian forests which has ravaged the vegetation there to the brink of extinction. The beetle literally feeds on entire branches removing chlorophyl and sucking the life out the plants. The photo in figure 12 shows how the black beetle has ravaged a forest in California -USA. Figure 12. How the invasive Black Beatle has ravaged a forest in California Source: National Research Council: 2010d
  • 18. Advanced Energy: An International Journal (AEIJ), Vol. 10, No. 1, January 2023 18 In Africa, Zambia in particular, number of invasive species have evolved apart for the Kafue weed such as water hyacinth. These weeds have mainly been a source of the destruction of crops in the areas where they have appeared. They have made agriculture almost impossible in the areas where the Kafue River passes. Other invasive species in Zambia include the MimomsaPigra plant from South America, which is ravaging wildlife especially in the area around the Kafue flats. 4.5.2 Social-economic Ramifications of Climate change Climate change has phenomenal impact upon human life. The unprecedented shifts in weather patterns have produced catastrophe such as floods and outbreak of disease in several parts of the world. Global warming has not only raised the sea levels but created conditions favorable for certain fleas to survive. Various microbes harmful to human health such as the bacteria and viruses like the Chaleo Vibrio (Cholera Virus) has in modern history ravaged Europe, Asia and Africa (Ndebele-Murisaet al., 2020). Although Europe and Asia contained the situation in the early 1900s, Africa and India seemed to have failed for the most part to contain it. The predicament seems to affect the two localities on earth perhaps due to the abundance of informal settlements or slums in urban areas. It is these spaces of urban blight where bacteria and viruses that cause water bone diseases are commonly found. This is probably due to their unsanitary conditions. And so, the challenge of informal settlement becomes top priority in forwarding the urban agenda on several international forums. In the most recent years, during the period between 2020-2022, a strange virus called Corona Virus -19 (COVID) emerged and enveloped most countries with cooler climatic conditions. It was viewed by the WHO that the virus flourishes best in temperate regions where temperatures where relatively quite low. Nonetheless, it is interesting to note that the same virus as well as its hybrid still spread to countries in the tropics (mostly found in Africa) and infected large populations as well (Chigbu and Onyebueke, 2021). This is indicative that temperatures in Africa during the cold season have dropped below the normal. Throughout the world, millions of people lost their lives at a rate never experienced before since the last outbreak of small pox. Perhaps, COVID-19 was the first tip of the iceberg showing us the fate a future whose ecology is completely distorted. Overall, we can also say that climate change has a cost implication upon the lives of people. the economic implication is created by the loss of human resource, infrastructure breakdown, and the disruption of trade and commerce. The COVID -19 pandemic literally halted the peak performance of business. Many people lost employment during the 2020-2021 lockdown (Chigbu and Onyebueke, 2021). Generally, the laws of supply and demand were grossly disturbed and this was typically seen in the agriculture sector in United States of America, where gallons and gallons of milk was disposed-off into canals as refuse due to lack of demand. The world was clearly headed for an economic meltdown similar to that of 2008. 4.6 The Future of Global Ecology and Climate Change Findings show the pillars upon which human survival and advancement is premised upon in order to project like-hood of ecological depletion,thus, unveil the future of climate change. Findings also reveal that humanity is grappling with a dichotomyof population change and poverty across the globe. These are matters that have grave ramifications upon ecological preservation (UN- Habitat, 2022; Giddings, Hopwood and O’Brien, 2002). The two matters are also significantly part of the motivation behind human technological advancement and the quest to develop. As a matter of fact, the two are among the Sustainable Development Goals (SDGs). Findings also show that, in an attempt to attain such goals, the global community is contending with a complex situation whereby, development naturally demands supply from the ecology, while the ecology also demands replenishment. Failure to reconcile the twois likely to breakdown ecological
  • 19. Advanced Energy: An International Journal (AEIJ), Vol. 10, No. 1, January 2023 19 stamina and unleash all the dangers of climate change. Therefore, the concept of sustainable development becomes handy but also complicated at the same time. In order to understand the potential of population change in the matters of climate change, the section that follows maps out populations change across the world. This is to give light into the situation obtaining in the world about how much needs to be addressed to aid the status quo for most parts of the world. 4.6.1 Population Change in the trajectory of world Ecology and Climate Change The world map in figure 2 shows the population change across the world in the period between 1990-2013. Figure2. Mapping of Population Change against Potential Climate Change around the world Source: Adapted from FAO Assessment Report, 2015 According to map evidence, much of the world falls in the category of between 25 to >100 percent increase in population and only less than 25 percent have minimal, zero, or negative growth. This shows the recent historical trajectory of world population dynamics. Populations are generally expanding and this is increasing the pressure on development agendum for many nations. Extremely few (<5 percent) countries which are located in the Scandinavian world are the ones that have attained an impressive global trajectory with a promising future for decreased pressure upon natural ecology. If the majority are still striving with efforts to reach zero or negative increase in population, then the challenge of population pressure upon the ecological footprint continues. This in turn culminates in ripple concerns over the climate change issues. All the parts of the world with increase in population are mapping out areas of potential ecological degradation. And unless measures are put in place, the world still risks chances of losing the ecological footprint. 4.6.2 Poverty in the trajectory of world Ecology and Climate Change As mentioned earlier, in section 4.3, the other factor motivating ecological erosion is the relentless quest to alleviate poverty across the world. Poverty is a social-economic ill in human society and it is one of the main issues being addressed by global communities. Findings show that, this zest to make as many people access basic social and economic needs has a telling
  • 20. Advanced Energy: An International Journal (AEIJ), Vol. 10, No. 1, January 2023 20 impact on the environment because the obvious instruments are industry and technology. However, these engines of mass production escalate the consumption of natural resources and serve to accelerate the rate of ecological degradation and climate change. As at 2015, the prevalence of poverty in the world according to FAO is shown in the figure 3.As shown in the findings, literally the entire global south including parts of Central Africa, Central America, India and the islands of East Indies, except for Australia is still ravaged by poverty and this state of affairs calls for more implementation of developmental plans. If there are still traces of large portions of land ravaged by poverty, then there is still greater potential for developers to deplete the ecology. Figure 3. Mapping of poverty against the potential of Climate Changeacross the globe Source: Adapted from FAO Assessment Report, 2015https://nap.nationalacademies.org/read/14673/chapter/2#3 It is the exploitation of natural resource which further robs it of the natural elements needed to support healthy conditions on the planet. And if this potential for further exploitation exists, then the future of climate change is still in limbo. Today, there are not so many ways of alleviating poverty except through developmental agendas that resort to depletion of natural resource. Strides are being initiated to develop ways of combating poverty with minimal damage to the ecology. Nonetheless, such strides are still insufficient to reach the mass number of people who still need to be salvaged from the shackles of poverty especially in Africa. 4.6.3 Economic development in the trajectory of world Ecology and Climate Change Findings of the study have established that there is a correlation between human development and climate change. Human development has dictated the pace of land use change and led to increased emission of greenhouse gases. Primarily change of land-use in the past 200 years has been characterized by the establishment of industries and the spread of urbanization. Compounding this land-use changes is the continued rapid growth of human population cross most parts of the world. The meaning of such population growth in the dynamics of climate change is that, industry will continue releasing of greenhouse gases and temperatures are likely to continue rising (Harvey, 2018). The double flanked problem is that, industry and urbanization consume massive amounts of natural resources in terms of land, water and forest, while at the same time emitting greenhouse gases. This means that ecological erosion and pollution are happening at phenomenal rates around the globe at phenomenal (Ibid, 2018).
  • 21. Advanced Energy: An International Journal (AEIJ), Vol. 10, No. 1, January 2023 21 Another critical component of the ecology has been introduced in the mix of land and oceanic degradation -forest cover. This is yet another aspect of the ecology that has been significantly impacted by human development. Again, both industry and urbanization has grossly reduced forest cover across the world. Today, there is nothing exploited by industry more than forests. Many sectors of the economy demand timber, and so, the lumbering industry has received more attention that several others. The challenge in the industry is that trees are not only exploited to produce manufactured goods in industries but are also indiscriminately cut down for clearance to establish industrial plants or even settlement as well as shifting cultivation (Cudworth, 2005). This makes forest cover one of the most threatened aspects of the ecology. The global trend across history shows that brown spaces are not only draining marshes but swallowing up forest cover. The world map today shows how the built environment is encroaching green spaces and overtaking vegetative cover. Although urban planning seems to be taking sustainable planning concepts to include green spaces, this kind of integrated planning has largely been ignored in the past 200 years by many communities in the world (UN-Habitat, 2020; Mori and Christodoulou, 2012). This is especially common in the global south were unplanned or informal settlements are rife. It is an international urban challenge which the UN seeks to address in this 21st century but so far has recorded minimal success (UN-Habitat, 2022). Despite efforts to transform planning into a means of establishing smart cities to incorporate greening, brown development continues to override in many cases. For example, shopping malls in urban centres have for some time removed vegetation and paved vast spaces depriving land sinks and vegetative cover. There are now new approaches and concepts in planning that seek to address such issues.The figure 8 shows how brown spaces are predominant the green spaces. Figure 8.Spaces of brown development and degrees of potential for deforestation Source: FAO Assessment Report, 2015 All the spaces mapped out with brown are areas of high deforestation due to peak industrialization. Those are spaces most vulnerable to desertification. Nevertheless, they are also communities that have taken matters of forest management more seriously that the spaces mapped-out in brighter colours. It also seems that the communities that are less developed have more forest cover compared to that are developed. Perhaps the developed countries depleted their forests in a bid to attain development. And this becomes the trap thesis of poverty. If development will come to the global south and poverty should be eradicated, then deforestation
  • 22. Advanced Energy: An International Journal (AEIJ), Vol. 10, No. 1, January 2023 22 must rise to a certain threshold. And yet with deforestation also comes climate change and other ecological ramifications. 5. CONCLUSIONS The advancement of human so-called civilization from Prehistory, Neolithic, Iron, Technology, Industry, and Artificial Intelligence are forerunners of quantum ecological transformation. Prehistoric and Neolithic times have shown a more natural/normal curve of ecological cycles. The iron age increased productivity and structured human settlement of human without significantly altering ecology. Agriculture consumed forest and iron-working expedited this but also without significantly disturbing ecology. Arguably, the industrial revolution has contributed the greatest deal to ecological disturbance and climate change. The late 19th century began to realize higher levels of CFCs and temperature in the atmosphere. This period upset a chain reaction and other parts of the ecosystem such as water and land reacted to the atmospheric restructuring. All these changes inevitably began to impact biodiversity in terms of flora and fauna both in terrestrial and aquatic domains. The industrial revolution has spread across the globe and its concomitant ecological ramifications have followed it. The industrial revolution has also precipitated the birth of further technological advancement called artificial intelligence. This is the current trend of human achievement and is dictating the pace of productivity and economic development. Nonetheless, economies of various countries that are still developing must be reoriented on the path of sustainability to stop the possibility of future catastrophe. Therefore, urgent action to curb the escalating ecological disturbance through integrated conceptual planning and initiatives from the SDGs ought to be quickly implemented to protect the planet from impending doom. ACKNOWLEDGEMENTS I thank the Almighty God for the opportunity to write this paper and to make my submission to the CiVEJ and AIRCC. Firstly, I thank the Academia forum for the notification online which alerted me about the chance to make the submission. Secondly, I also thank Mrs. Sinkamba J.N., Dr. Muchanga M.,Miss Chilufya K., Miss Chirwa F., Mr. Kaulule C., Mr. Phiri G. and Miss Tembo G., for their continued support in my scholarly and academic endeavors. I am also grateful to Dr. Chibamba D., Eld. Mwika G., and Mr. Chirwa R., for their encouragement as I wrote. I thank my Eco-club team for their zeal for community development which continues to be a beckon of hope rekindling the drive in me to help informal settlements. I lastly thank my family for moral support. REFERENCES [1] Arlt, H. and Daviau, D.G. eds., 2009. Culture, Civilization and Human Society–Volume II (Vol. 4). EOLSS Publications. [2] Bartke, S., Forster, T., Githiri, G., Jering, A., Kago, J., Schlimmer, S. and Sietchiping, R., 2021. The UN-Habitat Urban-Rural Linkages Guiding Principles: Assessment of the Adoptability to Topical Land Management Challenges in Germany, Kenya and Tanzania. In International Yearbook of Soil Law and Policy 2019 (pp. 369-398). Springer, Cham. [3] Bostley. A., 2019. Basics of Research Design: A Guide to selecting appropriate research design. 6. 76 - 89. [4] Chibuye, 2014. InterogatingUtban Poverty Lines. Oxford [5] Chigbu, U.E. and Onyebueke, V.U., 2021. The COVID-19 pandemic in informal settlements:(re) considering urban planning interventions. The Town Planning Review, 92(1), pp.115-121. [6] Clark, G., 2014. The industrial revolution. In Handbook of economic growth 2, 217-262. Elsevier.
  • 23. Advanced Energy: An International Journal (AEIJ), Vol. 10, No. 1, January 2023 23 [7] Dovey, K., Shafique, T., van Oostrum, M. and Chatterjee, I., 2021. Informal settlement is not a euphemism for 'slum': what's at stake beyond the language? International Development Planning Review, 43(2). [8] Evidence, Impacts, and Choices: PDF Booklet. 2015. Washington, DC: The National Academies Press. https://doi.org/10.17226/14673. [9] Food and Agriculture Organization of the United Nations. 2020. Global Forest Resources Assessment. https://www.fao.org/forest-resources-assessment/remote-sensing/global-ecological-zones-gez- mapping/en/ [10] Giddings, B., Hopwood, B. and O'brien, G., 2002. Environment, economy and society: fitting them together into sustainable development. Sustainable development, 10(4), pp.187-196. [11] Habitat, U.N., 2019. The strategic plan 2020-2023. [12] Habitat, U.N., 2022. World Cities Report 2022: Envisaging the Future of Cities. [13] Habitat, U.N., 2018. Tracking progress towards inclusive, safe, resilient and sustainable cities and human settlements [14] Hale, A.J., Ricotta, D.N., Freed, J., Smith, C.C. and Huang, G.C., 2019. Adapting Maslow's hierarchy of needs as a framework for resident wellness. Teaching and learning in medicine, 31(1), pp.109-118. [15] Harvey, L.D., 2018. Global warming. Routledge. [16] Held, I.M. and Soden, B.J., 2006. Robust responses of the hydrological cycle to global warming. Journal of climate, 19(21), pp.5686-5699. https://www.scribbr.com/statistics/t-test/ [17] Jorgenson, A.K., 2003. Consumption and environmental degradation: A cross-national analysis of the ecological footprint. Social Problems, 50(3), pp.374-394. [18] Klasen, S., 2018. Human development indices and indicators: A critical evaluation. Human Development Report Office Background Paper, 1 [19] Labat, D., Goddéris, Y., Probst, J.L. and Guyot, J.L., 2004. Evidence for global runoff increase related to climate warming. Advances in water resources, 27(6), pp.631-642. [20] Muhanna, E., 2017. The World in a Book. In The World in a Book. Princeton University Press. [21] National Research Council: 2011d [22] National Research Council: 2010d [23] Nchito, W.S., 2007. Flood risk in unplanned settlements in Lusaka. Environment and Urbanization, 19(2), pp.539-551. [24] Ndebele-Murisa, M.R., Mubaya, C.P., Pretorius, L., Mamombe, R., Iipinge, K., Nchito, W., Mfune, J.K., Siame, G. and Mwalukanga, B., 2020. City to city learning and knowledge exchange for climate resilience in southern Africa. PloS one, 15(1). [25] Pieterse, J.N., 2010. Development theory. Sage. [26] Rashid, A., Irum, A., Malik, I.A., Ashraf, A., Rongqiong, L., Liu, G., Ullah, H., Ali, M.U. and Yousaf, B., 2018. Ecological footprint of Rawalpindi; Pakistan's first footprint analysis from urbanization perspective. Journal of Cleaner Production, 170, pp.362-368. [27] Rees, W., 2018. Ecological footprint. In Companion to environmental studies (pp. 43-48). Routledge. [28] Rymarczyk, J., 2020. Technologies, opportunities and challenges of the industrial revolution 4.0: theoretical considerations. Entrepreneurial business and economics review, 8(1), pp.185-198. [29] Scarre, C. and Fagan, B.M., 2016. Ancient civilizations. Routledge. [30] Singer, S.F., 2006. Unstoppable global warming: Every 1,500 years. Rowman & Littlefield [31] Vlek, C. and Steg, L., 2007. Human Behaviour and Environmental Sustainability: Problems, Driving Forces, and Research Topics. Journal of social issues, 63(1), pp.1-19. [32] Wengrow, D., 2018. What makes civilization? the ancient near East and the future of the West. Oxford University Press. [33] Xu, M., David, J.M. and Kim, S.H., 2018. The fourth industrial revolution: Opportunities and challenges. International journal of financial research, 9(2), pp.90-95. [34] Yumashev, A., Ślusarczyk, B., Kondrashev, S. and Mikhaylov, A., 2020. Global indicators of sustainable development: Evaluation of the influence of the human development index on consumption and quality of energy. Energies, 13(11), p.2768.
  • 24. Advanced Energy: An International Journal (AEIJ), Vol. 10, No. 1, January 2023 24 AUTHOR Mululu Chirwa is a qualified Spatial Planner and Educator of Geography with experience in field research. He is a holder of a MSc degree in Spatial Planning. He is a researcher and a writer with deep interest in civil engineering and spatial planning. He patronizes an Eco-Club where he inspires and cultivates innovation and technology to offer solutions to community challenges. Mululu is also passionate about reshaping informal landscape and improving the lives of the vulnerable in society. He has done research and written an article to help foster resilience in two informal settlements in the city of Lusaka. He is currently working to expand the Eco-Club into a more formidable organization to encompass stakeholders that can help merge ideas with practice to help informal communities. He is also the section head -Geography at Kabulonga Girls Secondary School of Lusaka. Mululu also won two awards of excellence in applied sciences at the University of Zambia during a postgraduate seminar presentation among a group of 84 participants. He also pioneered a team of students to win an award in a ‘smart city’ challenge competition organized by Plan International and Worldwide Fund.