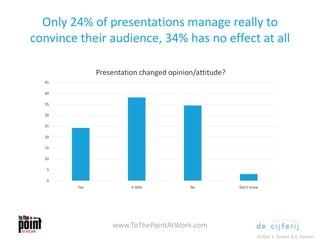
The
economic
impact of
presentations
www.ToThePointAtWork.com
©2014 E. Gruwez & K. Vanseer
Survey info
Survey
Performed by ‘To The Point’ and ‘De Cijferij’
March 2014
Online – via BVIC and Linkedin
Sample
273 participants in large organisations
from 18 different countries
evaluated 780 presentations
Representativity
Unweighted results – Free participation
First preliminary survey as a basis for more advanced scientific enquiry
www.ToThePointAtWork.com
©2014 E. Gruwez & K. Vanseer
Time spent on presentations
www.ToThePointAtWork.com
©2014 E. Gruwez & K. Vanseer
On average, an employee attends 5
presentations each week
There are 2 clearly distinct groups :
Most see 1 to 5 presentations a week
A smaller group sees 10-20 presentations a week
5
10
15
20
25
1 2 3 4 5 6 7 8 9 10 12 15 20 25 30 50
Presentations attended per week (%)
www.ToThePointAtWork.com
©2014 E. Gruwez & K. Vanseer
Significant differences per function
1.38
1.58
3.21
3.57
4.39
5.81
7.74
Administrative employee
Commercial employee
Specialist
Executive employee
Manager
Board member / (Vice)President
Director
Average number of presentations attended per week
www.ToThePointAtWork.com
©2014 E. Gruwez & K. Vanseer
On average, an employee receives 7
presentations per week through email
1 out of 4 receives at least 10 each week
5
10
15
20
0 1 2 3 4 5 6 7 8 9 10 12 14 15 20 25 30 50 60
Presentations received per week (%)
www.ToThePointAtWork.com
©2014 E. Gruwez & K. Vanseer
Significant differences per function
3.17
4.38
4.55
5.29
6.48
9.83
9.97
Commercial employee
Administrative employee
Specialist
Executive employee
Manager
Director
Board member / (Vice)President
Average number of received presentations per week
www.ToThePointAtWork.com
©2014 E. Gruwez & K. Vanseer
On average, an employee spends 5 hours per
week preparing presentations
He/she makes an average of 15 slides per week
5
10
15
20
25
30
0 1 2 3 4 5 6 8 10 12 15 16 20 24 25 30 40
Weekly number of hours spent
preparing slides (%)
www.ToThePointAtWork.com
©2014 E. Gruwez & K. Vanseer
On average, an employee does 2
presentations each week
10
20
30
40
50
0 1 2 3 4 5 6 10
Number of presentations done each
week (%)
www.ToThePointAtWork.com
©2014 E. Gruwez & K. Vanseer
Average presentation duration: 40 minutes
5
10
15
20
25
30
35
40
< 15 min 15-30 min 31-60 min > 1 hour
Presentation duration (%)
www.ToThePointAtWork.com
©2014 E. Gruwez & K. Vanseer
Average number of slides per presentation: 20
5
10
15
20
25
30
35
40
45
50
Geen 1-10 slides 11-30 slides 31-50 slides >50 slides
Number of slides (%)
www.ToThePointAtWork.com
©2014 E. Gruwez & K. Vanseer
Time spent on presentations - Summary
On average, an employee spends in excess of 9 hours each
week preparing, attending or doing presentations
www.ToThePointAtWork.com
©2014 E. Gruwez & K. Vanseer
Presentation quality
www.ToThePointAtWork.com
©2014 E. Gruwez & K. Vanseer
45% of all presentations is (far) too long
10
20
30
40
50
60
Far too long Too long Good Too short Far too short
What do you think of the length of presentations?
www.ToThePointAtWork.com
©2014 E. Gruwez & K. Vanseer
43% of all presentations contain too much or
far too much info, only 9% contain too little
0
10
20
30
40
50
60
Way too much Too much Perfect Too little Way too little
What do you think of the amount of information?
www.ToThePointAtWork.com
©2014 E. Gruwez & K. Vanseer
47% of all presentations teach little
or nothing relevant
0
5
10
15
20
25
30
35
40
45
50
A lot A fair amount A little Very little Nothing
Learned anything relevant?
www.ToThePointAtWork.com
©2014 E. Gruwez & K. Vanseer
Only 24% of presentations manage really to
convince their audience, 34% has no effect at all
0
5
10
15
20
25
30
35
40
45
Yes A little No Don't know
Presentation changed opinion/attitude?
www.ToThePointAtWork.com
©2014 E. Gruwez & K. Vanseer
19% of all slides is considered (very) bad. 75%
is acceptable or good
0
5
10
15
20
25
30
35
40
45
Excellent Good Acceptable Bad Terrible
How good are the slides?
www.ToThePointAtWork.com
©2014 E. Gruwez & K. Vanseer
13% of the speakers are judged to be (very)
bad, 81% to be acceptable or good
0
5
10
15
20
25
30
35
40
45
50
Excellent Good Acceptable Bad Terrible
Speaker skills
www.ToThePointAtWork.com
©2014 E. Gruwez & K. Vanseer
Presentation quality- Summary
A substantial number of presentations
1. last too long;
2. contain too much information;
3. do not result in new relevant knowledge or skills;
4. do not result in changed opinions or attitudes.
Whereas…
slide quality and speakers are generally deemed to be good.
www.ToThePointAtWork.com
©2014 E. Gruwez & K. Vanseer
What is it that determines whether we learn
anything from a presentation?
www.ToThePointAtWork.com
©2014 E. Gruwez & K. Vanseer
Multivariate analysis
Ojective
To ascertain which variables significantly impact how much one learns from a
presentation.
Conclusions
The effect of a presentation depends first and foremost on the perceived amount of
information: too much of it (or a poor structure) is by far the main reason for failure.
Good slides can partly compensate for a small excess of information.
A good presenter can reinforce an adequate level of information.
But when there’s really too much information, no matter how much you continue
tinkering with your slides, no matter how good a speaker you are, you won’t be
getting anywhere. 82% of your audience will learn little or nothing through your
presentation.
www.ToThePointAtWork.com
©2014 E. Gruwez & K. Vanseer
What makes the quality of a presentation?
1. Content
Way too much Too much Good Too little
2. Slides Poor Acceptable Fair
3. Speaker
Excellent Not really
excellent
0
20
40
60
80
100
“I learned
something/
a lot”
18%
22%
35%
60%
94%
70%
30%
www.ToThePointAtWork.com
©2014 E. Gruwez & K. Vanseer
Multivariate analysis within
higher level functions
If we look only at the subgroup consisting of higher level individuals
(board members, presidents, directors), it appears that the quantity
seems to impact less what they learn from a presentation.
This may be explained by the fact that people in higher level
functions can deal better with more information.
Slide quality is more important for higher position people: the
better the slides, the more they learn.
www.ToThePointAtWork.com
©2014 E. Gruwez & K. Vanseer
Contact info
To The Point
Edouard Gruwez
+ 32 499 07 69 69
Ed@ToThePointAtWork.com
www.ToThePointAtWork.com
De Cijferij
Kaat Vanseer
+32 475 96 47 01
Kaat.vanseer@decijferij.be
www.decijferij.be
www.ToThePointAtWork.com
©2014 E. Gruwez & K. Vanseer

Presentations impact the bottom line

  • 1.
  • 2.
    Survey info Survey Performed by‘To The Point’ and ‘De Cijferij’ March 2014 Online – via BVIC and Linkedin Sample 273 participants in large organisations from 18 different countries evaluated 780 presentations Representativity Unweighted results – Free participation First preliminary survey as a basis for more advanced scientific enquiry www.ToThePointAtWork.com ©2014 E. Gruwez & K. Vanseer
  • 3.
    Time spent onpresentations www.ToThePointAtWork.com ©2014 E. Gruwez & K. Vanseer
  • 4.
    On average, anemployee attends 5 presentations each week There are 2 clearly distinct groups : Most see 1 to 5 presentations a week A smaller group sees 10-20 presentations a week 5 10 15 20 25 1 2 3 4 5 6 7 8 9 10 12 15 20 25 30 50 Presentations attended per week (%) www.ToThePointAtWork.com ©2014 E. Gruwez & K. Vanseer
  • 5.
    Significant differences perfunction 1.38 1.58 3.21 3.57 4.39 5.81 7.74 Administrative employee Commercial employee Specialist Executive employee Manager Board member / (Vice)President Director Average number of presentations attended per week www.ToThePointAtWork.com ©2014 E. Gruwez & K. Vanseer
  • 6.
    On average, anemployee receives 7 presentations per week through email 1 out of 4 receives at least 10 each week 5 10 15 20 0 1 2 3 4 5 6 7 8 9 10 12 14 15 20 25 30 50 60 Presentations received per week (%) www.ToThePointAtWork.com ©2014 E. Gruwez & K. Vanseer
  • 7.
    Significant differences perfunction 3.17 4.38 4.55 5.29 6.48 9.83 9.97 Commercial employee Administrative employee Specialist Executive employee Manager Director Board member / (Vice)President Average number of received presentations per week www.ToThePointAtWork.com ©2014 E. Gruwez & K. Vanseer
  • 8.
    On average, anemployee spends 5 hours per week preparing presentations He/she makes an average of 15 slides per week 5 10 15 20 25 30 0 1 2 3 4 5 6 8 10 12 15 16 20 24 25 30 40 Weekly number of hours spent preparing slides (%) www.ToThePointAtWork.com ©2014 E. Gruwez & K. Vanseer
  • 9.
    On average, anemployee does 2 presentations each week 10 20 30 40 50 0 1 2 3 4 5 6 10 Number of presentations done each week (%) www.ToThePointAtWork.com ©2014 E. Gruwez & K. Vanseer
  • 10.
    Average presentation duration:40 minutes 5 10 15 20 25 30 35 40 < 15 min 15-30 min 31-60 min > 1 hour Presentation duration (%) www.ToThePointAtWork.com ©2014 E. Gruwez & K. Vanseer
  • 11.
    Average number ofslides per presentation: 20 5 10 15 20 25 30 35 40 45 50 Geen 1-10 slides 11-30 slides 31-50 slides >50 slides Number of slides (%) www.ToThePointAtWork.com ©2014 E. Gruwez & K. Vanseer
  • 12.
    Time spent onpresentations - Summary On average, an employee spends in excess of 9 hours each week preparing, attending or doing presentations www.ToThePointAtWork.com ©2014 E. Gruwez & K. Vanseer
  • 13.
  • 14.
    45% of allpresentations is (far) too long 10 20 30 40 50 60 Far too long Too long Good Too short Far too short What do you think of the length of presentations? www.ToThePointAtWork.com ©2014 E. Gruwez & K. Vanseer
  • 15.
    43% of allpresentations contain too much or far too much info, only 9% contain too little 0 10 20 30 40 50 60 Way too much Too much Perfect Too little Way too little What do you think of the amount of information? www.ToThePointAtWork.com ©2014 E. Gruwez & K. Vanseer
  • 16.
    47% of allpresentations teach little or nothing relevant 0 5 10 15 20 25 30 35 40 45 50 A lot A fair amount A little Very little Nothing Learned anything relevant? www.ToThePointAtWork.com ©2014 E. Gruwez & K. Vanseer
  • 17.
    Only 24% ofpresentations manage really to convince their audience, 34% has no effect at all 0 5 10 15 20 25 30 35 40 45 Yes A little No Don't know Presentation changed opinion/attitude? www.ToThePointAtWork.com ©2014 E. Gruwez & K. Vanseer
  • 18.
    19% of allslides is considered (very) bad. 75% is acceptable or good 0 5 10 15 20 25 30 35 40 45 Excellent Good Acceptable Bad Terrible How good are the slides? www.ToThePointAtWork.com ©2014 E. Gruwez & K. Vanseer
  • 19.
    13% of thespeakers are judged to be (very) bad, 81% to be acceptable or good 0 5 10 15 20 25 30 35 40 45 50 Excellent Good Acceptable Bad Terrible Speaker skills www.ToThePointAtWork.com ©2014 E. Gruwez & K. Vanseer
  • 20.
    Presentation quality- Summary Asubstantial number of presentations 1. last too long; 2. contain too much information; 3. do not result in new relevant knowledge or skills; 4. do not result in changed opinions or attitudes. Whereas… slide quality and speakers are generally deemed to be good. www.ToThePointAtWork.com ©2014 E. Gruwez & K. Vanseer
  • 21.
    What is itthat determines whether we learn anything from a presentation? www.ToThePointAtWork.com ©2014 E. Gruwez & K. Vanseer
  • 22.
    Multivariate analysis Ojective To ascertainwhich variables significantly impact how much one learns from a presentation. Conclusions The effect of a presentation depends first and foremost on the perceived amount of information: too much of it (or a poor structure) is by far the main reason for failure. Good slides can partly compensate for a small excess of information. A good presenter can reinforce an adequate level of information. But when there’s really too much information, no matter how much you continue tinkering with your slides, no matter how good a speaker you are, you won’t be getting anywhere. 82% of your audience will learn little or nothing through your presentation. www.ToThePointAtWork.com ©2014 E. Gruwez & K. Vanseer
  • 23.
    What makes thequality of a presentation? 1. Content Way too much Too much Good Too little 2. Slides Poor Acceptable Fair 3. Speaker Excellent Not really excellent 0 20 40 60 80 100 “I learned something/ a lot” 18% 22% 35% 60% 94% 70% 30% www.ToThePointAtWork.com ©2014 E. Gruwez & K. Vanseer
  • 24.
    Multivariate analysis within higherlevel functions If we look only at the subgroup consisting of higher level individuals (board members, presidents, directors), it appears that the quantity seems to impact less what they learn from a presentation. This may be explained by the fact that people in higher level functions can deal better with more information. Slide quality is more important for higher position people: the better the slides, the more they learn. www.ToThePointAtWork.com ©2014 E. Gruwez & K. Vanseer
  • 25.
    Contact info To ThePoint Edouard Gruwez + 32 499 07 69 69 Ed@ToThePointAtWork.com www.ToThePointAtWork.com De Cijferij Kaat Vanseer +32 475 96 47 01 Kaat.vanseer@decijferij.be www.decijferij.be www.ToThePointAtWork.com ©2014 E. Gruwez & K. Vanseer