SlideShare a Scribd company logo
1 of 18
D N Roopa Department of Mechanical Engineering,
JSSATEB
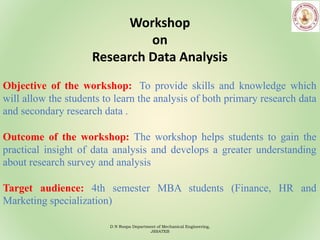
Workshop
on
Research Data Analysis
Objective of the workshop: To provide skills and knowledge which
will allow the students to learn the analysis of both primary research data
and secondary research data .
Outcome of the workshop: The workshop helps students to gain the
practical insight of data analysis and develops a greater understanding
about research survey and analysis
Target audience: 4th semester MBA students (Finance, HR and
Marketing specialization)
• Primary Source of Data – (research you conduct yourself)
• Secondary Source of Data – (research is a type of research
that has already been compiled, gathered, organized and published by
others)
• Primary Data Collection
•Interviews (telephone or face-to-face)
•Surveys using questionnaire (online or mail)
•Focus groups etc
• Secondary Data Collection
• Reports and studies by government agencies
• Report by trade associations or other
businesses/industry. Etc…
Step 1: Design and administer a questionnaire
Step 2: Enter the raw data in a data management program such
as Microsoft Excel, SPSS, and STATA, Tableau, etc
However, before entering the data, it is good practice
create a codebook for the raw data.
• The columns represent the variables.
• Rows represent the observations (respondents to the questionnaire).
• Assign a Unique Identification Number (UIN) to each filled questionnaire before data entry
begins.
• When writing the variable names, you can either use the question number or short form of
the question.
• For example, “what is your gender” can be entered as “gender” as the variable name. This
is preferred because it is easier to know what the variable is about without referring back
to the questionnaire.
• Questionnaire
• Activity – Create a template in excel referring this
questionnaire
"C:UsersD N RoopaDesktopMBA WorkshopActivity sheet.xlsx"
• The question represents a specific type of data and level of measurement,
which determines how it is coded.
• After specifying the variable names in the column headers, we will add the raw
data for each questionnaire in rows; each questionnaire on its own row. The
sheet with the raw data is called the “data view.”
• To create the codebook, open another sheet called “variable view” where all
the codes for the responses will be created.
•Nominal: the data can only be categorized
•Ordinal: the data can be categorized and ranked
•Interval: the data can be categorized, ranked, and evenly
spaced
•Ratio: the data can be categorized, ranked, evenly spaced, and
has a natural zero.
"C:UsersD N
RoopaDesktopMBA
WorkshopActivity sheet.xlsx"
 It is best practice to create the codebook before the questionnaire is administered
because it will help us to think through the codes that will be used, and how the data
will be measured and analyzed.
 Additionally, it will help us recognize any responses that would be problematic to code
and analyze and therefore give us a chance to correct the mistakes before the data
collection is undertaken.
• As seen in the image above, questions 1, 4, 5, 8, and 12 were not coded because of the
nature of their data.
• The variable “gender” was coded 1 for male, and 2 for female. It does not matter what
codes one uses because gender is a nominal variable and therefore there is no meaningful
order in the codes used.
• This applies to the variables on family business, business category and effects of covid-19
on business.
• The variable “education” is an ordinal variable therefore the codes used must have a
meaningful order. A person moves from pre-primary to primary to secondary and tertiary
levels of education. Therefore the code used for pre-primary education should be the
lowest and the code for tertiary education should be the highest.
• Sample size
• Histogram
• Descriptive Statistics
• Anova
• F-Test
• t-Test
• Correlation
• Regression
What is a Hypothesis Test?
Hypothesis testing helps identify ways to reduce costs
and improve quality. Hypothesis testing asks the
question: Are two or more sets of data the same or
different, statistically.
For companies working to improve operations, hypothesis
tests help identify differences between machines,
formulas, raw materials, etc. and whether the differences
are statistically significant or not. Without such testing,
teams can run around changing machine settings,
formulas and so on causing more variation. These knee-
jerk responses can amplify variation and cause more
problems than doing nothing at all.
Three Types of Hypothesis Tests
•Classical Method - comparing a test statistic to a critical
value
•p Value Method - the probability of a test statistic being
contrary to the null hypothesis
•Confidence Interval Method - is the test statistic
between or outside of the confidence interval
How to Conduct a Hypothesis Test
1.Define the null (H0) and an alternate (Ha) hypothesis.
2.Conduct the test.
3.Using data from the test:
1. Calculate the test statistic and the critical value (t-Test, F-test, z-Test, ANOVA, etc.).
2. Calculate a p value and compare it to a significance level (a) or confidence level (1-a).
4.Interpret the results to determine if you "cannot reject null hypothesis (accept null hypothesis)" or
"reject the null hypothesis."
Presentation.pptx
Presentation.pptx

More Related Content

Similar to Presentation.pptx

data-science-lifecycle-ebook.pdf
data-science-lifecycle-ebook.pdfdata-science-lifecycle-ebook.pdf
data-science-lifecycle-ebook.pdfDanilo Cardona
 
The 8 Step Data Mining Process
The 8 Step Data Mining ProcessThe 8 Step Data Mining Process
The 8 Step Data Mining ProcessMarc Berman
 
Lecture 1- data preparation.pptx
Lecture 1- data preparation.pptxLecture 1- data preparation.pptx
Lecture 1- data preparation.pptxEricRajat
 
Introduction to data science
Introduction to data scienceIntroduction to data science
Introduction to data scienceSpartan60
 
Final spss hands on training (descriptive analysis) may 24th 2013
Final spss  hands on training (descriptive analysis) may 24th 2013Final spss  hands on training (descriptive analysis) may 24th 2013
Final spss hands on training (descriptive analysis) may 24th 2013Tin Myo Han
 
Types of Statistics.pptx
Types of Statistics.pptxTypes of Statistics.pptx
Types of Statistics.pptxANKURARYA23
 
Group 1 Report CRISP - DM METHODOLOGY.pptx
Group 1 Report CRISP - DM METHODOLOGY.pptxGroup 1 Report CRISP - DM METHODOLOGY.pptx
Group 1 Report CRISP - DM METHODOLOGY.pptxellamangapis2003
 
ACRL 2011 Data-Driven Library Web Design
ACRL 2011 Data-Driven Library Web DesignACRL 2011 Data-Driven Library Web Design
ACRL 2011 Data-Driven Library Web DesignAmanda Dinscore
 
Tools And Resources For Continuous Improvement Of Technology In Schools
Tools And Resources For Continuous Improvement Of Technology In SchoolsTools And Resources For Continuous Improvement Of Technology In Schools
Tools And Resources For Continuous Improvement Of Technology In Schoolsfridayinstitute
 
Manuscript editing | Research data analyst | Data analysis
Manuscript editing | Research data analyst | Data analysisManuscript editing | Research data analyst | Data analysis
Manuscript editing | Research data analyst | Data analysisPubrica
 
Lecture_4_Data_Gathering_and_Analysis.pdf
Lecture_4_Data_Gathering_and_Analysis.pdfLecture_4_Data_Gathering_and_Analysis.pdf
Lecture_4_Data_Gathering_and_Analysis.pdfAbdullahOmar64
 
Introduction to Data Science - Week 3 - Steps involved in Data Science
Introduction to Data Science - Week 3 - Steps involved in Data ScienceIntroduction to Data Science - Week 3 - Steps involved in Data Science
Introduction to Data Science - Week 3 - Steps involved in Data ScienceFerdin Joe John Joseph PhD
 
Data Processing & Explain each term in details.pptx
Data Processing & Explain each term in details.pptxData Processing & Explain each term in details.pptx
Data Processing & Explain each term in details.pptxPratikshaSurve4
 
staffing chapter no 8 external selection part 1, by heneman
staffing chapter no 8 external selection part 1, by henemanstaffing chapter no 8 external selection part 1, by heneman
staffing chapter no 8 external selection part 1, by henemanfareeha zanib
 
HR Analytics (2).pptx
HR Analytics (2).pptxHR Analytics (2).pptx
HR Analytics (2).pptxNipunHarsha1
 
Data Science Job ready #DataScienceInterview Question and Answers 2022 | #Dat...
Data Science Job ready #DataScienceInterview Question and Answers 2022 | #Dat...Data Science Job ready #DataScienceInterview Question and Answers 2022 | #Dat...
Data Science Job ready #DataScienceInterview Question and Answers 2022 | #Dat...Rohit Dubey
 
Barga Data Science lecture 2
Barga Data Science lecture 2Barga Data Science lecture 2
Barga Data Science lecture 2Roger Barga
 

Similar to Presentation.pptx (20)

data-science-lifecycle-ebook.pdf
data-science-lifecycle-ebook.pdfdata-science-lifecycle-ebook.pdf
data-science-lifecycle-ebook.pdf
 
The 8 Step Data Mining Process
The 8 Step Data Mining ProcessThe 8 Step Data Mining Process
The 8 Step Data Mining Process
 
Lecture 1- data preparation.pptx
Lecture 1- data preparation.pptxLecture 1- data preparation.pptx
Lecture 1- data preparation.pptx
 
Introduction to data science
Introduction to data scienceIntroduction to data science
Introduction to data science
 
Final spss hands on training (descriptive analysis) may 24th 2013
Final spss  hands on training (descriptive analysis) may 24th 2013Final spss  hands on training (descriptive analysis) may 24th 2013
Final spss hands on training (descriptive analysis) may 24th 2013
 
Data Science in Python.pptx
Data Science in Python.pptxData Science in Python.pptx
Data Science in Python.pptx
 
Types of Statistics.pptx
Types of Statistics.pptxTypes of Statistics.pptx
Types of Statistics.pptx
 
Group 1 Report CRISP - DM METHODOLOGY.pptx
Group 1 Report CRISP - DM METHODOLOGY.pptxGroup 1 Report CRISP - DM METHODOLOGY.pptx
Group 1 Report CRISP - DM METHODOLOGY.pptx
 
Chap 7
Chap 7Chap 7
Chap 7
 
ACRL 2011 Data-Driven Library Web Design
ACRL 2011 Data-Driven Library Web DesignACRL 2011 Data-Driven Library Web Design
ACRL 2011 Data-Driven Library Web Design
 
Tools And Resources For Continuous Improvement Of Technology In Schools
Tools And Resources For Continuous Improvement Of Technology In SchoolsTools And Resources For Continuous Improvement Of Technology In Schools
Tools And Resources For Continuous Improvement Of Technology In Schools
 
Manuscript editing | Research data analyst | Data analysis
Manuscript editing | Research data analyst | Data analysisManuscript editing | Research data analyst | Data analysis
Manuscript editing | Research data analyst | Data analysis
 
KPMG_Task2.pptx
KPMG_Task2.pptxKPMG_Task2.pptx
KPMG_Task2.pptx
 
Lecture_4_Data_Gathering_and_Analysis.pdf
Lecture_4_Data_Gathering_and_Analysis.pdfLecture_4_Data_Gathering_and_Analysis.pdf
Lecture_4_Data_Gathering_and_Analysis.pdf
 
Introduction to Data Science - Week 3 - Steps involved in Data Science
Introduction to Data Science - Week 3 - Steps involved in Data ScienceIntroduction to Data Science - Week 3 - Steps involved in Data Science
Introduction to Data Science - Week 3 - Steps involved in Data Science
 
Data Processing & Explain each term in details.pptx
Data Processing & Explain each term in details.pptxData Processing & Explain each term in details.pptx
Data Processing & Explain each term in details.pptx
 
staffing chapter no 8 external selection part 1, by heneman
staffing chapter no 8 external selection part 1, by henemanstaffing chapter no 8 external selection part 1, by heneman
staffing chapter no 8 external selection part 1, by heneman
 
HR Analytics (2).pptx
HR Analytics (2).pptxHR Analytics (2).pptx
HR Analytics (2).pptx
 
Data Science Job ready #DataScienceInterview Question and Answers 2022 | #Dat...
Data Science Job ready #DataScienceInterview Question and Answers 2022 | #Dat...Data Science Job ready #DataScienceInterview Question and Answers 2022 | #Dat...
Data Science Job ready #DataScienceInterview Question and Answers 2022 | #Dat...
 
Barga Data Science lecture 2
Barga Data Science lecture 2Barga Data Science lecture 2
Barga Data Science lecture 2
 

More from RoopaDNDandally

Emergence of IoT,Introduction, Evolution
Emergence of IoT,Introduction, EvolutionEmergence of IoT,Introduction, Evolution
Emergence of IoT,Introduction, EvolutionRoopaDNDandally
 
Module 4_BETCK105H_Introduction to IoT.pdf
Module 4_BETCK105H_Introduction to IoT.pdfModule 4_BETCK105H_Introduction to IoT.pdf
Module 4_BETCK105H_Introduction to IoT.pdfRoopaDNDandally
 
Module 3_BETCK105H_Introduction to IoT.pdf
Module 3_BETCK105H_Introduction to IoT.pdfModule 3_BETCK105H_Introduction to IoT.pdf
Module 3_BETCK105H_Introduction to IoT.pdfRoopaDNDandally
 
Module 2_BETCK105H_Introduction to IoT.pdf
Module 2_BETCK105H_Introduction to IoT.pdfModule 2_BETCK105H_Introduction to IoT.pdf
Module 2_BETCK105H_Introduction to IoT.pdfRoopaDNDandally
 
Module 1_BETCK105H_Introduction to IoT.pdf
Module 1_BETCK105H_Introduction to IoT.pdfModule 1_BETCK105H_Introduction to IoT.pdf
Module 1_BETCK105H_Introduction to IoT.pdfRoopaDNDandally
 
Module 5_BETCK105H_Introduction to IoT.pdf
Module 5_BETCK105H_Introduction to IoT.pdfModule 5_BETCK105H_Introduction to IoT.pdf
Module 5_BETCK105H_Introduction to IoT.pdfRoopaDNDandally
 
Module 3 and 4 Question Bank_21RMI56_to share with students.pdf
Module 3 and 4 Question Bank_21RMI56_to share with students.pdfModule 3 and 4 Question Bank_21RMI56_to share with students.pdf
Module 3 and 4 Question Bank_21RMI56_to share with students.pdfRoopaDNDandally
 
21RMI56_Module 4_notes_research methodol
21RMI56_Module 4_notes_research methodol21RMI56_Module 4_notes_research methodol
21RMI56_Module 4_notes_research methodolRoopaDNDandally
 
Notes - 21RMI56_Module 3_Research Method
Notes - 21RMI56_Module 3_Research MethodNotes - 21RMI56_Module 3_Research Method
Notes - 21RMI56_Module 3_Research MethodRoopaDNDandally
 
Module 1 and 2 Question Bank_21RMI56.pdf
Module 1 and 2 Question Bank_21RMI56.pdfModule 1 and 2 Question Bank_21RMI56.pdf
Module 1 and 2 Question Bank_21RMI56.pdfRoopaDNDandally
 
21RMI56-Research Methodology Mod 1 and 2
21RMI56-Research Methodology Mod 1 and 221RMI56-Research Methodology Mod 1 and 2
21RMI56-Research Methodology Mod 1 and 2RoopaDNDandally
 
Day 1 Content - Module 1.pptx
Day 1 Content - Module 1.pptxDay 1 Content - Module 1.pptx
Day 1 Content - Module 1.pptxRoopaDNDandally
 
DCET 2023_Session 1_Statistics and Analytics.pdf
DCET 2023_Session 1_Statistics and Analytics.pdfDCET 2023_Session 1_Statistics and Analytics.pdf
DCET 2023_Session 1_Statistics and Analytics.pdfRoopaDNDandally
 

More from RoopaDNDandally (20)

Emergence of IoT,Introduction, Evolution
Emergence of IoT,Introduction, EvolutionEmergence of IoT,Introduction, Evolution
Emergence of IoT,Introduction, Evolution
 
Module 4_BETCK105H_Introduction to IoT.pdf
Module 4_BETCK105H_Introduction to IoT.pdfModule 4_BETCK105H_Introduction to IoT.pdf
Module 4_BETCK105H_Introduction to IoT.pdf
 
Module 3_BETCK105H_Introduction to IoT.pdf
Module 3_BETCK105H_Introduction to IoT.pdfModule 3_BETCK105H_Introduction to IoT.pdf
Module 3_BETCK105H_Introduction to IoT.pdf
 
Module 2_BETCK105H_Introduction to IoT.pdf
Module 2_BETCK105H_Introduction to IoT.pdfModule 2_BETCK105H_Introduction to IoT.pdf
Module 2_BETCK105H_Introduction to IoT.pdf
 
Module 1_BETCK105H_Introduction to IoT.pdf
Module 1_BETCK105H_Introduction to IoT.pdfModule 1_BETCK105H_Introduction to IoT.pdf
Module 1_BETCK105H_Introduction to IoT.pdf
 
Module 5_BETCK105H_Introduction to IoT.pdf
Module 5_BETCK105H_Introduction to IoT.pdfModule 5_BETCK105H_Introduction to IoT.pdf
Module 5_BETCK105H_Introduction to IoT.pdf
 
Module 3 and 4 Question Bank_21RMI56_to share with students.pdf
Module 3 and 4 Question Bank_21RMI56_to share with students.pdfModule 3 and 4 Question Bank_21RMI56_to share with students.pdf
Module 3 and 4 Question Bank_21RMI56_to share with students.pdf
 
21RMI56_Module 4_notes_research methodol
21RMI56_Module 4_notes_research methodol21RMI56_Module 4_notes_research methodol
21RMI56_Module 4_notes_research methodol
 
Notes - 21RMI56_Module 3_Research Method
Notes - 21RMI56_Module 3_Research MethodNotes - 21RMI56_Module 3_Research Method
Notes - 21RMI56_Module 3_Research Method
 
Module 1 and 2 Question Bank_21RMI56.pdf
Module 1 and 2 Question Bank_21RMI56.pdfModule 1 and 2 Question Bank_21RMI56.pdf
Module 1 and 2 Question Bank_21RMI56.pdf
 
21RMI56-Research Methodology Mod 1 and 2
21RMI56-Research Methodology Mod 1 and 221RMI56-Research Methodology Mod 1 and 2
21RMI56-Research Methodology Mod 1 and 2
 
Module 2_DNR_MCQ.pptx
Module 2_DNR_MCQ.pptxModule 2_DNR_MCQ.pptx
Module 2_DNR_MCQ.pptx
 
3rd sem 2022 scheem.pdf
3rd sem 2022 scheem.pdf3rd sem 2022 scheem.pdf
3rd sem 2022 scheem.pdf
 
ch13.ppt
ch13.pptch13.ppt
ch13.ppt
 
Class 32_ceramics.pptx
Class 32_ceramics.pptxClass 32_ceramics.pptx
Class 32_ceramics.pptx
 
Robot AI IOT.pptx
Robot AI IOT.pptxRobot AI IOT.pptx
Robot AI IOT.pptx
 
Day 1 Content.pptx
Day 1 Content.pptxDay 1 Content.pptx
Day 1 Content.pptx
 
Day 1 Content - Module 1.pptx
Day 1 Content - Module 1.pptxDay 1 Content - Module 1.pptx
Day 1 Content - Module 1.pptx
 
module 4 - SPC.pptx
module 4 - SPC.pptxmodule 4 - SPC.pptx
module 4 - SPC.pptx
 
DCET 2023_Session 1_Statistics and Analytics.pdf
DCET 2023_Session 1_Statistics and Analytics.pdfDCET 2023_Session 1_Statistics and Analytics.pdf
DCET 2023_Session 1_Statistics and Analytics.pdf
 

Recently uploaded

Accessible design: Minimum effort, maximum impact
Accessible design: Minimum effort, maximum impactAccessible design: Minimum effort, maximum impact
Accessible design: Minimum effort, maximum impactdawncurless
 
Sports & Fitness Value Added Course FY..
Sports & Fitness Value Added Course FY..Sports & Fitness Value Added Course FY..
Sports & Fitness Value Added Course FY..Disha Kariya
 
Z Score,T Score, Percential Rank and Box Plot Graph
Z Score,T Score, Percential Rank and Box Plot GraphZ Score,T Score, Percential Rank and Box Plot Graph
Z Score,T Score, Percential Rank and Box Plot GraphThiyagu K
 
BAG TECHNIQUE Bag technique-a tool making use of public health bag through wh...
BAG TECHNIQUE Bag technique-a tool making use of public health bag through wh...BAG TECHNIQUE Bag technique-a tool making use of public health bag through wh...
BAG TECHNIQUE Bag technique-a tool making use of public health bag through wh...Sapna Thakur
 
The byproduct of sericulture in different industries.pptx
The byproduct of sericulture in different industries.pptxThe byproduct of sericulture in different industries.pptx
The byproduct of sericulture in different industries.pptxShobhayan Kirtania
 
Introduction to Nonprofit Accounting: The Basics
Introduction to Nonprofit Accounting: The BasicsIntroduction to Nonprofit Accounting: The Basics
Introduction to Nonprofit Accounting: The BasicsTechSoup
 
APM Welcome, APM North West Network Conference, Synergies Across Sectors
APM Welcome, APM North West Network Conference, Synergies Across SectorsAPM Welcome, APM North West Network Conference, Synergies Across Sectors
APM Welcome, APM North West Network Conference, Synergies Across SectorsAssociation for Project Management
 
JAPAN: ORGANISATION OF PMDA, PHARMACEUTICAL LAWS & REGULATIONS, TYPES OF REGI...
JAPAN: ORGANISATION OF PMDA, PHARMACEUTICAL LAWS & REGULATIONS, TYPES OF REGI...JAPAN: ORGANISATION OF PMDA, PHARMACEUTICAL LAWS & REGULATIONS, TYPES OF REGI...
JAPAN: ORGANISATION OF PMDA, PHARMACEUTICAL LAWS & REGULATIONS, TYPES OF REGI...anjaliyadav012327
 
Organic Name Reactions for the students and aspirants of Chemistry12th.pptx
Organic Name Reactions  for the students and aspirants of Chemistry12th.pptxOrganic Name Reactions  for the students and aspirants of Chemistry12th.pptx
Organic Name Reactions for the students and aspirants of Chemistry12th.pptxVS Mahajan Coaching Centre
 
Ecosystem Interactions Class Discussion Presentation in Blue Green Lined Styl...
Ecosystem Interactions Class Discussion Presentation in Blue Green Lined Styl...Ecosystem Interactions Class Discussion Presentation in Blue Green Lined Styl...
Ecosystem Interactions Class Discussion Presentation in Blue Green Lined Styl...fonyou31
 
9548086042 for call girls in Indira Nagar with room service
9548086042  for call girls in Indira Nagar  with room service9548086042  for call girls in Indira Nagar  with room service
9548086042 for call girls in Indira Nagar with room servicediscovermytutordmt
 
Paris 2024 Olympic Geographies - an activity
Paris 2024 Olympic Geographies - an activityParis 2024 Olympic Geographies - an activity
Paris 2024 Olympic Geographies - an activityGeoBlogs
 
Measures of Central Tendency: Mean, Median and Mode
Measures of Central Tendency: Mean, Median and ModeMeasures of Central Tendency: Mean, Median and Mode
Measures of Central Tendency: Mean, Median and ModeThiyagu K
 
social pharmacy d-pharm 1st year by Pragati K. Mahajan
social pharmacy d-pharm 1st year by Pragati K. Mahajansocial pharmacy d-pharm 1st year by Pragati K. Mahajan
social pharmacy d-pharm 1st year by Pragati K. Mahajanpragatimahajan3
 
Web & Social Media Analytics Previous Year Question Paper.pdf
Web & Social Media Analytics Previous Year Question Paper.pdfWeb & Social Media Analytics Previous Year Question Paper.pdf
Web & Social Media Analytics Previous Year Question Paper.pdfJayanti Pande
 
Student login on Anyboli platform.helpin
Student login on Anyboli platform.helpinStudent login on Anyboli platform.helpin
Student login on Anyboli platform.helpinRaunakKeshri1
 
SOCIAL AND HISTORICAL CONTEXT - LFTVD.pptx
SOCIAL AND HISTORICAL CONTEXT - LFTVD.pptxSOCIAL AND HISTORICAL CONTEXT - LFTVD.pptx
SOCIAL AND HISTORICAL CONTEXT - LFTVD.pptxiammrhaywood
 
Measures of Dispersion and Variability: Range, QD, AD and SD
Measures of Dispersion and Variability: Range, QD, AD and SDMeasures of Dispersion and Variability: Range, QD, AD and SD
Measures of Dispersion and Variability: Range, QD, AD and SDThiyagu K
 

Recently uploaded (20)

Accessible design: Minimum effort, maximum impact
Accessible design: Minimum effort, maximum impactAccessible design: Minimum effort, maximum impact
Accessible design: Minimum effort, maximum impact
 
Sports & Fitness Value Added Course FY..
Sports & Fitness Value Added Course FY..Sports & Fitness Value Added Course FY..
Sports & Fitness Value Added Course FY..
 
Z Score,T Score, Percential Rank and Box Plot Graph
Z Score,T Score, Percential Rank and Box Plot GraphZ Score,T Score, Percential Rank and Box Plot Graph
Z Score,T Score, Percential Rank and Box Plot Graph
 
BAG TECHNIQUE Bag technique-a tool making use of public health bag through wh...
BAG TECHNIQUE Bag technique-a tool making use of public health bag through wh...BAG TECHNIQUE Bag technique-a tool making use of public health bag through wh...
BAG TECHNIQUE Bag technique-a tool making use of public health bag through wh...
 
Mattingly "AI & Prompt Design: The Basics of Prompt Design"
Mattingly "AI & Prompt Design: The Basics of Prompt Design"Mattingly "AI & Prompt Design: The Basics of Prompt Design"
Mattingly "AI & Prompt Design: The Basics of Prompt Design"
 
The byproduct of sericulture in different industries.pptx
The byproduct of sericulture in different industries.pptxThe byproduct of sericulture in different industries.pptx
The byproduct of sericulture in different industries.pptx
 
Introduction to Nonprofit Accounting: The Basics
Introduction to Nonprofit Accounting: The BasicsIntroduction to Nonprofit Accounting: The Basics
Introduction to Nonprofit Accounting: The Basics
 
APM Welcome, APM North West Network Conference, Synergies Across Sectors
APM Welcome, APM North West Network Conference, Synergies Across SectorsAPM Welcome, APM North West Network Conference, Synergies Across Sectors
APM Welcome, APM North West Network Conference, Synergies Across Sectors
 
JAPAN: ORGANISATION OF PMDA, PHARMACEUTICAL LAWS & REGULATIONS, TYPES OF REGI...
JAPAN: ORGANISATION OF PMDA, PHARMACEUTICAL LAWS & REGULATIONS, TYPES OF REGI...JAPAN: ORGANISATION OF PMDA, PHARMACEUTICAL LAWS & REGULATIONS, TYPES OF REGI...
JAPAN: ORGANISATION OF PMDA, PHARMACEUTICAL LAWS & REGULATIONS, TYPES OF REGI...
 
Organic Name Reactions for the students and aspirants of Chemistry12th.pptx
Organic Name Reactions  for the students and aspirants of Chemistry12th.pptxOrganic Name Reactions  for the students and aspirants of Chemistry12th.pptx
Organic Name Reactions for the students and aspirants of Chemistry12th.pptx
 
Ecosystem Interactions Class Discussion Presentation in Blue Green Lined Styl...
Ecosystem Interactions Class Discussion Presentation in Blue Green Lined Styl...Ecosystem Interactions Class Discussion Presentation in Blue Green Lined Styl...
Ecosystem Interactions Class Discussion Presentation in Blue Green Lined Styl...
 
9548086042 for call girls in Indira Nagar with room service
9548086042  for call girls in Indira Nagar  with room service9548086042  for call girls in Indira Nagar  with room service
9548086042 for call girls in Indira Nagar with room service
 
INDIA QUIZ 2024 RLAC DELHI UNIVERSITY.pptx
INDIA QUIZ 2024 RLAC DELHI UNIVERSITY.pptxINDIA QUIZ 2024 RLAC DELHI UNIVERSITY.pptx
INDIA QUIZ 2024 RLAC DELHI UNIVERSITY.pptx
 
Paris 2024 Olympic Geographies - an activity
Paris 2024 Olympic Geographies - an activityParis 2024 Olympic Geographies - an activity
Paris 2024 Olympic Geographies - an activity
 
Measures of Central Tendency: Mean, Median and Mode
Measures of Central Tendency: Mean, Median and ModeMeasures of Central Tendency: Mean, Median and Mode
Measures of Central Tendency: Mean, Median and Mode
 
social pharmacy d-pharm 1st year by Pragati K. Mahajan
social pharmacy d-pharm 1st year by Pragati K. Mahajansocial pharmacy d-pharm 1st year by Pragati K. Mahajan
social pharmacy d-pharm 1st year by Pragati K. Mahajan
 
Web & Social Media Analytics Previous Year Question Paper.pdf
Web & Social Media Analytics Previous Year Question Paper.pdfWeb & Social Media Analytics Previous Year Question Paper.pdf
Web & Social Media Analytics Previous Year Question Paper.pdf
 
Student login on Anyboli platform.helpin
Student login on Anyboli platform.helpinStudent login on Anyboli platform.helpin
Student login on Anyboli platform.helpin
 
SOCIAL AND HISTORICAL CONTEXT - LFTVD.pptx
SOCIAL AND HISTORICAL CONTEXT - LFTVD.pptxSOCIAL AND HISTORICAL CONTEXT - LFTVD.pptx
SOCIAL AND HISTORICAL CONTEXT - LFTVD.pptx
 
Measures of Dispersion and Variability: Range, QD, AD and SD
Measures of Dispersion and Variability: Range, QD, AD and SDMeasures of Dispersion and Variability: Range, QD, AD and SD
Measures of Dispersion and Variability: Range, QD, AD and SD
 

Presentation.pptx

  • 1. D N Roopa Department of Mechanical Engineering, JSSATEB Workshop on Research Data Analysis Objective of the workshop: To provide skills and knowledge which will allow the students to learn the analysis of both primary research data and secondary research data . Outcome of the workshop: The workshop helps students to gain the practical insight of data analysis and develops a greater understanding about research survey and analysis Target audience: 4th semester MBA students (Finance, HR and Marketing specialization)
  • 2. • Primary Source of Data – (research you conduct yourself) • Secondary Source of Data – (research is a type of research that has already been compiled, gathered, organized and published by others)
  • 3. • Primary Data Collection •Interviews (telephone or face-to-face) •Surveys using questionnaire (online or mail) •Focus groups etc
  • 4. • Secondary Data Collection • Reports and studies by government agencies • Report by trade associations or other businesses/industry. Etc…
  • 5. Step 1: Design and administer a questionnaire Step 2: Enter the raw data in a data management program such as Microsoft Excel, SPSS, and STATA, Tableau, etc However, before entering the data, it is good practice create a codebook for the raw data.
  • 6. • The columns represent the variables. • Rows represent the observations (respondents to the questionnaire). • Assign a Unique Identification Number (UIN) to each filled questionnaire before data entry begins. • When writing the variable names, you can either use the question number or short form of the question. • For example, “what is your gender” can be entered as “gender” as the variable name. This is preferred because it is easier to know what the variable is about without referring back to the questionnaire.
  • 8. • Activity – Create a template in excel referring this questionnaire "C:UsersD N RoopaDesktopMBA WorkshopActivity sheet.xlsx"
  • 9. • The question represents a specific type of data and level of measurement, which determines how it is coded. • After specifying the variable names in the column headers, we will add the raw data for each questionnaire in rows; each questionnaire on its own row. The sheet with the raw data is called the “data view.” • To create the codebook, open another sheet called “variable view” where all the codes for the responses will be created.
  • 10. •Nominal: the data can only be categorized •Ordinal: the data can be categorized and ranked •Interval: the data can be categorized, ranked, and evenly spaced •Ratio: the data can be categorized, ranked, evenly spaced, and has a natural zero. "C:UsersD N RoopaDesktopMBA WorkshopActivity sheet.xlsx"
  • 11.  It is best practice to create the codebook before the questionnaire is administered because it will help us to think through the codes that will be used, and how the data will be measured and analyzed.  Additionally, it will help us recognize any responses that would be problematic to code and analyze and therefore give us a chance to correct the mistakes before the data collection is undertaken. • As seen in the image above, questions 1, 4, 5, 8, and 12 were not coded because of the nature of their data. • The variable “gender” was coded 1 for male, and 2 for female. It does not matter what codes one uses because gender is a nominal variable and therefore there is no meaningful order in the codes used. • This applies to the variables on family business, business category and effects of covid-19 on business. • The variable “education” is an ordinal variable therefore the codes used must have a meaningful order. A person moves from pre-primary to primary to secondary and tertiary levels of education. Therefore the code used for pre-primary education should be the lowest and the code for tertiary education should be the highest.
  • 13. • Histogram • Descriptive Statistics • Anova • F-Test • t-Test • Correlation • Regression
  • 14. What is a Hypothesis Test? Hypothesis testing helps identify ways to reduce costs and improve quality. Hypothesis testing asks the question: Are two or more sets of data the same or different, statistically. For companies working to improve operations, hypothesis tests help identify differences between machines, formulas, raw materials, etc. and whether the differences are statistically significant or not. Without such testing, teams can run around changing machine settings, formulas and so on causing more variation. These knee- jerk responses can amplify variation and cause more problems than doing nothing at all.
  • 15. Three Types of Hypothesis Tests •Classical Method - comparing a test statistic to a critical value •p Value Method - the probability of a test statistic being contrary to the null hypothesis •Confidence Interval Method - is the test statistic between or outside of the confidence interval
  • 16. How to Conduct a Hypothesis Test 1.Define the null (H0) and an alternate (Ha) hypothesis. 2.Conduct the test. 3.Using data from the test: 1. Calculate the test statistic and the critical value (t-Test, F-test, z-Test, ANOVA, etc.). 2. Calculate a p value and compare it to a significance level (a) or confidence level (1-a). 4.Interpret the results to determine if you "cannot reject null hypothesis (accept null hypothesis)" or "reject the null hypothesis."

Editor's Notes

  1. Interviews (telephone or face-to-face) Surveys (online or mail) Questionnaires (online or mail) reports and studies by government agencies, trade associations or other businesses in your industry. For small businesses with limited budgets, most research is typically secondary, because it can be obtained faster and more affordably than primary research. Focus groups Visits to competitors' locations
  2. Creating the codebook and entering the raw data into Excel before exporting to other programs is that it is easier to clean and manipulate data in Excel than it is in the other programs. Excel is also a powerful tool for preliminary data analysis and data visualization.
  3. https://www.excel-easy.com/examples/histogram.html