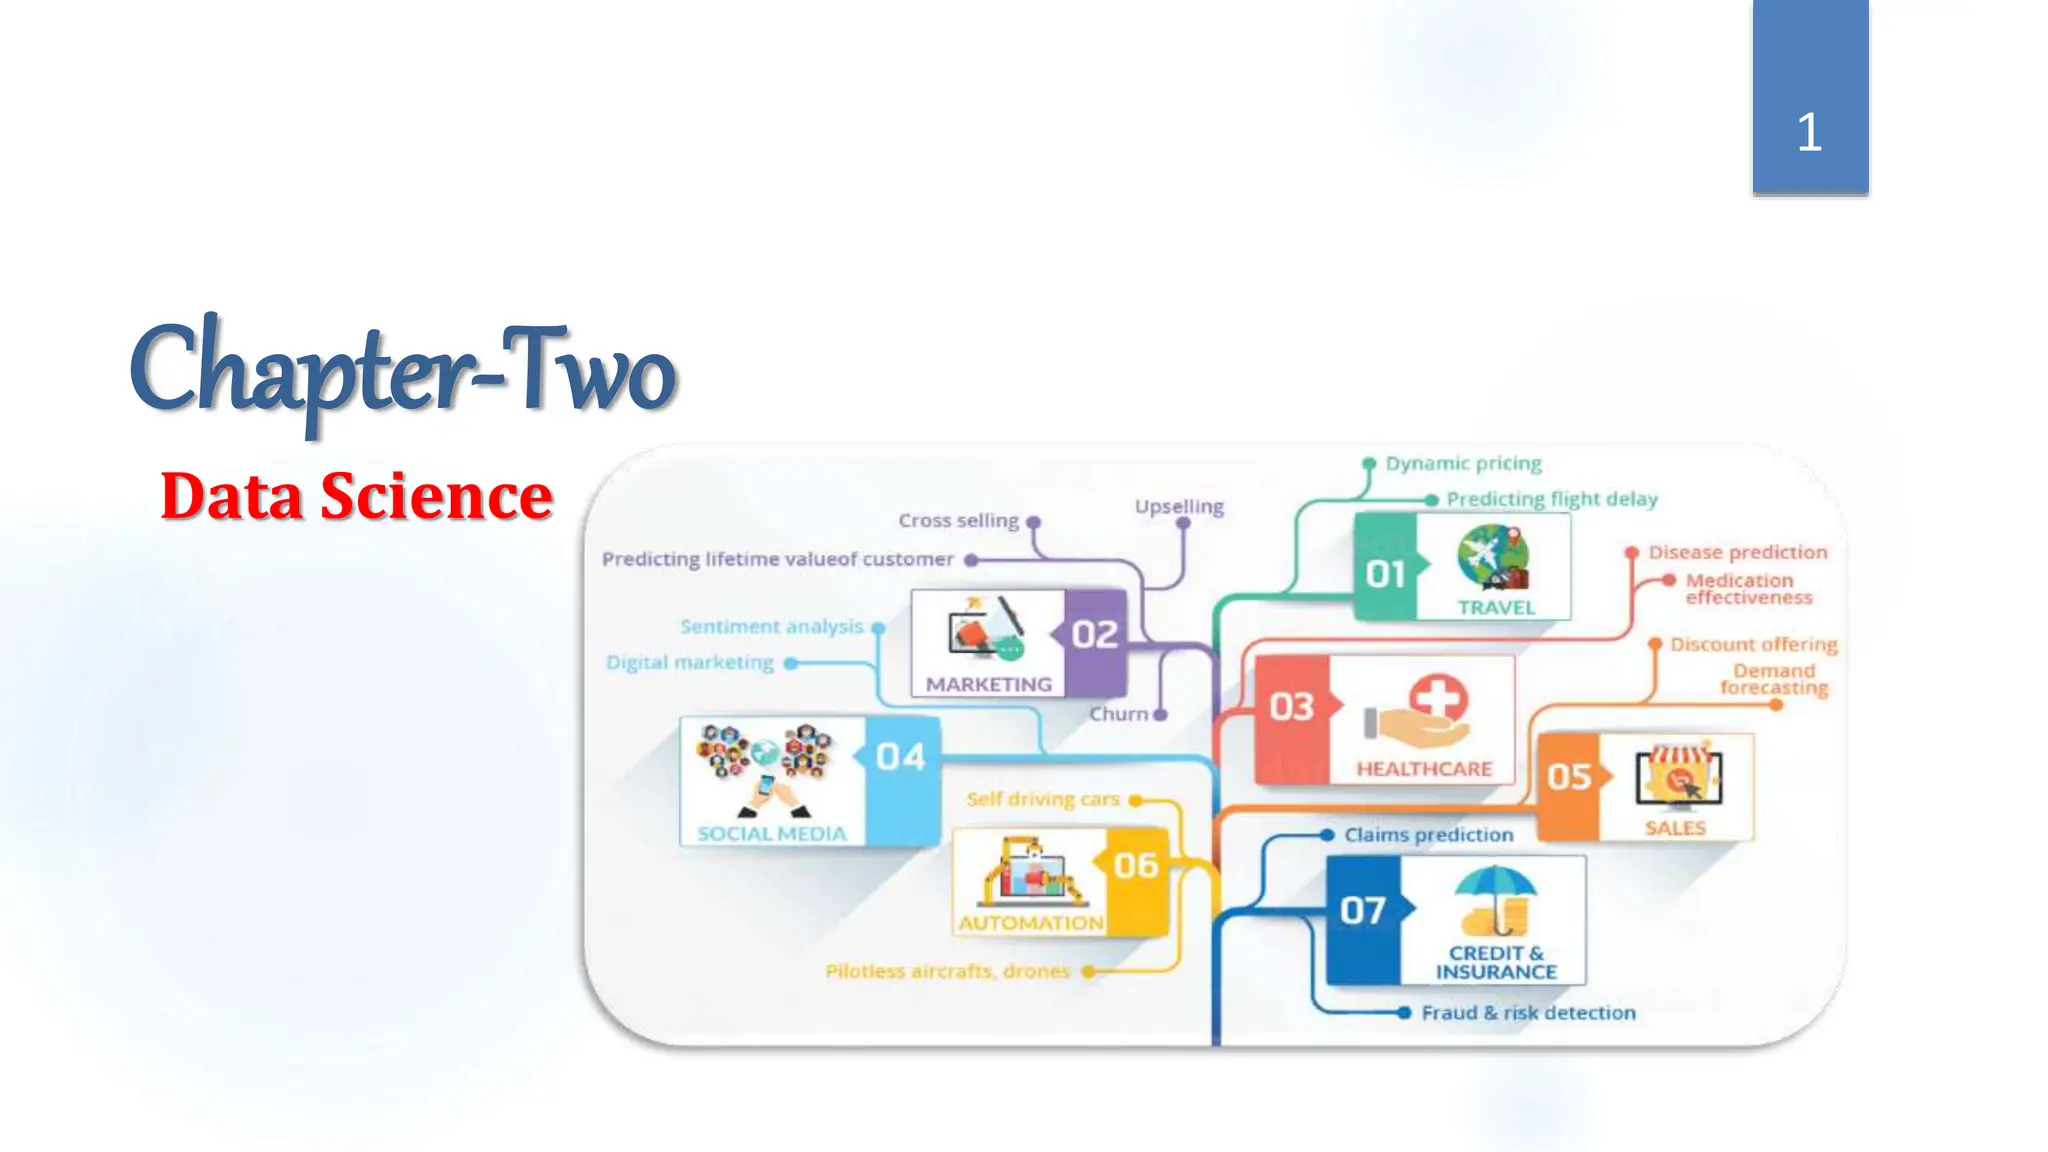
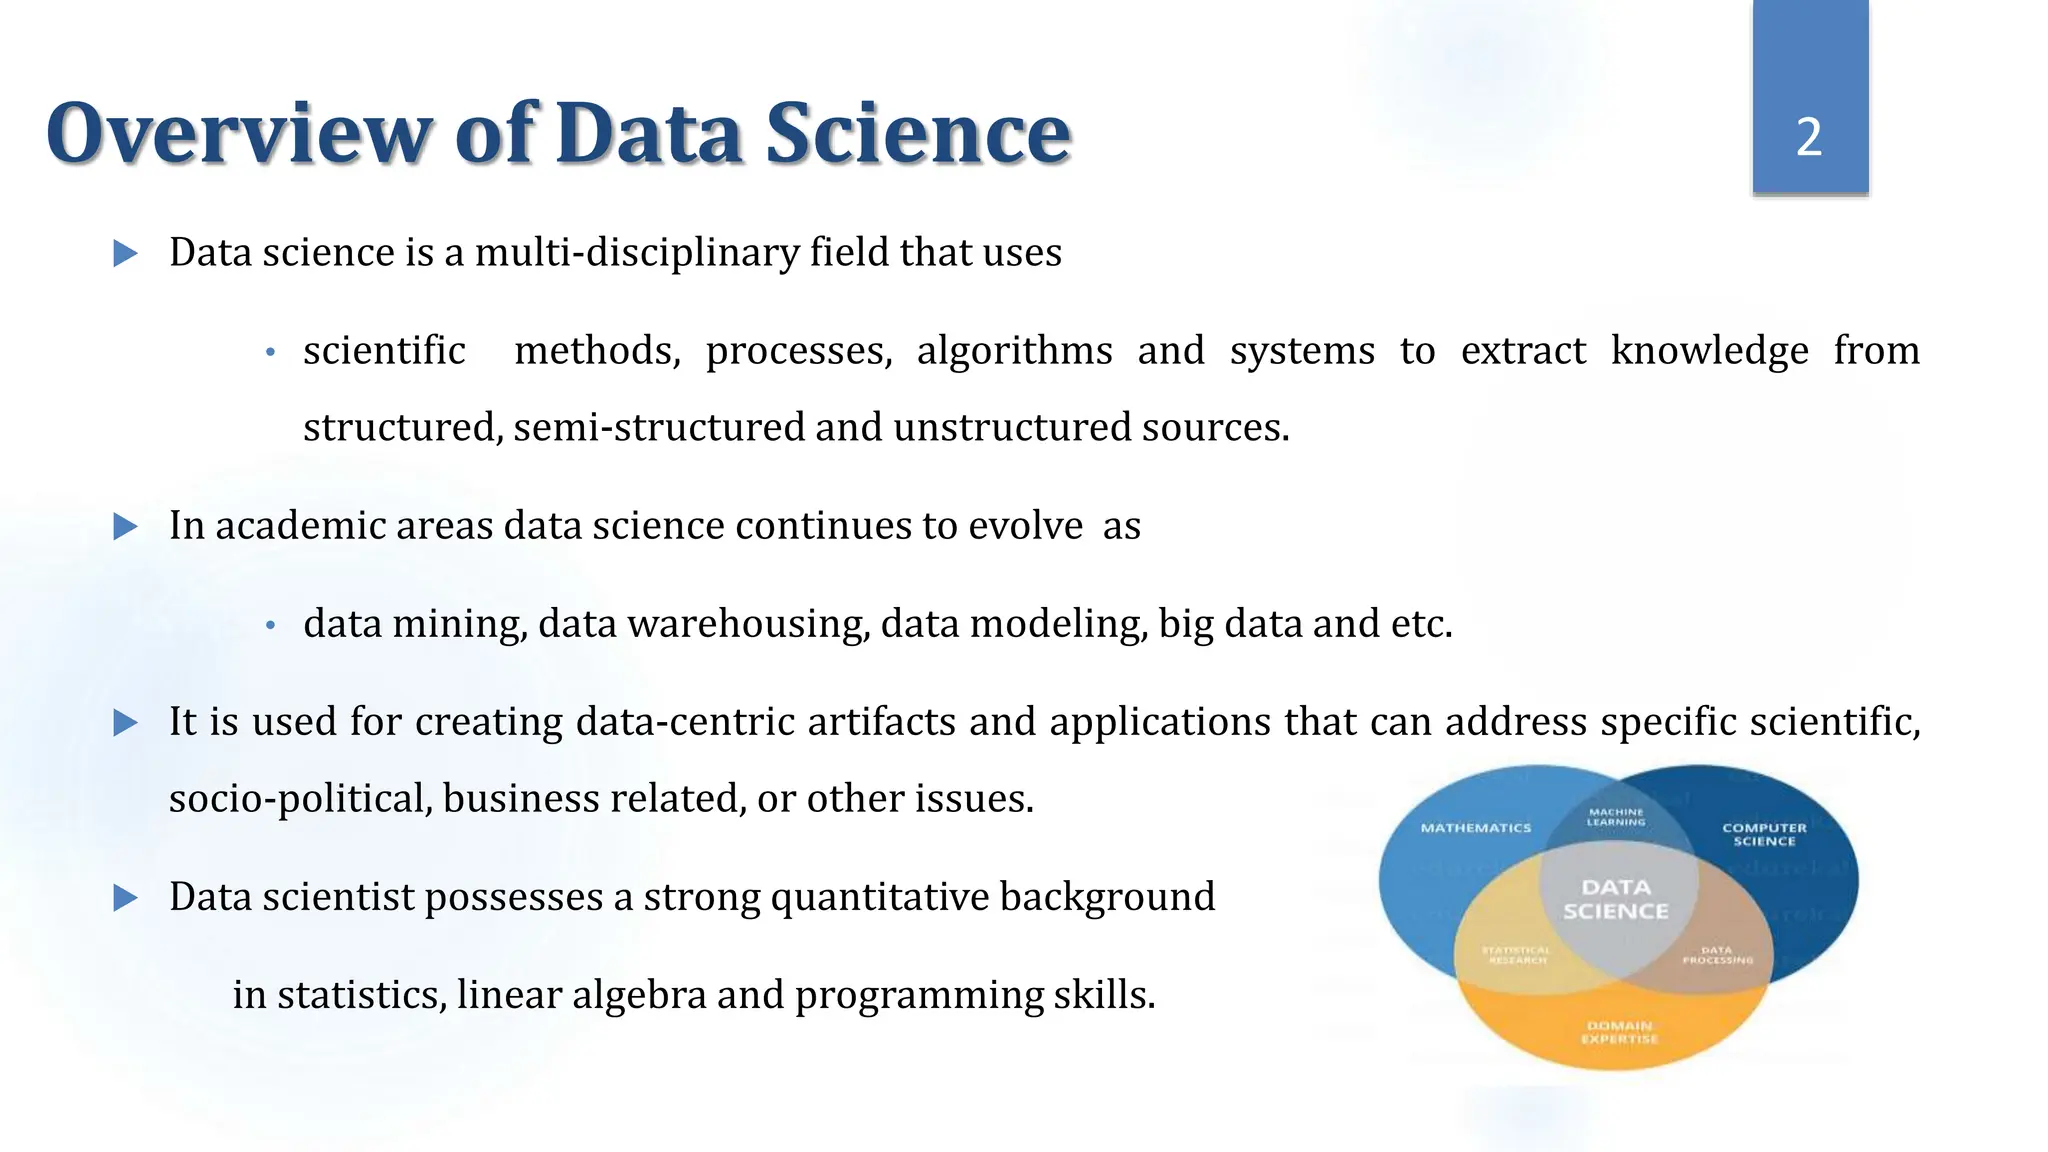
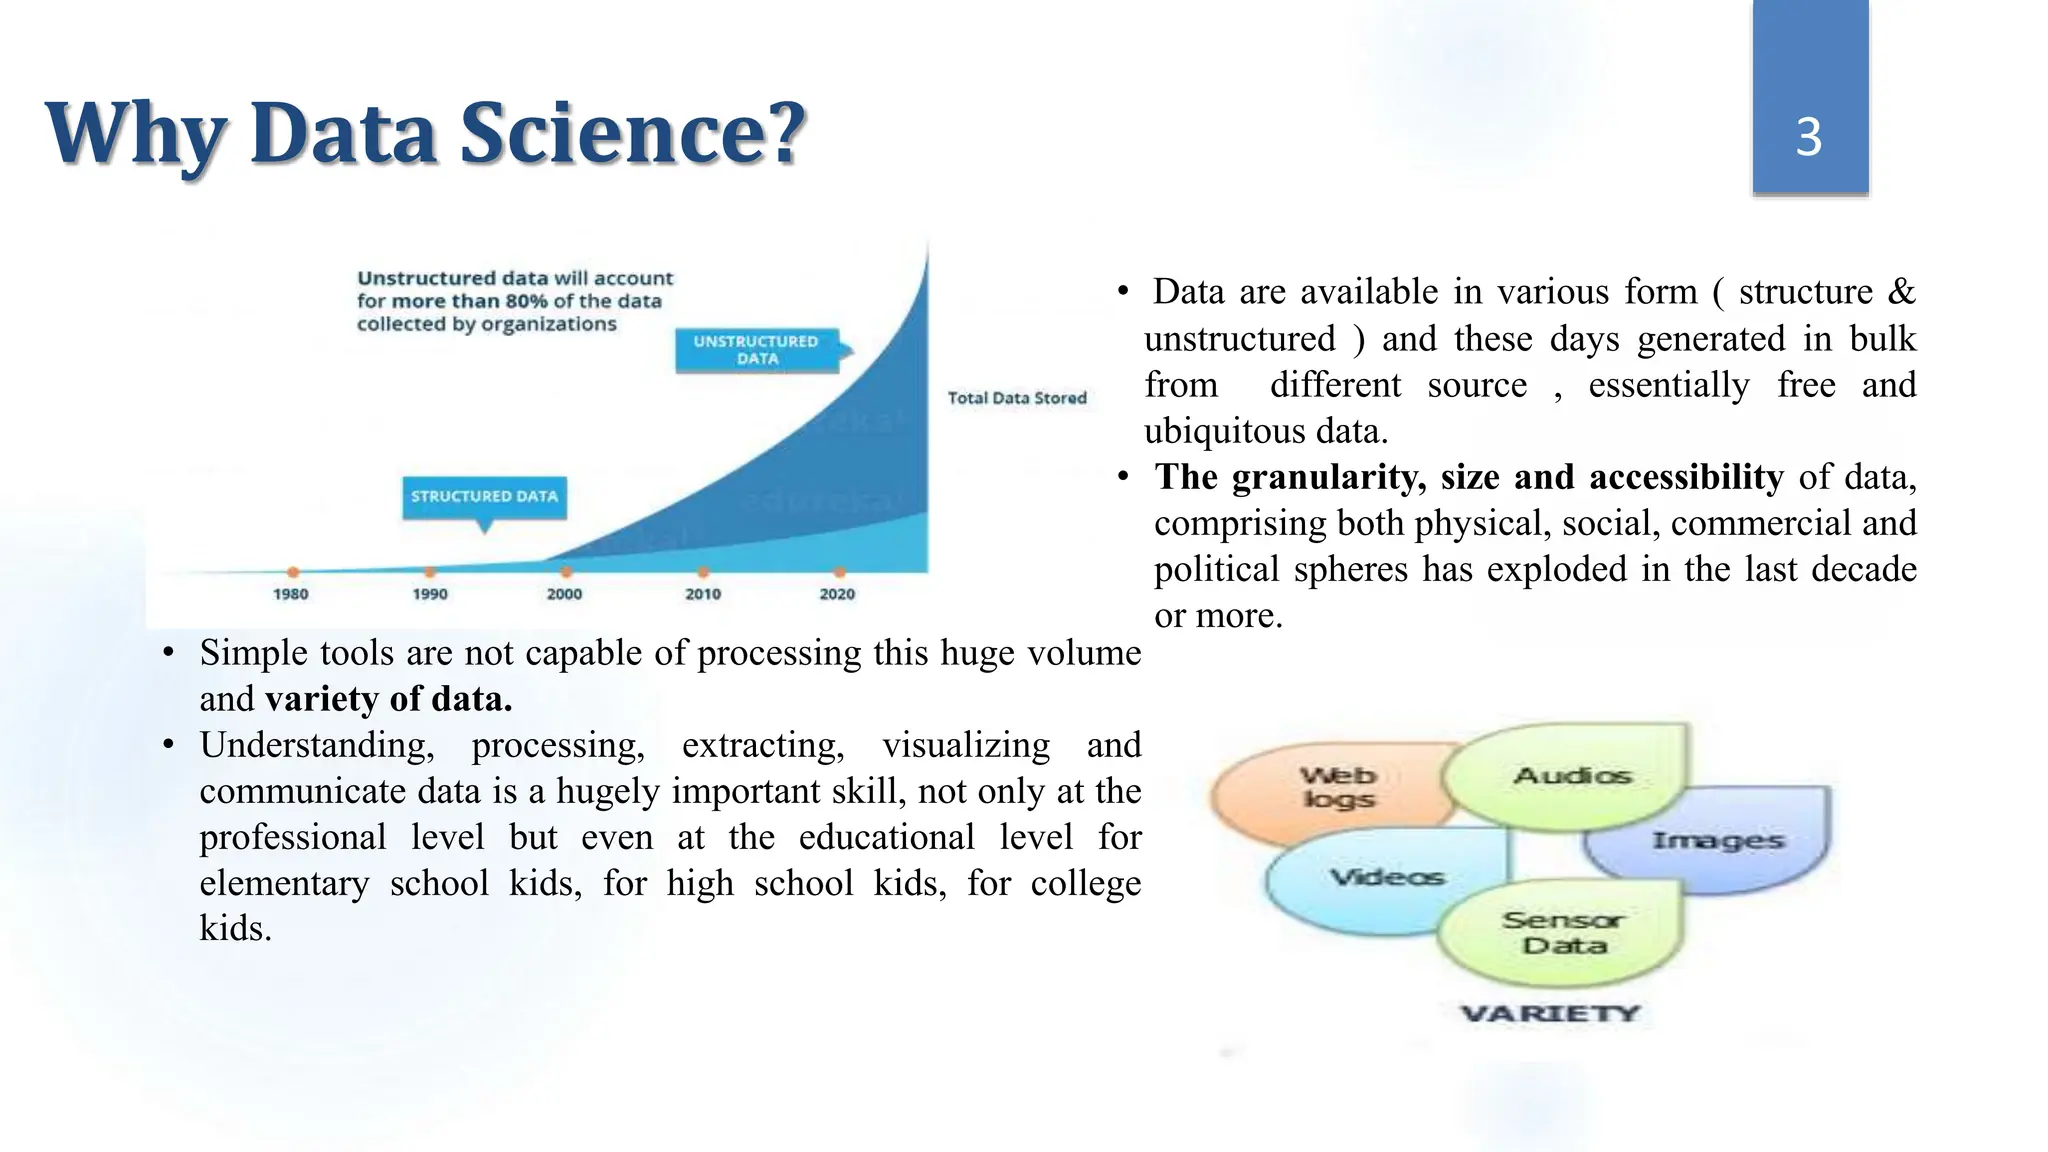
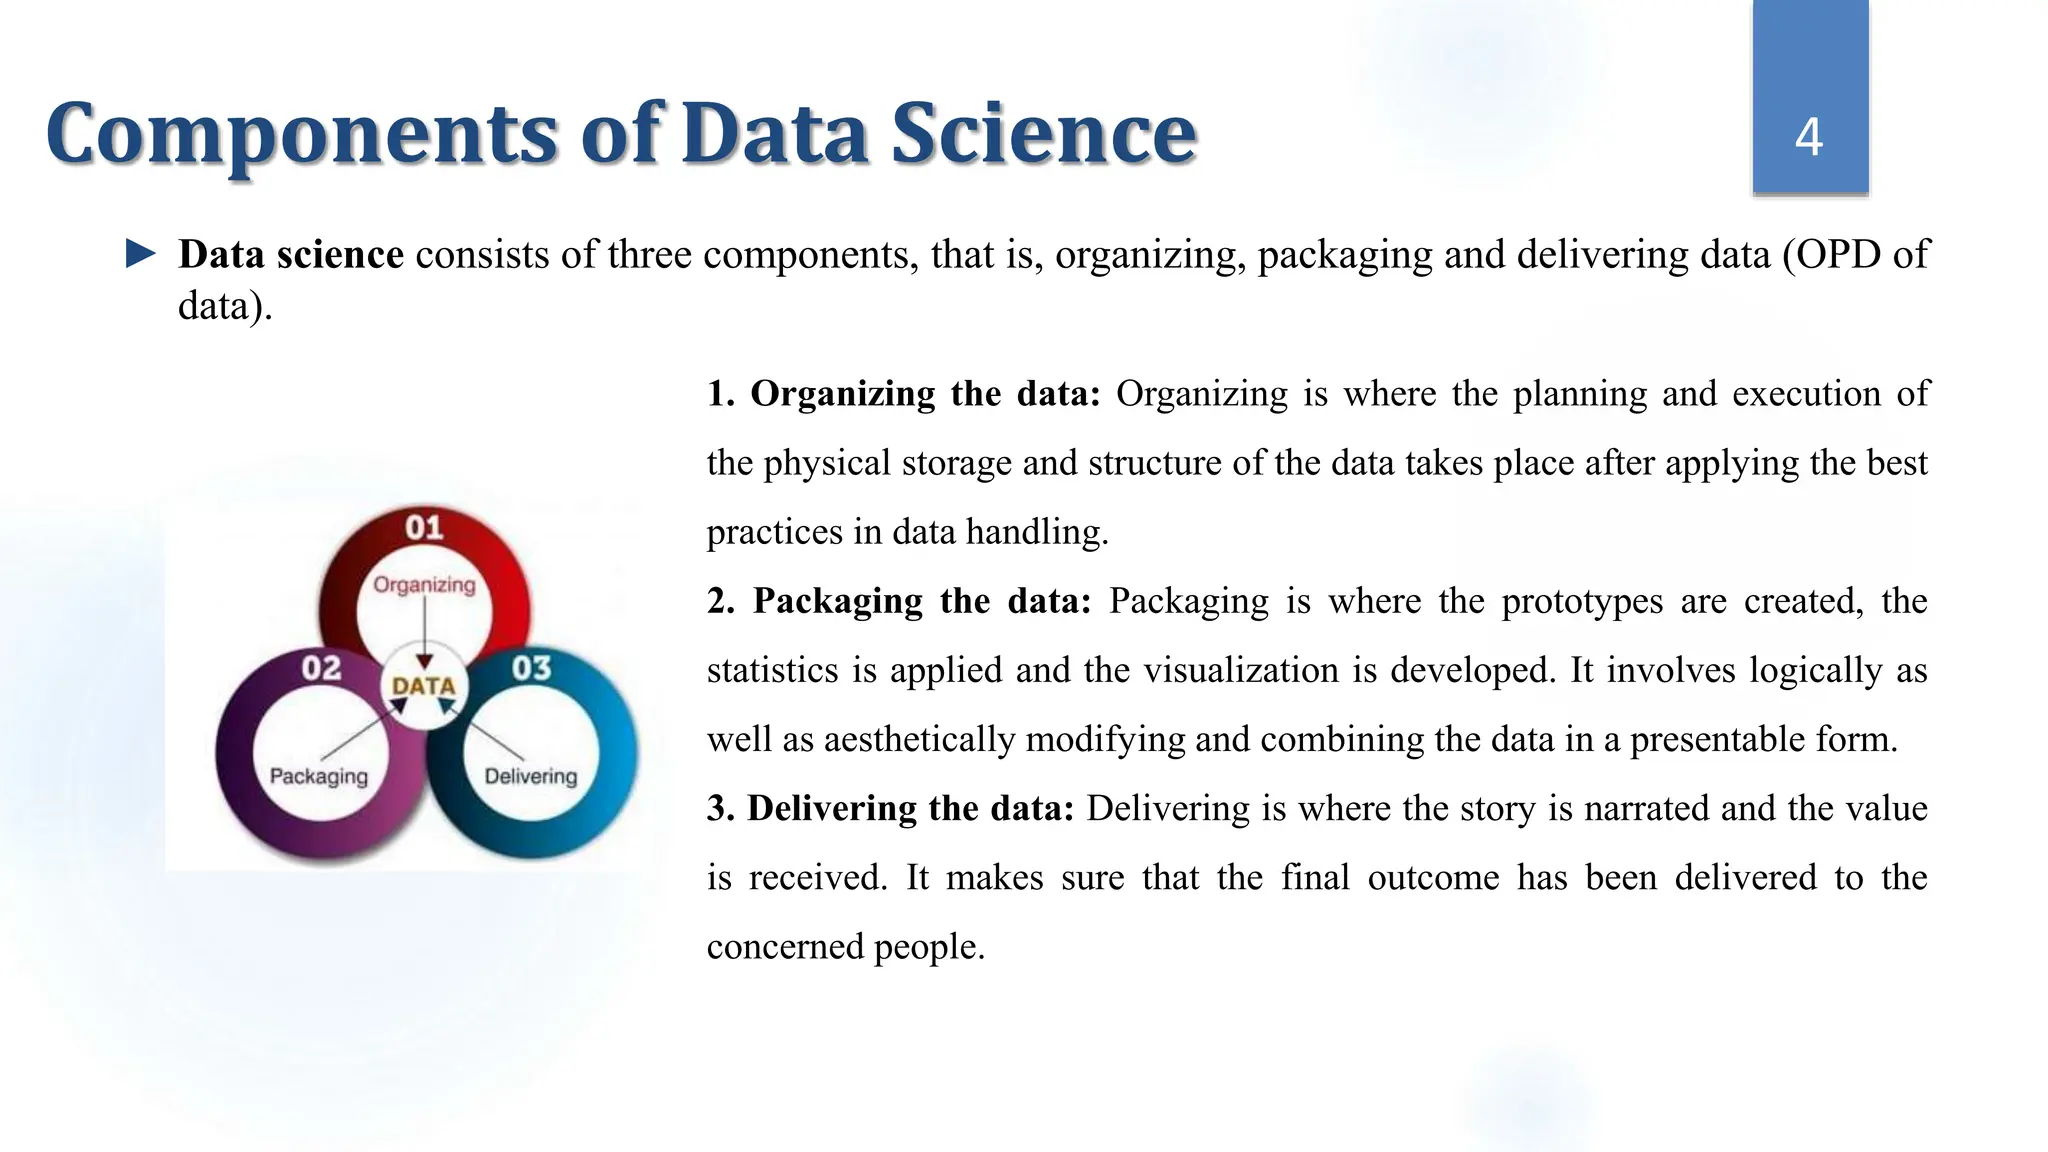
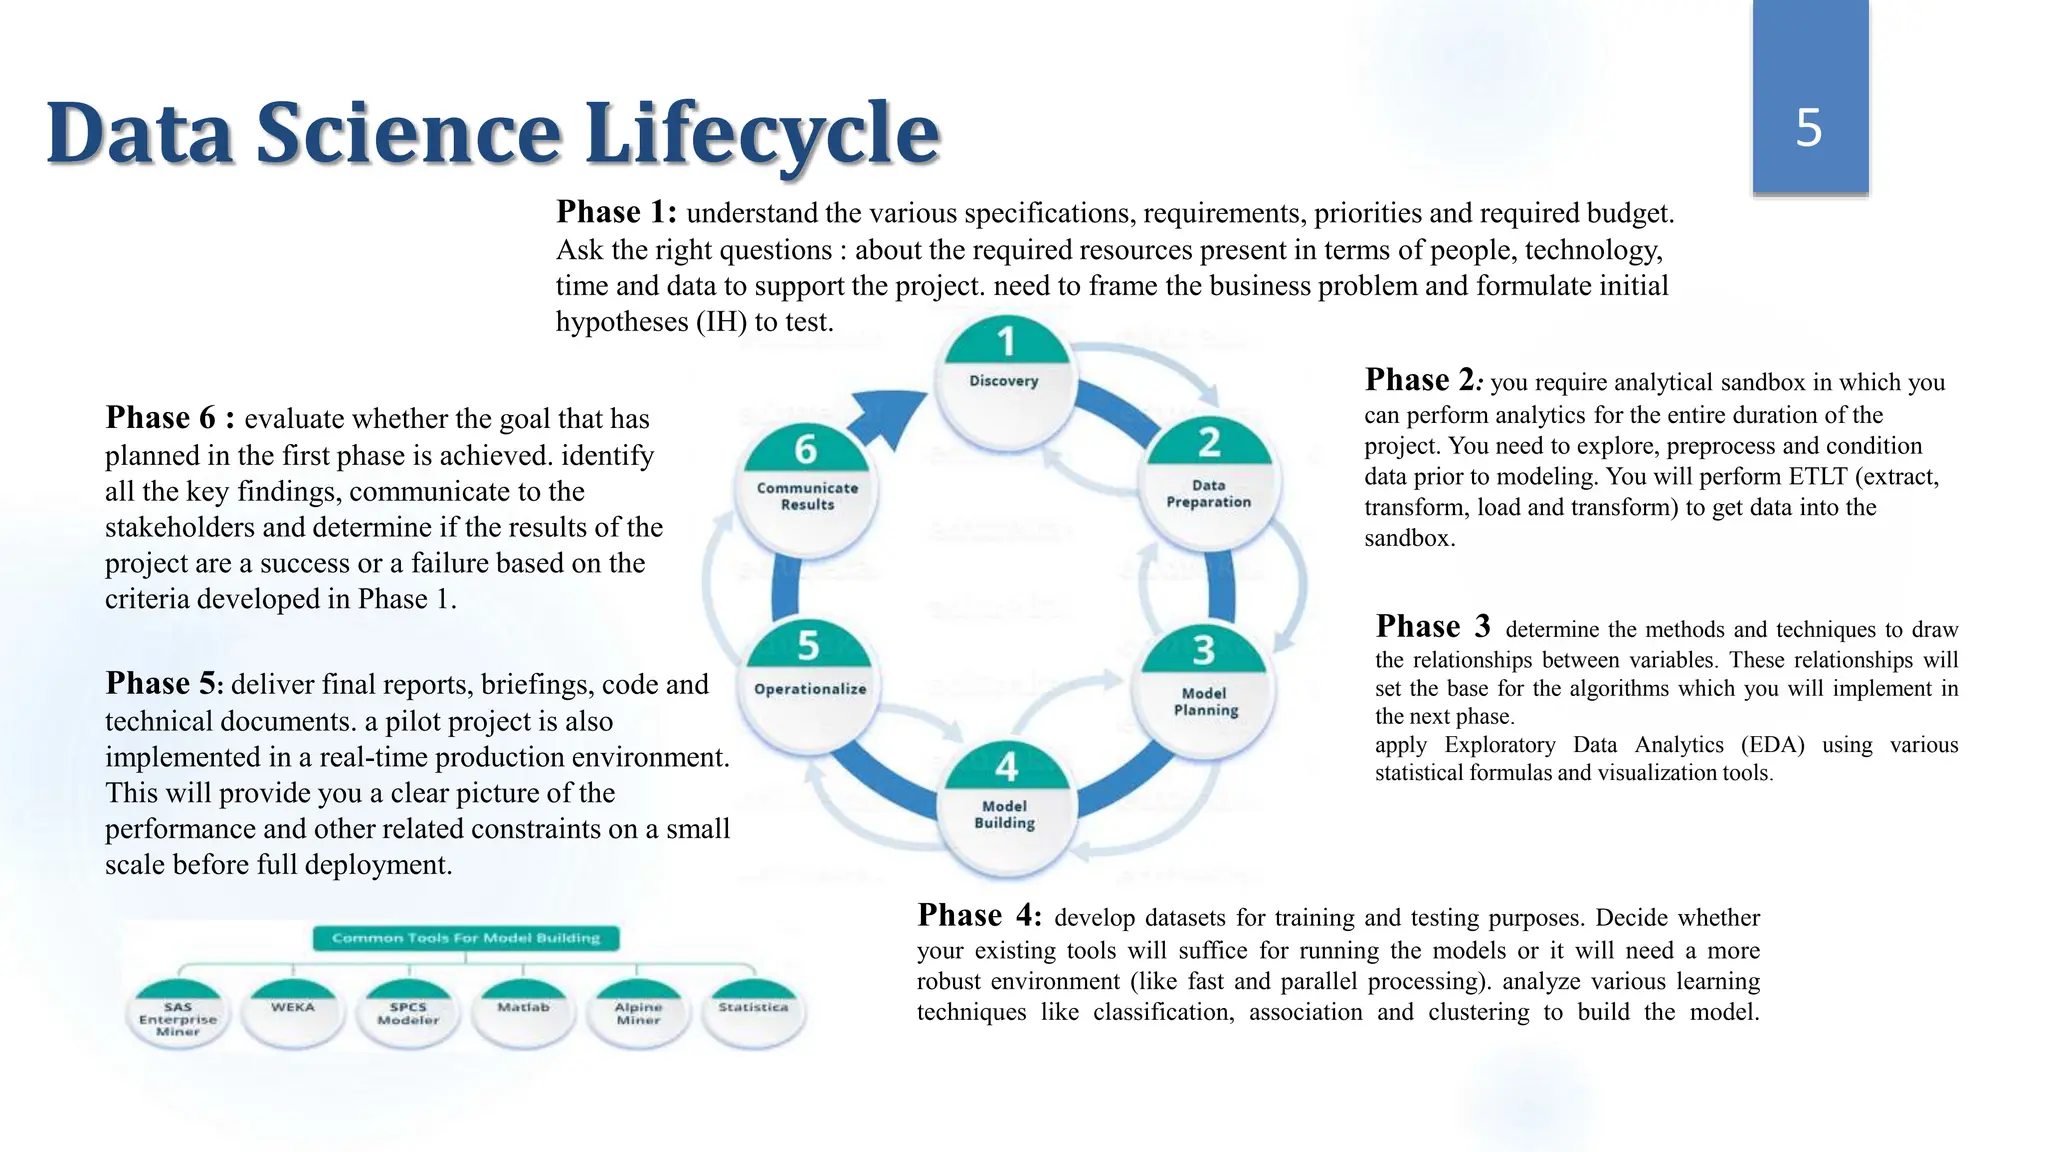
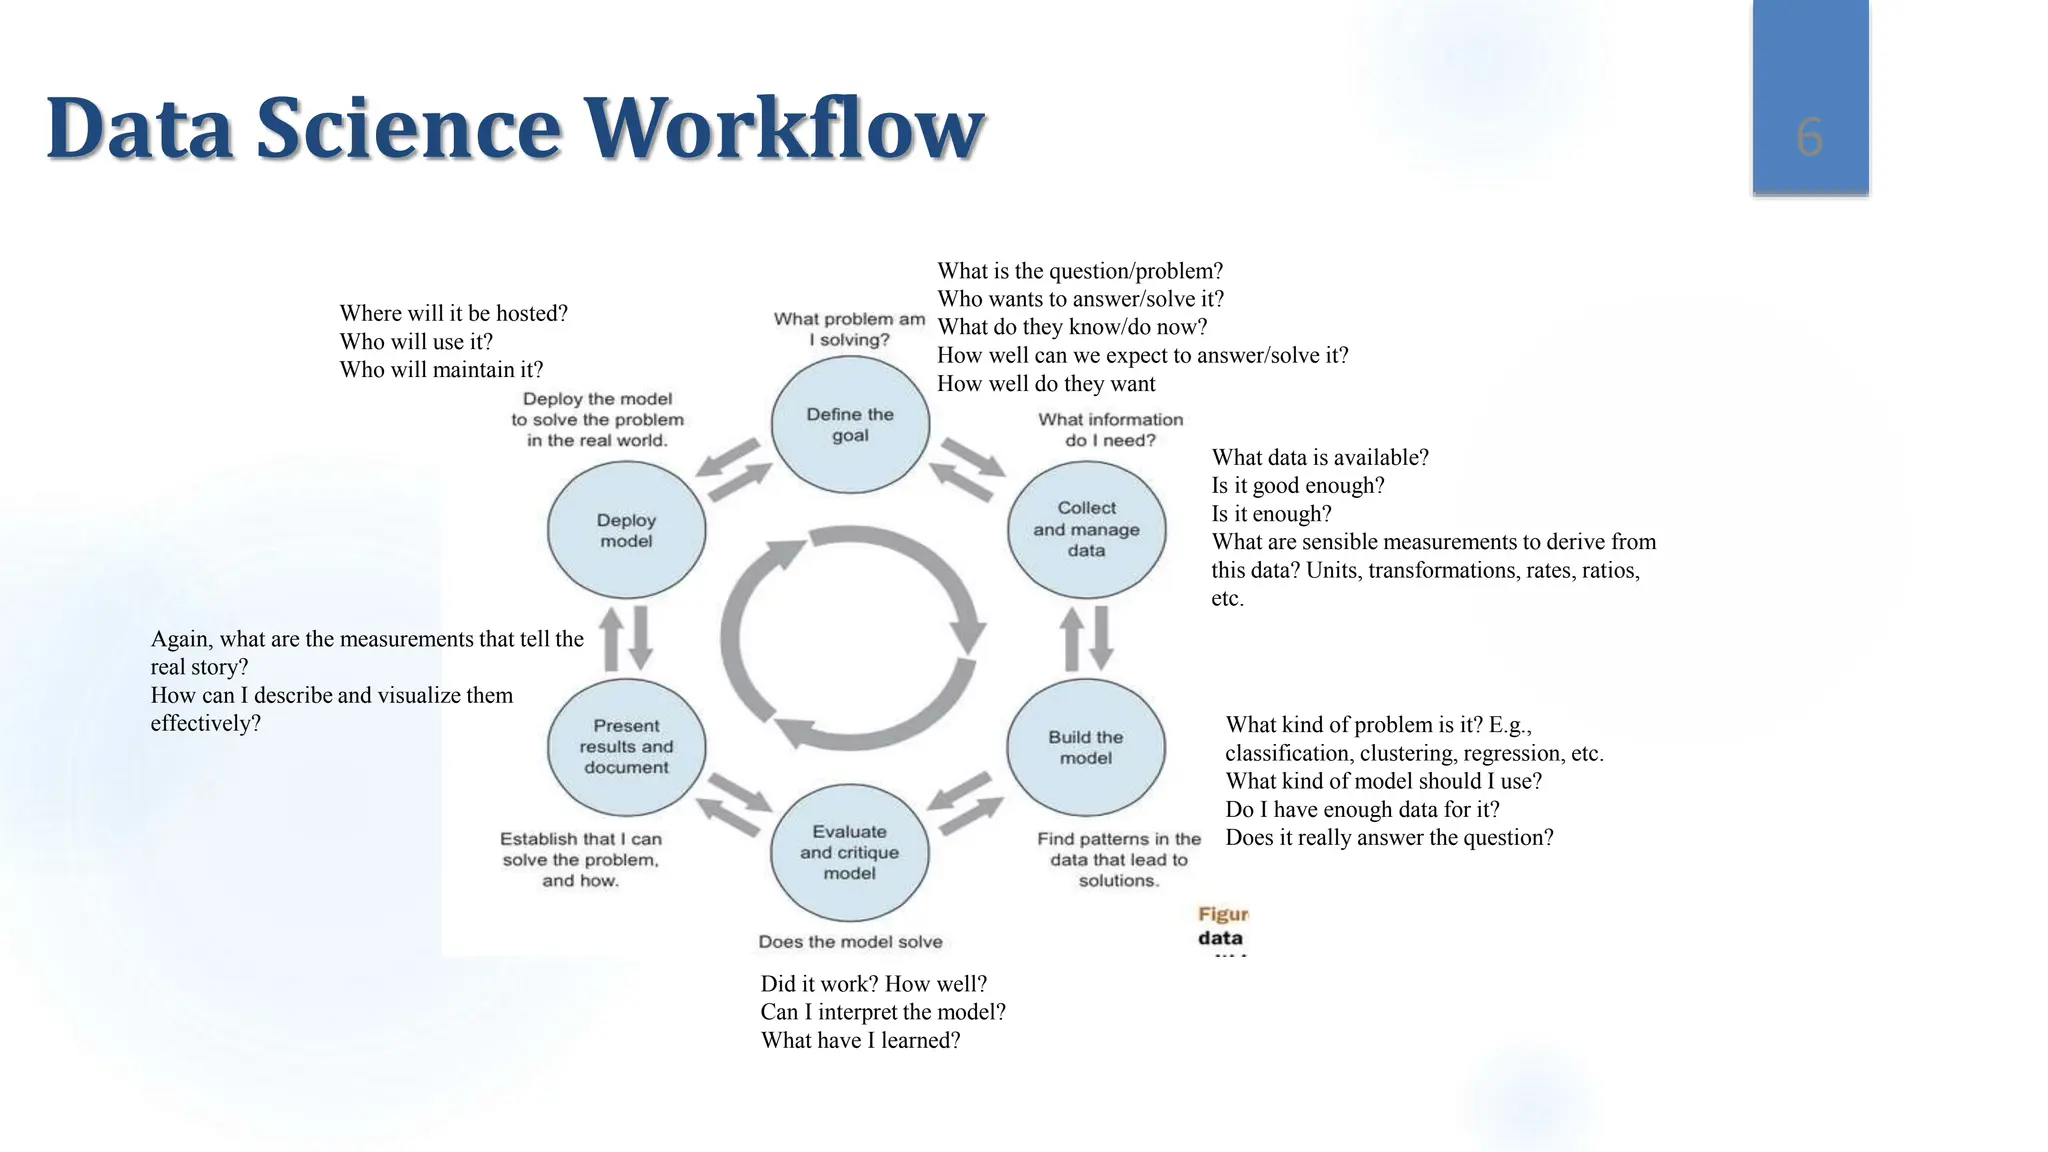
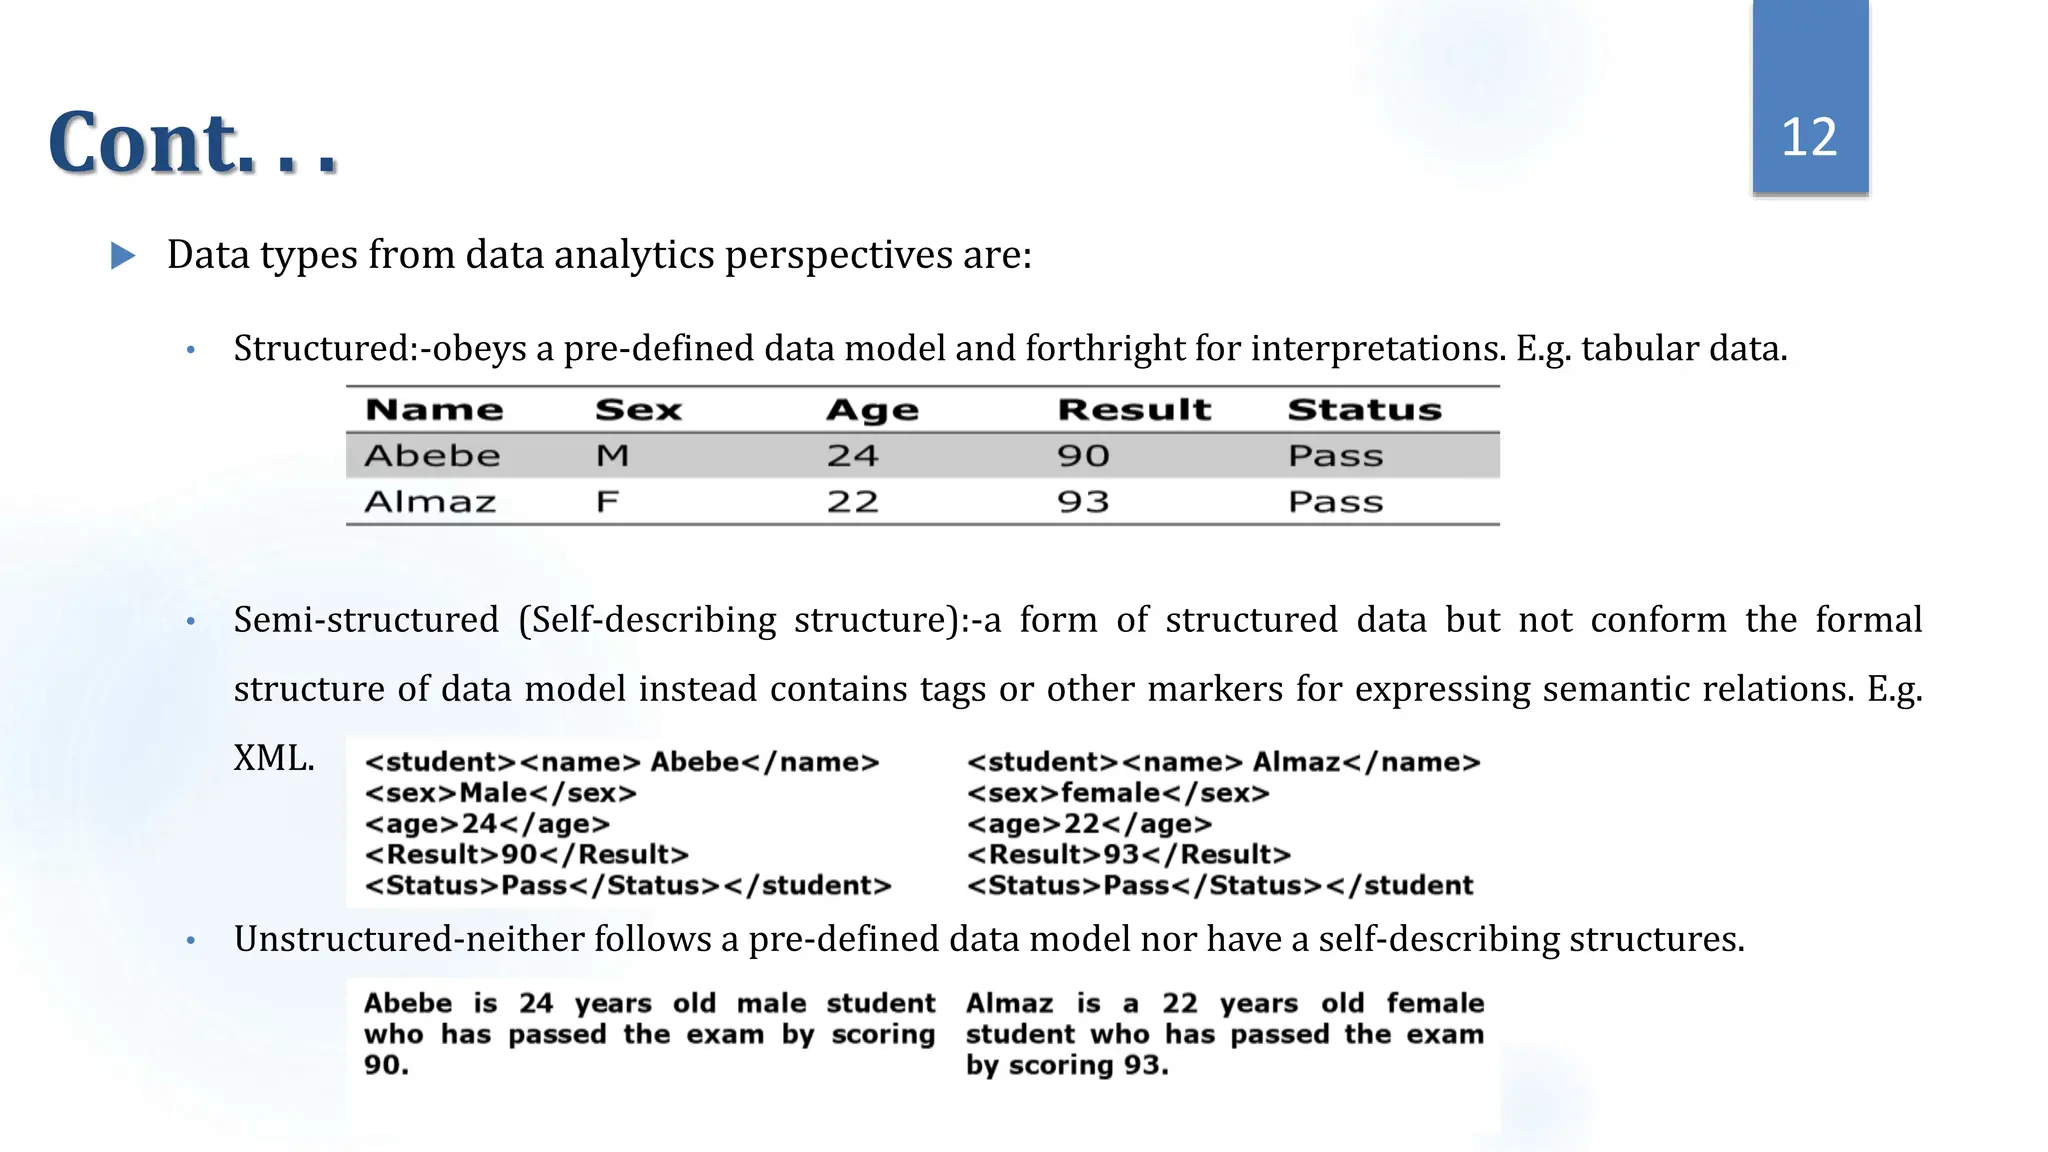
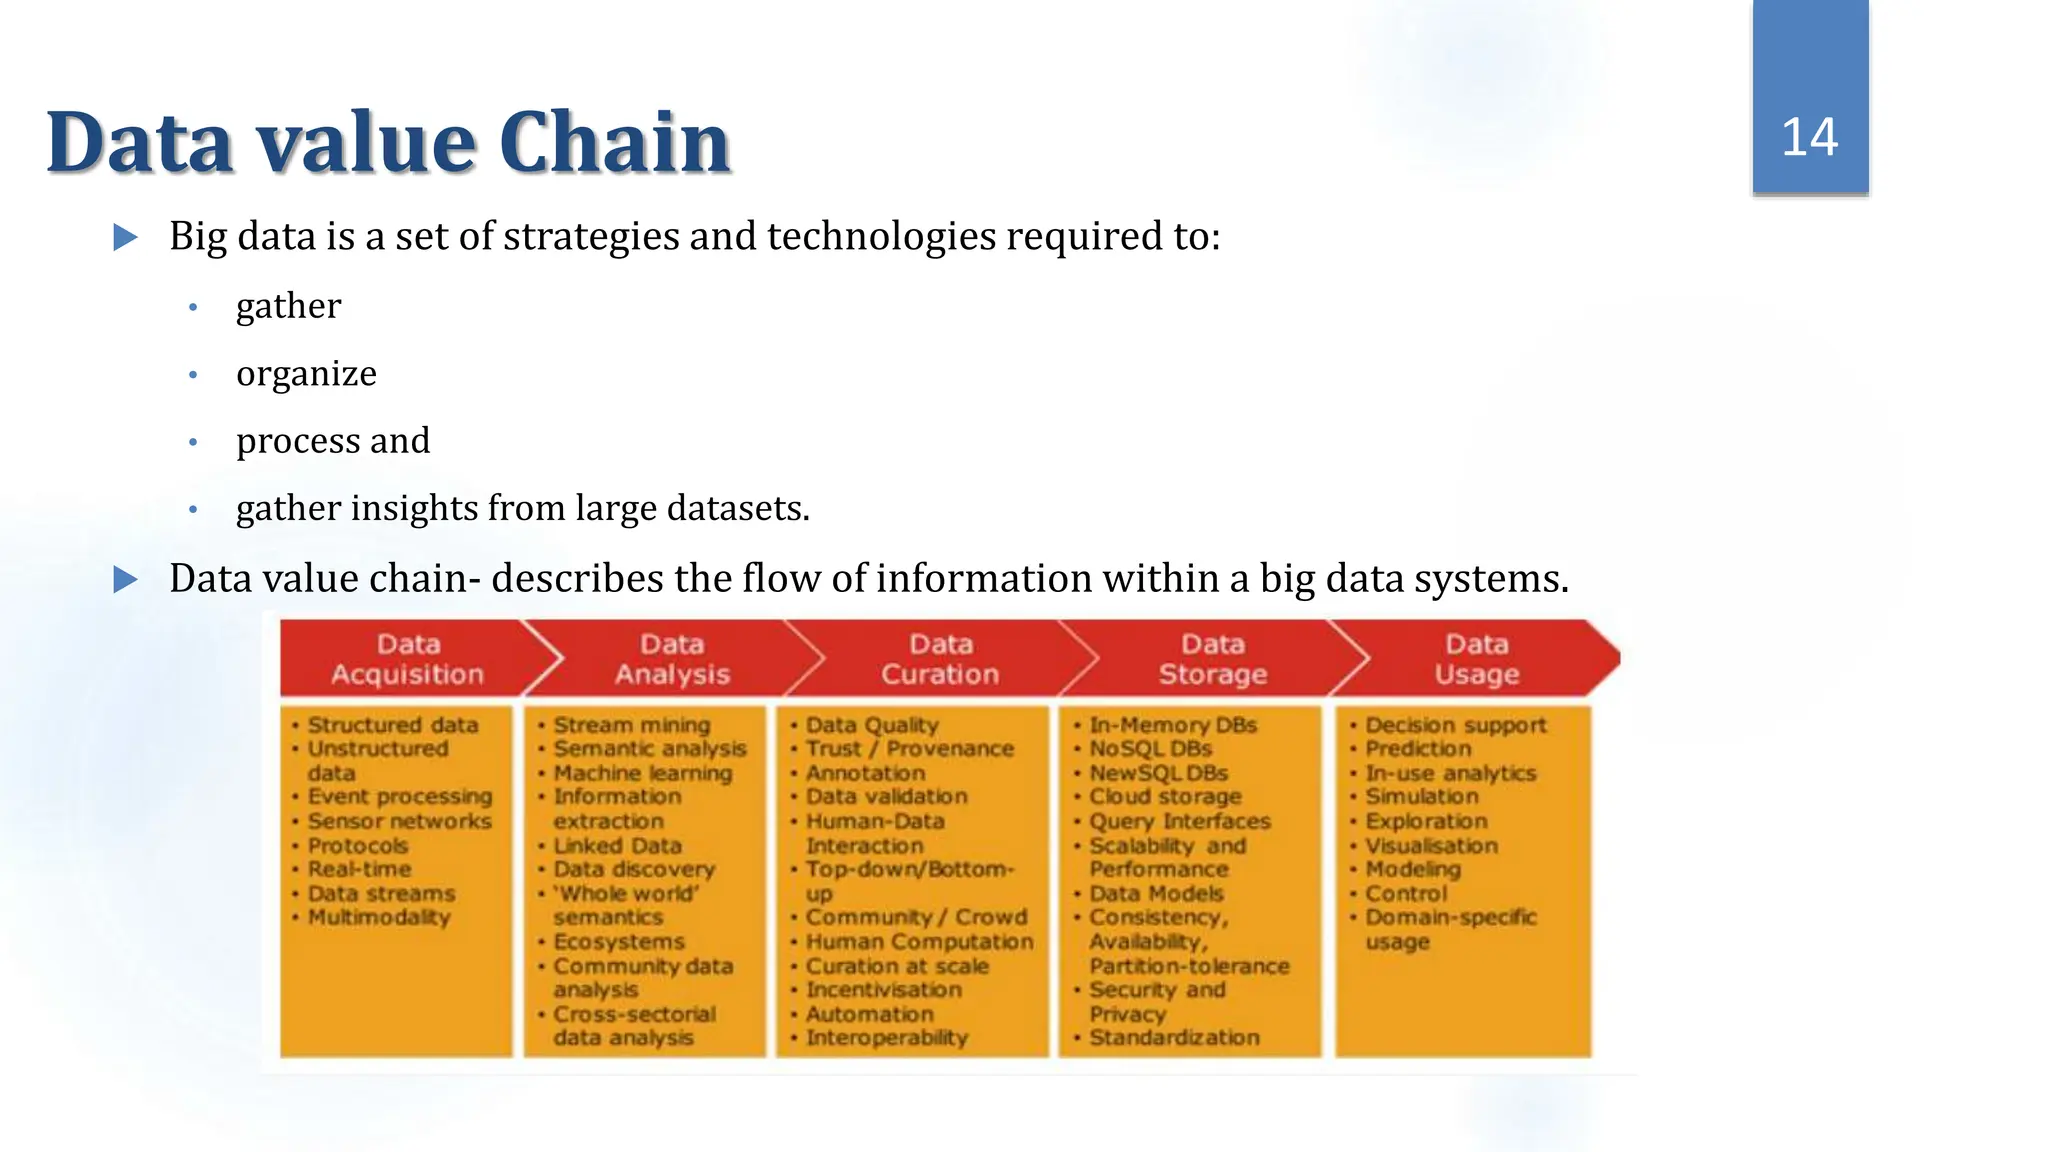
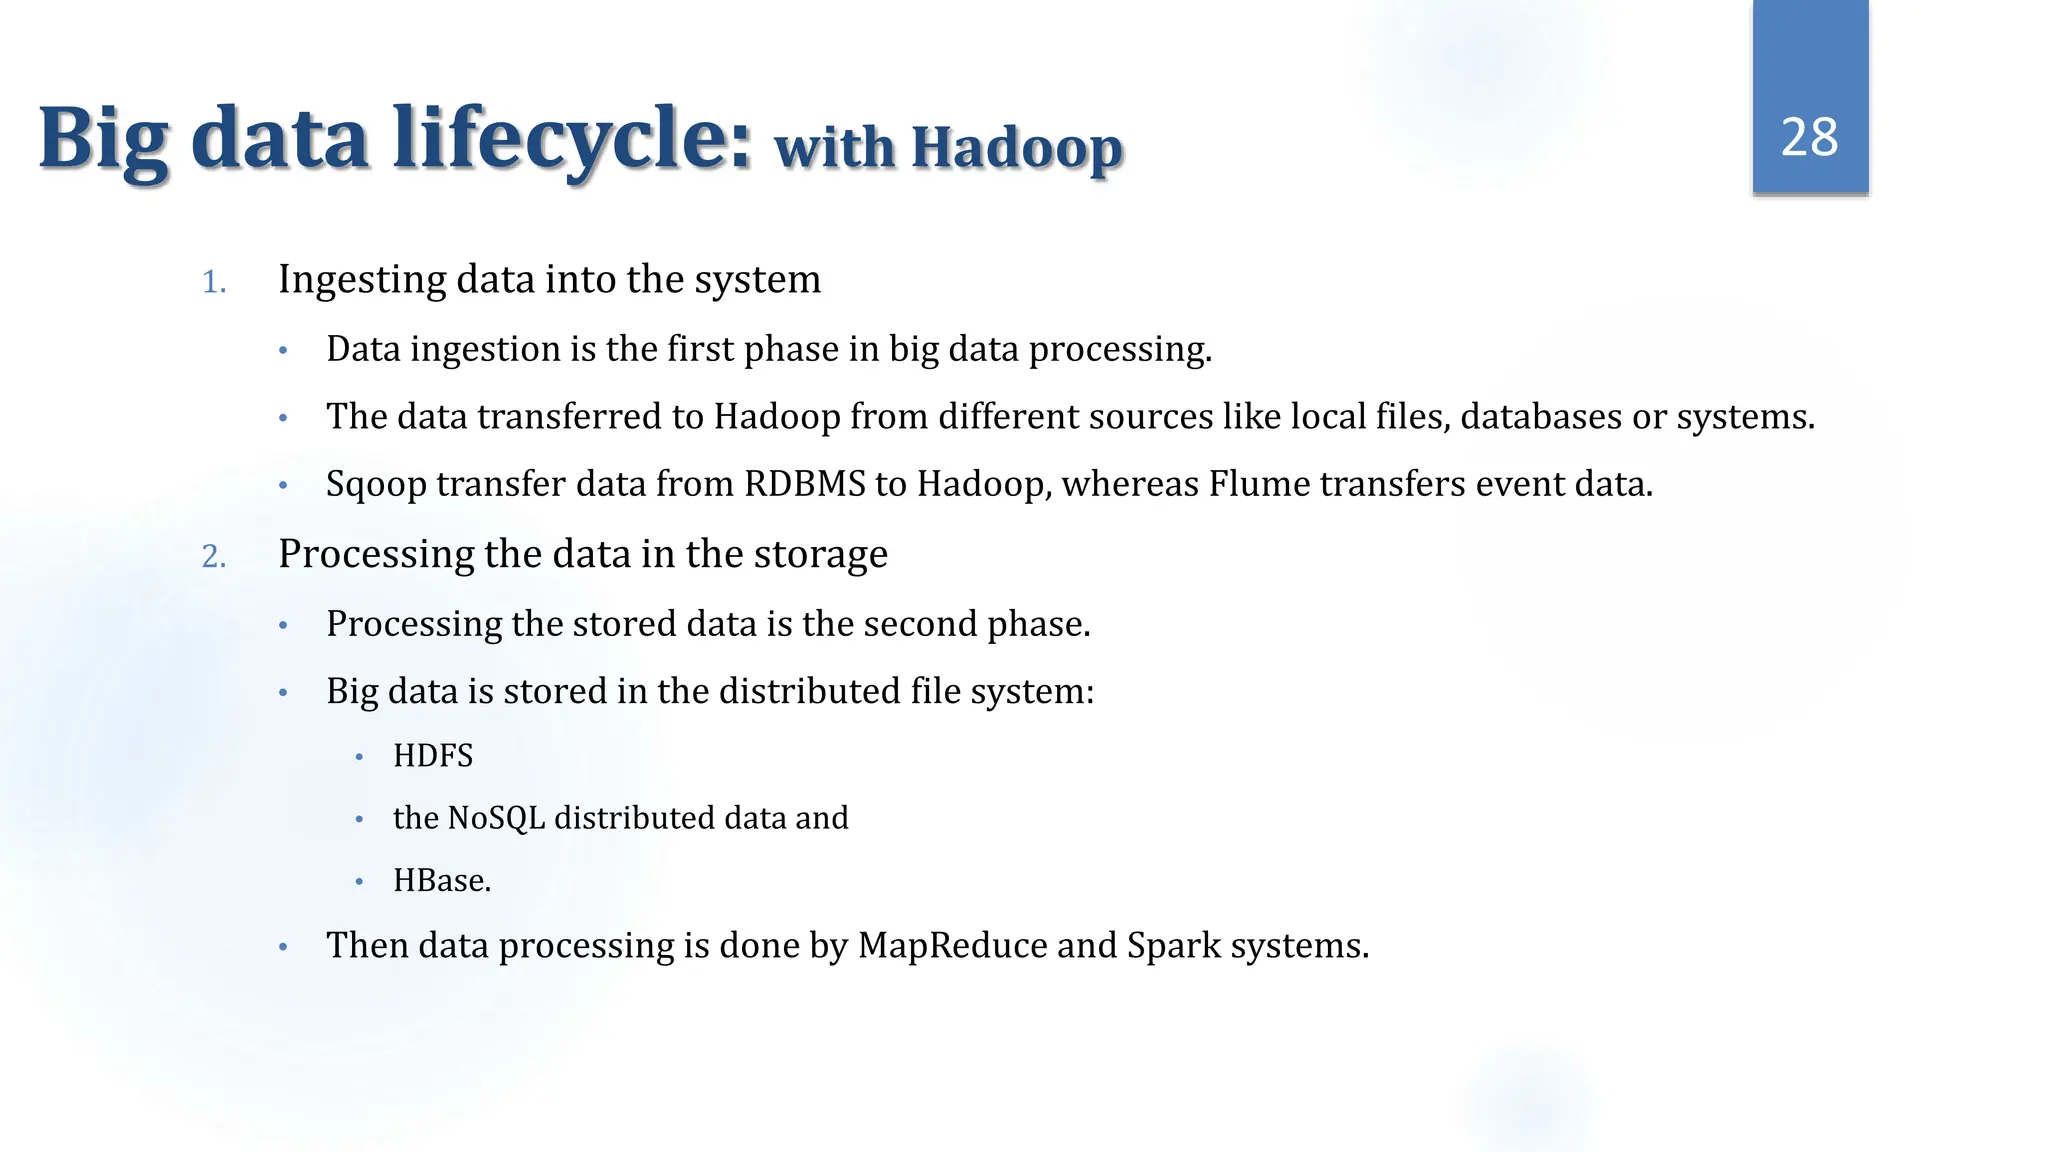
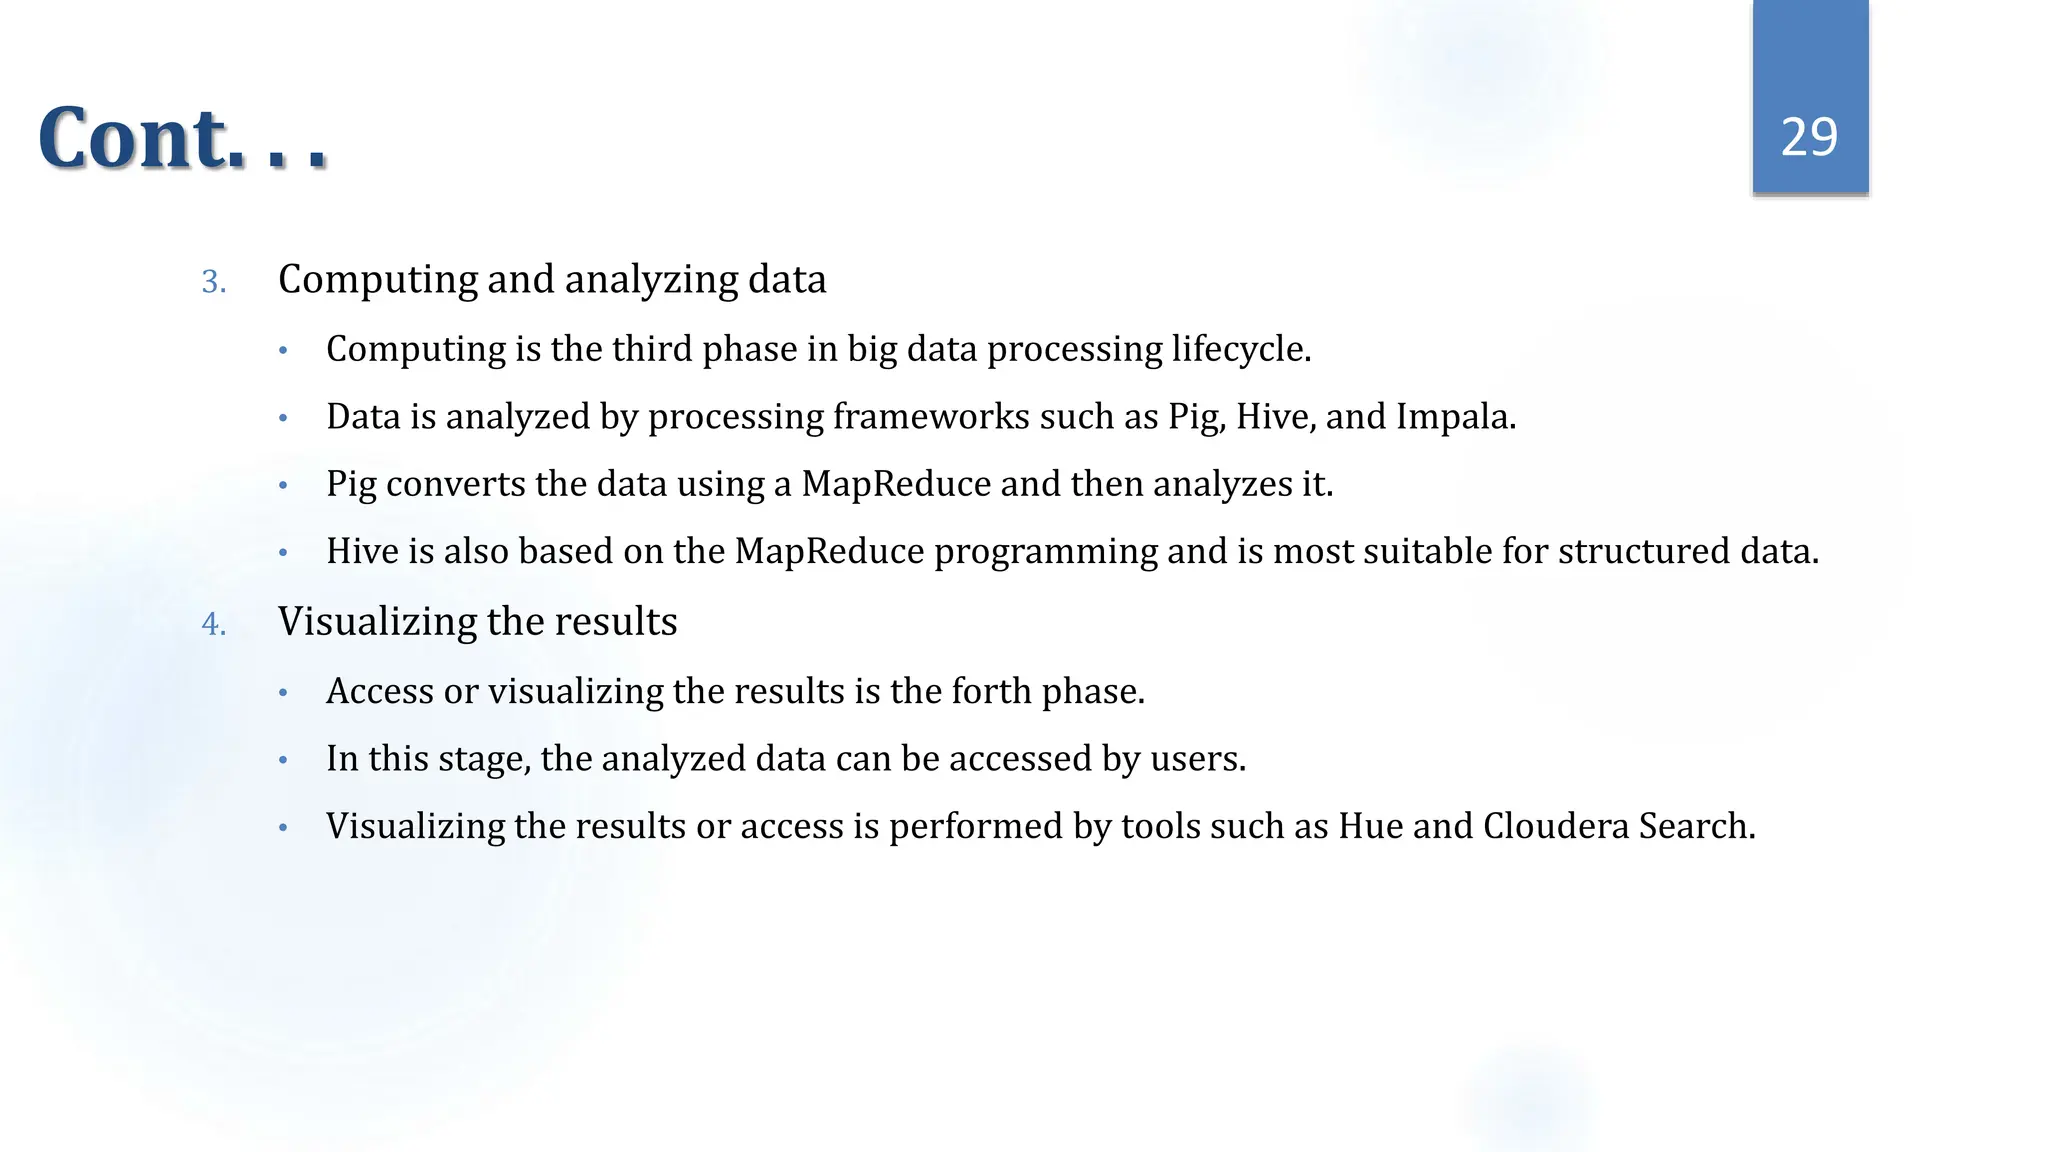
2. Overview of Data Science
Data science is a multi-disciplinary field that uses
• scientific methods, processes, algorithms and systems to extract knowledge from
structured, semi-structured and unstructured sources.
In academic areas data science continues to evolve as
• data mining, data warehousing, data modeling, big data and etc.
It is used for creating data-centric artifacts and applications that can address specific scientific,
socio-political, business related, or other issues.
Data scientist possesses a strong quantitative background
in statistics, linear algebra and programming skills.
2
3. • Simple tools are not capable of processing this huge volume
and variety of data.
• Understanding, processing, extracting, visualizing and
communicate data is a hugely important skill, not only at the
professional level but even at the educational level for
elementary school kids, for high school kids, for college
kids.
• Data are available in various form ( structure &
unstructured ) and these days generated in bulk
from different source , essentially free and
ubiquitous data.
• The granularity, size and accessibility of data,
comprising both physical, social, commercial and
political spheres has exploded in the last decade
or more.
3
Why Data Science?
4. 1. Organizing the data: Organizing is where the planning and execution of
the physical storage and structure of the data takes place after applying the best
practices in data handling.
2. Packaging the data: Packaging is where the prototypes are created, the
statistics is applied and the visualization is developed. It involves logically as
well as aesthetically modifying and combining the data in a presentable form.
3. Delivering the data: Delivering is where the story is narrated and the value
is received. It makes sure that the final outcome has been delivered to the
concerned people.
4
Components of Data Science
► Data science consists of three components, that is, organizing, packaging and delivering data (OPD of
data).
5. Phase 1: understand the various specifications, requirements, priorities and required budget.
Ask the right questions : about the required resources present in terms of people, technology,
time and data to support the project. need to frame the business problem and formulate initial
hypotheses (IH) to test.
Phase 2: you require analytical sandbox in which you
can perform analytics for the entire duration of the
project. You need to explore, preprocess and condition
data prior to modeling. You will perform ETLT (extract,
transform, load and transform) to get data into the
sandbox.
Phase 3 determine the methods and techniques to draw
the relationships between variables. These relationships will
set the base for the algorithms which you will implement in
the next phase.
apply Exploratory Data Analytics (EDA) using various
statistical formulas and visualization tools.
Phase 4: develop datasets for training and testing purposes. Decide whether
your existing tools will suffice for running the models or it will need a more
robust environment (like fast and parallel processing). analyze various learning
techniques like classification, association and clustering to build the model.
Phase 5: deliver final reports, briefings, code and
technical documents. a pilot project is also
implemented in a real-time production environment.
This will provide you a clear picture of the
performance and other related constraints on a small
scale before full deployment.
Phase 6 : evaluate whether the goal that has
planned in the first phase is achieved. identify
all the key findings, communicate to the
stakeholders and determine if the results of the
project are a success or a failure based on the
criteria developed in Phase 1.
5
Data Science Lifecycle
6. What data is available?
Is it good enough?
Is it enough?
What are sensible measurements to derive from
this data? Units, transformations, rates, ratios,
etc.
What kind of problem is it? E.g.,
classification, clustering, regression, etc.
What kind of model should I use?
Do I have enough data for it?
Does it really answer the question?
Did it work? How well?
Can I interpret the model?
What have I learned?
Again, what are the measurements that tell the
real story?
How can I describe and visualize them
effectively?
Where will it be hosted?
Who will use it?
Who will maintain it?
What is the question/problem?
Who wants to answer/solve it?
What do they know/do now?
How well can we expect to answer/solve it?
How well do they want
6 6
Data Science Workflow
7. Data Vs Information
Data is a representation of unprocessed:
• raw facts
• figures
• concepts
• instructions in a formalized manner, which is more suitable for processing, interpretation and
communication by humans or machines.
Data may transfer a piece or partial meaning but not a complete sense.
Data can be represented with the help of characters such as alphabets (A-Z, a-z), digits (0-9) or
special characters (+, -, /, *, , =, etc.) and picture ,sound and video.
7
• figures
• shapes
• tables
• numeric
• alphanumeric
• non-alphanumeric characters
8. Cont. . .
Information:
• is a processed data on which decisions are based and
• transfers a complete meaning.
Information is interpreted data, created from:
• organized
• structured and
• processed data in a particular context.
8
9. Data Processing Cycle
Data processing is a restructuring or reordering of data in order:
• to increase usefulness
• to add values
• to avoid ambiguity
• to deal with complexity and
• for better representations.
Data processing cycle has three main steps:
9
Input Process Output
Storages
10. Cont. . .
Input
• is a data in a convenient form for further processing.
• The format will depend on the purpose of processing and processing machine.
• When a computer used, the input can be:
• directly obtained from users via input-devices.
• fetch from hard disk, CD, flash disk and etc.
Process
• In this step the data obtained as an input further processed into more useful form.
• In electronic computer, a software or an application performs the processing.
Output
• A result of the processing will be fetched as an output.
• The output from a particular process will be the final information required or may be used further as input for another
process.
10
11. Data: types and representations
Data types can be describe from different perspectives.
• From computer programming: data types are attributes of data that controls the compiler or
interpreter how it used data.
• From data analytics: data types simply articulates us how the data exists.
Data types from computer programming perspectives are:
• Integers-to store whole numbers.
• Booleans-to store true/false states.
• Characters-to store a single character.
• Alphanumeric strings-to store combination of characters and numbers.
11
12. Cont. . .
Data types from data analytics perspectives are:
• Structured:-obeys a pre-defined data model and forthright for interpretations. E.g. tabular data.
• Semi-structured (Self-describing structure):-a form of structured data but not conform the formal
structure of data model instead contains tags or other markers for expressing semantic relations. E.g.
XML.
• Unstructured-neither follows a pre-defined data model nor have a self-describing structures.
12
13. Cont. . .
From technical point of view-Meta Data
• Meta data is not a separate data structure.
• It provides additional information about a specific set of data.
• Meta data is a data about data.
• E.g. in a photograph: size, locations, time and etc are meta data.
• Meta data is highly applicable in semantic webs, big data and etc.
13
14. Data value Chain
Big data is a set of strategies and technologies required to:
• gather
• organize
• process and
• gather insights from large datasets.
Data value chain- describes the flow of information within a big data systems.
14
15. Data acquisition
Data acquisition is a process of:
• gathering,
• filtering and
• cleaning data before its putted in data warehouse or further processed.
Data acquisition is a major challenge in big data.
The challenge is because the infrastructure:
• should support low, predictable latency in capturing data and executing query.
• should support dynamic and flexible data structure.
• should handle very high transaction volumes.
15
16. Data analysis
Data analysis involves:
• exploring
• transforming and
• modeling data in order to make the raw data amenable(agreeable) in decision making.
The goals of data analysis are:
• highlighting relevant data
• synthesizing and
• extracting useful hidden information.
Related areas to data analysis includes:
• Data mining
• Business intelligence and
• Machine learning
16
17. Data curation
Data curation refers to an active management of data to ensure its quality.
Data curation includes activities such as:
Data curation is done by data curators.
Data curators are responsible for improving accessibility and quality of the data.
The goals of data curation are:
• ensuring trustworthiness
• making data discoverable
• easing accessibility
• improving data reusability and
• making data fit their purpose
17
• content creation
• selection
• classification
• transformation
• validation and
• preservation of data.
18. Data storage
Data storage
• Is the persistence and management of data in a scalable way.
• It guarantees the applications fast access to the data.
Relational Database Management Systems(RDBMS):
• RDBMS have been the main solution for data storage for almost 40 years.
• RDBMS have a property called ACID(atomicity, consistency, isolation and duration).
• ACID properties lacks flexibility with regard to schema change, fault tolerance and data volume(complexity)
increase.
• Lack of flexibility makes RDBMS unsuitable for big data science.
ACID properties in DBMS are:
• Atomicity: tells that the entire transaction takes place at once or doesn't happen at all.
• Consistency: states that the database must be consistent before and after the transaction.
• Isolation: multiple transaction should occur independently without interference.
• Durability: changes made by a successful transaction should occur even if the system failure happens.
NoSQL data storage technologies designed as an alternative data model to support flexibility and scalability in
data storage.
18
19. Data usage
Data usage covers data-driven business activities that needs
• access to data
• its analysis and
• the tools needed to integrate the data analysis within the business activity.
Data usage in business decision making can enhance competitiveness through
• reduction of costs
• increased added value, or any
• other parameter that can be measured against existing performance criteria.
19
20. Big data: Basic concepts
Big data is a large and complex collection of data sets.
Big data is a set of strategies and technologies required to:
• gather
• organize
• process and
• gather insights from large datasets.
Why big data? Big data is because:
• the volume of data drastically increased over time.
• the data set in organizations becomes so large it becomes difficult ( almost impossible) to process
using
on-hand database management tools or
traditional data processing applications.
20
21. • Due to the advent of new technologies, devices, and communication means like social
networking sites, IoT and soon the amount of data produced by mankind is growing
rapidly every year.
.
5B GB/2dys
5B GB / 10min
5B GB
Data produced
Before 2003 In 2011 In 2013
The amount of data produced by us
If this data is stored inside disks and pile up them, it may fill an
entire football field
Cont… 21
22. Cont…
Big data is characterized by 3V and more:
• Volume: large amounts of data Zeta bytes/Massive datasets
• Velocity: Data at live streaming or in motion
• Variety: data comes in many different forms from diverse sources
• Veracity: can we trust the data? How accurate is it? etc..
22
23. Clustered computing and Hadoop
Clustered computing:
• Due to big data individual computers are inadequate for computing.
• Therefor for addressing computational and high storage need of big data clustering
appeared.
• Big data clustering software combines the resources of many smaller machines.
Advantages of clustered computing:
• Resource pooling-combining available storage space, CPU and memory for processing large
datasets.
• High availability- clustering embraces fault tolerant and robust computing environment for
increasing availability.
• Easy scalability-clustered computing is easily scalable horizontally by adding additional
resources to the cluster.
23
24. Cont…
Clustered computing requires:
• managing cluster membership
• coordinating resource sharing and
• scheduling actual work on individual nodes.
Cluster membership and resource allocation can be handled by software like Hadoop’s
YARN.
YARN is an acronym stands for “Yet Another Resource Negotiator”.
24
25. Hadoop and Its ecosystem
Hadoop is an open-source framework.
It is designed to make interaction with big data easier.
Hadoop allows distributed processing of large datasets across clusters like parallel
computing.
Hadoop has four key characteristics:
• Economical-its economical because it used ordinary computers for extensive computation.
• Reliable-as it stores copies of the data on different machines.
• Scalable-it can be scaled simply by adding machines t the cluster.
• Flexible-it can store as much structured and unstructured data.
Hadoop has four key components:
• Data management
• Data access
• Data process
• Data storage
25
26. Hadoop ecosystem
Hadoop ecosystem evolved from its four components mentioned on previous slide.
Generally the Hadoop ecosystem consists of:
26
• HDFS: Hadoop Distributed File System
• YARN: Yet Another Resource Negotiator
• MapReduce: Programming based Data
Processing
• Spark: In-Memory data processing
• PIG, HIVE: Query-based processing of data
services
• HBase: NoSQL Database
• Mahout, Spark MLLib: Machine Learning algorithm
libraries
• Solar, Lucene: Searching and Indexing
• Zookeeper: Managing cluster
• Oozie: Job Scheduling
28. Big data lifecycle: with Hadoop
1. Ingesting data into the system
• Data ingestion is the first phase in big data processing.
• The data transferred to Hadoop from different sources like local files, databases or systems.
• Sqoop transfer data from RDBMS to Hadoop, whereas Flume transfers event data.
2. Processing the data in the storage
• Processing the stored data is the second phase.
• Big data is stored in the distributed file system:
• HDFS
• the NoSQL distributed data and
• HBase.
• Then data processing is done by MapReduce and Spark systems.
28
29. Cont. . .
3. Computing and analyzing data
• Computing is the third phase in big data processing lifecycle.
• Data is analyzed by processing frameworks such as Pig, Hive, and Impala.
• Pig converts the data using a MapReduce and then analyzes it.
• Hive is also based on the MapReduce programming and is most suitable for structured data.
4. Visualizing the results
• Access or visualizing the results is the forth phase.
• In this stage, the analyzed data can be accessed by users.
• Visualizing the results or access is performed by tools such as Hue and Cloudera Search.
29