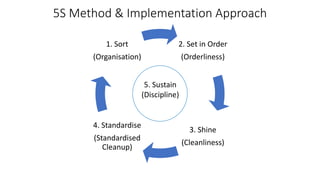
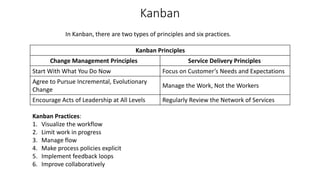
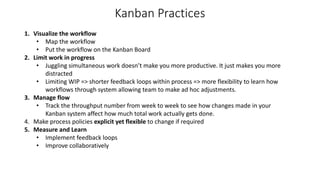
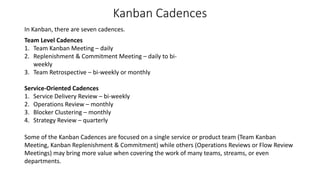
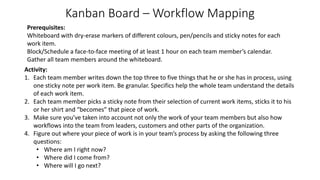
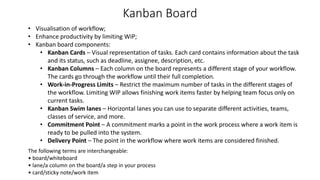
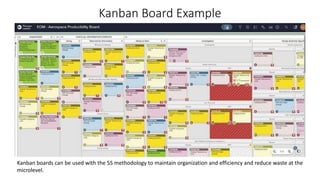
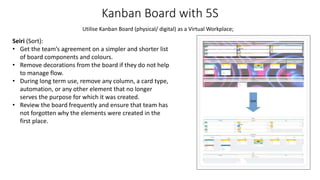
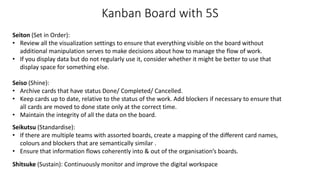
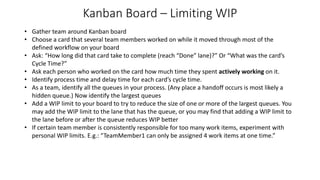
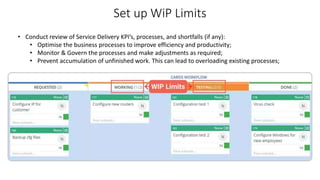
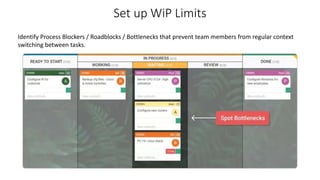
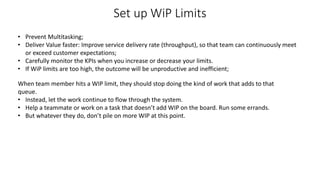
2. Lean Operations Management
I. Global Supply Chain Interdependencies
II. Lean Methodology
III. 5S
IV. SMED
V. Kaizen
VI. Jidoka
VII. Poka Yoke
VIII. Kanban
IX. Andon
X. Card-based systems
XI. Heijunka
3. Global Supply Chain Interdependencies and COVID-19
Impacts
Reactive measures for response
include:
• Stop doing cost-intensive individual
developments that can instead be
delivered using standard software or
Robotic Process Automation;
• Do Same for Less: optimise Labour
costs but not product quality;
• Do More for Less: Reduce
operational costs, and have a KPI-
driven continuous improvement
process for ongoing identification of
areas to reduce business and IT
effort for both tactical and long-term
savings
6. Toyota v4L (learning) principles
Systematically focus on the v4L balance:
• Variety: Balance market demands and operational efficiency
• Velocity: Maintaining a steady flow throughout the system enables capacity planning to be
synchronized across the supply chain.
• Variability: Reducing variability enables all the supply chain flows to operate with low levels of
inventory. It also enables quality improvement processes to operate without interruption, thus
enabling continuous cost reductions and quality improvements.
• Visibility: Visibility of all processes is ensured with use of the right metrics and the requirement
that a consensus be reached before plans are changed.
Performance metrics and Process compliance have equal weightage. Ensure that bottlenecks are
visible and responses immediate, changes are deliberate, velocity is maintained, variety is
synchronized to demand, and variability is minimized.
7. Push Vs Pull Forecasting
Traditional Push Forecasting Demand (Pull) Driven Approach
Unreliable service levels Best in class service levels
Poor visibility (legacy forecasting distortions) Actual demand-driven data
Push and promote Position and Pull
Unpredictable supply levels Strategic stocking points
Inventory swings Dampen variability (reduced “bullwhip” effect)
Market fluctuations Pace to actual demand
Distorted information from one end of a supply chain to the other can lead to tremendous
inefficiencies:
• Excessive inventory investment,
• Poor customer service,
• Lost revenues,
• Misguided capacity plans,
• Ineffective transportation, and
• Missed production schedules.
8. Types of Waste in Supply Chain
Over-Production:
• Faulty process flows
• Ineffective forecasting techniques
• Lack of production schedule design/adherence
Waiting Time:
• Machinery or system downtime
• Faulty resource planning
• Unplanned work allocation
• Insufficient workforce
• Faulty communication techniques
Transportation:
• Faulty factory or office lay-out
• Poor machinery set-up and design
• Lack of seamless flow between processes, upstream
and downstream
Over-Processing:
• Excessive reporting
• Duplicate entry of data at various stages
• Back and forth flow of queries related to the same documents
• Re-work caused by human errors.
Motion:
• Unwanted movement of tools or employees
• Faulty office/factory layout and misplaced tools and
resources
• Inappropriate location (and potentially also design) of
tools, parts inventories and fixtures
Excess Inventory:
• Faulty demand forecasting techniques
• Bottlenecks within the end-to-end process flow
• More emphasis on push techniques of production
• Ineffective monitoring systems, Faulty supplier/vendor management
Defects:
• Low quality of documented procedures
• Ineffective training plans
• Lack of robust system controls
• Weak quality control mechanisms
• Substandard inputs
Intellect:
• Best ideas usually come from the ones who do the job daily –the
employees
• Ask them for ideas to improve a product or service.
• This helps identify the pain points the employees face
9. Lean Operations Management
Create value for the customer by eliminating unnecessary activities, following a systematic
approach to reduce waste, increase efficiency, continuously improve, optimise resources and
workflow.
Lean Operations Management originated in the manufacturing industry but has since been
applied to a wider range of sectors, including healthcare, office, and service industries. Lean
Operations Management tools include:
• 5S,
• SMED,
• Kaizen,
• Poka Yoke,
• Kanban,
• Andon, and
• Various card-based systems
10. 5S Method & Implementation Approach
2. Set in Order
(Orderliness)
3. Shine
(Cleanliness)
4. Standardise
(Standardised
Cleanup)
1. Sort
(Organisation)
5. Sustain
(Discipline)
11. 5S
5S is often the first step in implementing Lean Operations Management.
5S provides the foundation on which other lean methods, such as TPM, cellular manufacturing, just-
in-time production, and six sigma can be introduced.
The pillars of 5S stand for:
• Sort (Seiri): Remove unnecessary items from the workspace.
• Set in order (Seiton): Organize the remaining items in a logical manner.
• Shine (Seiso): Clean the workspace thoroughly.
• Standardise (Seiketsu): Create a set of standards for maintaining the workspace.
• Sustain (Shitsuke): Continuously monitor and improve the workspace.
Benefits of 5S:
• A clean, organized, and safe workplace that promotes efficiency and reduces errors.
• Reduce the time it takes to find tools and materials, prevent accidents, and improve quality.
• Significant reductions in the square footage of space needed for existing operations.
12. 5S pillar 1 – Sort (Seiri)
• Identify unneeded items with an effective visual method called "red tagging“.
• This involves evaluating the necessity of each item in a work area and dealing with it
appropriately.
• A red tag is placed on all items that are not important for operations or that are not in the proper
location or quantity.
• Once the red tag items are identified, these items are then moved to a central holding area for
subsequent disposal, recycling, or reassignment.
• Organizations often find that sorting enables them to reclaim valuable floor space and eliminate
such things as broken tools, scrap, and excess raw material.
13. 5S pillar 2 – Set in Order (Seiton)
• Set in Order can only be implemented once the first pillar, Sort, has cleared the work area of
unneeded items.
• Set In Order focuses on creating efficient and effective storage methods to arrange items so that
they are easy to use and to label them so that they are easy to find and put away.
• Strategies for effective Set In Order include painting floors, affixing labels and placards to
designate proper storage locations and methods, outlining work areas and locations, and
installing modular shelving and cabinets.
14. 5S pillar 3 – Shine (Seiso)
• Thoroughly clean the work area.
• Daily follow-up cleaning is necessary to sustain this improvement.
• Once working environment is clean, it is easier for workers to notice malfunctions in equipment
such as leaks, vibrations, breakages, and misalignments. These changes, if left unattended, could
lead to equipment failure and loss of production.
• Organizations often establish Shine targets, assignments, methods, and tools before beginning
the shine pillar.
15. 5S pillar 4 – Standardise (Seiketsu)
• This pillar maintains the first three pillars & creates a consistent approach with which tasks and
procedures are done.
• The three steps in this process are:
1. Assigning 5S (Sort, Set in Order, Shine) job responsibilities,
2. Integrating 5S duties into regular work duties, and
3. Checking on the maintenance of 5S.
• Some of the tools used in standardizing the 5S procedures are:
• Job cycle charts,
• Visual cues (e.g., signs, placards, display scoreboards),
• Scheduling of "five-minute" 5S periods, and check lists.
• The second part of Standardize is Prevention:
• Preventing accumulation of unneeded items,
• Preventing procedures from breaking down, and
• Preventing equipment and materials from getting dirty.
16. 5S pillar 5 – Sustain (Shitsuke)
• This is often the most difficult pillar to implement and achieve.
• Sustain focuses on defining a new status quo and standard of workplace organization. Without
this pillar the first 4 pillars won’t last long.
• Changing habits can be difficult, and the tendency is often to return to the status quo and the
comfort zone of the "old way" of doing things.
• Tools for sustaining 5S include:
• Signs and posters, newsletters, pocket manuals,
• Team and management check-ins, performance reviews, and
• Department tours.
• Reinforce 5S messages in multiple formats until it becomes "the way things are done."
17. 5S in a Pandemic
• Cleanliness, organization and respect for others directly mean good health.
• These are some of the main reasons why certain countries were faster than others in containing
the outbreak: They detected the problem, Exposed it and Each individual knew what they needed
to do.
• The residents of Japan were already in the habit of wearing a surgical face mask in case they have
cold or flu. This prevents spread of infection to others.
• Public spaces including streets, train stations and toilets are clean without trash. People are
encouraged to take the garbage back home.
• At school, students are supposed to clean their own classrooms as a part of school activities. On
arriving at school or getting back from work, students and workers leave their shoes in lockers or
at the entrance.
18. 5S in a Pandemic (continued)
1st S: Sort. Separate what is needed from what is not needed.
If you must stay at home, take the time to organize your pantry, fridge and freezer & define
what is needed in the short term. Store in “hard to reach” locations that which is not needed as
frequently. Do not store food that is no longer in good condition.
2nd S: Store. Arrange items for ease of use.
• Items with short due dates and need to be consumed earlier stored closer to the door or
labelled with clear due dates or red tags.
• Prioritize your items so that they are in the best possible location, considering the frequency
of use, who needs to use them or access to them and who doesn’t and where it is the safer
location to keep quality intact.
• Organize items by category, and label them if necessary.
• Measure storage space available before buying the containers to be more efficient.
3rd S: Shine. Set a new level of cleanliness
• Clean the workspace/environment thoroughly.
19. 5S in a Pandemic (continued)
4th S: Standardize: Define a System to maintain 1S, 2S and 3S.
• Make this a family activity.
• Engage everyone to help to maintain the organization.
• Define cleaning schedules, take pictures of before and after (imagine how your garage could
look like free of clutter) and define cleanliness standards (what is accepted and what is not).
• Design the Standards in such a way that everyone can easily follow the instructions.
• Standards don’t have to be big manuals.
• Pictures, checklists, and visual management tools like colors, transparent containers and tags
are simple reminders on what needs to be done.
5th S: Sustain: Define a System to maintain 1S, 2S and 3S.
• It is a team activity to continuously monitor and improve the workspace.
20. SMED (Quick Changeover)
The key implementation steps of SMED (Single Minute Exchange of Die) are:
1. Separate internal from external setup operations;
2. Convert internal to external setup;
3. Mechanization;
4. Adopt parallel operations (see image);
5. Standardize function, not shape;
6. Use functional clamps or eliminate fasteners altogether;
7. Use intermediate jigs;
8. Eliminate adjustments;
Internal setup – can only be performed when the machine is down
External setup – can be performed when the machine is running
SMED (Single-Minute Exchange of Die) is a system for reducing the time it takes to complete equipment
changeovers to the “single” digits (i.e., less than 10 minutes). SMED system converts as many changeover
steps as possible to “external”, and to simplify and streamline the remaining steps.
21. SMED (Quick Changeover)
• Changeover time = Time between production of the last good part (at full speed) and
production of the first good part (at full speed).
• If changeovers represent a significant percentage of lost productive time (e.g., at least 20%)
consider proceeding with a SMED program. Else, consider first focusing on a TPM (Total
Productive Maintenance) program.
22. SMED (Quick Changeover)
No. Task Deliverable Remarks
1 Identify Pilot Area Once the target equipment has been selected,
record a baseline time for the changeover.
Include all associated employees in
the selection process and create a
consensus within the team as to
the target equipment choice.
2 Identify Elements A complete list of changeover elements, each with
a description and time “cost”.
Retrieval, Inspection, Cleaning,
Quality are Category examples
3 Separate the
External Elements
An updated list of changeover elements, split into
three parts:
1. External Elements (Before Changeover),
2. Internal Elements (During Changeover), and
3. External Elements (After Changeover)
Can this element, as currently
performed or with minimal
change, be completed while the
equipment is running?
4 Convert Internal
Elements to
External Elements
An updated list of changeover elements, with fewer
internal elements, and additional external
elements (performed before or after the
changeover).
Advance preparation, Additional
Jigs, Equipment replacement,
modularization, or modification
5 Streamline
remaining
Elements
A set of updated work instructions for the
changeover (i.e., creating Standardized Work) and a
significantly faster changeover time!
How can this element be
completed in less time? How can
we simplify this element?
23. SMED Examples
1. Ventilator Manufacturing: E.g.: Maruti Suzuki India Ltd (MSIL) used its capabilities to enable
the start-up Agva Healthcare to scale up ventilator production.
2. Oxygen Cylinder Refilling: By analyzing the process and making small changes, companies in
India were able to reduce the time it took to refill a cylinder from 45 minutes to just 15
minutes. This allowed them to meet the increased demand for oxygen cylinders during the
pandemic and provide better care for patients.
3. Diagnostic Test Kits: By reducing the time it took to change over the production line from one
type of test kit to another, manufacturers in India were able to produce more kits and meet the
increased demand for COVID-19 testing.
4. F1 pit stops
5. Software Development
6. Plastic injection moulding
7. Auto manufacturing
24. Kaizen (Continuous Improvement)
• Kaizen is philosophy and business approach used to:
• Improve processes continuously by making small, incremental improvements to processes &
systems over time and
• Involving all employees in the improvement process.
• Kaizen aims to identify and eliminate waste, reduce variation, and improve overall efficiency.
• It also helps in improving quality, reducing costs, and enhancing employee morale. (Imai, 1986)
• Plan: Establish objectives/ KPI. Identify the problem, then work with your team to develop a
plan for improvements.
• Do: Implementation of the improvements and data collection.
• Check: Comparison between actual result and desired result. Develop a new plan to fix what
doesn’t work.
• Act: Act based on what was learned from previous steps.
Repeat
25. Problem Statement
A manufacturer located in India, needs to have some supplies delivered from another location in
India to his plant every Thursday. Early arrival is acceptable.
Currently, the supplies need 4 days to travel from Supplier to Manufacturer.
However, delays occurred from time to time, which caused delays in the deliveries. Occasionally,
freight arrived a day or more later. From 10 shipments in a month, 4 didn’t meet the delivery time,
causing a serious slow down on the whole production.
The Manufacturer asked a Logistics team for help to find ways to improve the transportation
process and meet delivery times.
The Logistics team has a very wide network of carriers that offer team drivers.
26. Solution (PDCA)
• Plan:
1> Set a goal: To deliver all shipments on Thursday.
2> Review the current state of the things:
• No fixed freight forwarding day.
• Sometimes freight arrived a day or more later.
• 4 out of 10 shipments were not arriving on time, which caused delays in the whole supply
chain.
3> Develop a plan for improvements.
• Logistics team to work with Supplier and ensure that freight departs every Monday without
fail.
• However, Travel delays sometimes are unpredictable and unavoidable. Therefore, the
solution should rely on having more options to accelerate the transportation process once
the freight has left. As the Manufacturer moves a high volume of loads, Logistics team offers
team driver services to deliver the loads that are not able to reach on time.
27. Solution (PDCA)
• Do:
• The loads that departed from Supplier on Monday were transported with a single driver.
• Freight that departed on Tuesday was transported by team drivers. Both were delivered on
time, on Thursday.
• Check:
• The improvement implemented worked successfully and all loads were delivered on time.
29. Transactional Process Improvement (TPI) Kaizen
1. Map the current state
• Do a Gemba walk and involve every stakeholder to share their perspective and role
• Count the number of steps/decision points and calculate the overall cycle time of each step.
• Identify any inefficiencies, redundancies, and bottlenecks in the processes that need improvement.
2. Identify the waste in the process
• Categorise waste into types like Transportation, Overproduction, Overprocessing, Inventory, Motion, and Waiting Time
3. Map future state
• Map future state in a simple matrix of Value Add (VA), Non-Value Add (NVA) and High/Low effort.
• Log the new number of decision points and steps in the future state and compare them to the current state to identify the
time saved through the new state.
4. Implement new process
• Create SOP’s, Process documentation, Train the Teams and manage the Change
5. Control the process and measure KPI’s
• Implement mistake proofing along with relevant key performance indicators (KPIs) to measure the results and monitor the
process.
• A scorecard helps to consolidate the metrics, make them easily accessible and visual to entire team
6. Establish the Audit process
• Standardize the audit forms and assign a dedicated owner to monitor and collate the results.
• If Audit results fall short of expectations, conduct a root cause analysis using the 5 Whys methodology and make necessary
corrections.
30. VA/NVA & Effort Matrix
Scope within current Kaizen
Value Add
0
Effort
Scope based on time needed
for another Kaizen or a
follow-up activity
Non- Value Add
Challenge & Eliminate
Eliminate from future
state
31. Jidoka – “automation with a human touch”
Jidoka is a process by which to examine errors during the process, rather than at the end.
1. Discover an abnormality or problem.
2. Stop the operation process.
3. Fix the problem at hand.
4. Discover the root cause to prevent future issues.
STOP REVIEW
CHANGE PROCESS
PROCEED
Inspecting throughout the manufacturing process can play a key role in preventing defects and
fixing problems before they cause significant damage.
32. Poka Yoke
• Yokeru (avoid)
• Poka (inadvertent errors)
Poka Yoke (Mistake Proofing) is used to prevent errors and defects in the manufacturing process.
The original term was Baka-Yoke or “fool-proof”.
• Eliminate the cause of an Error at the Source;
• Detect an Error as it is being made;
• Detect an error soon after it is made but before it reaches next operation;
Poka-yoke devices fall into two major categories: Prevention and Detection.
33. Poka Yoke and the Floppy
• A prevention device engineers the process so that it is impossible to make a mistake at all.
• Prevention devices remove the need to correct a mistake, since the user cannot make the
mistake in the first place.
Example: The 3.5-inch computer diskette (floppy disk) is carefully engineered to be slightly
asymmetrical so that it will not fit into the disk drive in any orientation other than the correct one.
Note: US restaurant chain Chuck E. Cheese still uses floppy disks to make their animatronic mouse
dance
34. Poka Yoke
A detection device signals the user when a mistake has been made, so that the user can quickly
correct the problem.
Detection devices typically warn the user of a problem, but they do not enforce the correction.
Examples:
• Microwave won’t start until door is closed;
• Washing machine won’t start until door is closed and cannot be opened until cycle completes;
• Car may not start until seat belts are fastened;
• Automatic Braking System;
• Airbags;
• Using standardized containers at workstations so that workers know exact quantities without
having to weigh or count the contents;
• Use of colour coded date labels to mark the production dates of products.
• Shutout poka yoke: Preventing the mistake from ever happening. This can be done by
eliminating a step, replacing it, or simplifying it to make correction easier.
• Attention poka yoke: Solution focuses on alerting you to errors as they happen.
35. Basic Steps to Implement Poka Yoke
Review & Chart
the process you
want to improve
•Use mapping tools like flow
charts to visualize your
processes
Identify the
steps prone to
human error
•For example: Processing, Setup, or Measurement have
high rates of manual mistakes.
Find the root
cause of the
mistake
•5 Whys root cause analysis
Decide on the
solution and
implementation
approach
•Shutout poka-yoke
• Attention poka-yoke
Implement and
test the solution
• Start small
• If it works, implement solution
company-wide
• If it fails, restart the process
36. Netflix Circuit Breaker (Poka Yoke)
• Netflix follows a software delivery pattern in which the software code is designed like a circuit
breaker.
• If one service dies, it is isolated or is bounded to only fail the things it controls and not create
cascading service outages.
• This design pattern restricts the blast radius of a software issue.
• In cloud computing, the term blast radius is used to designate the impact that a security breach of
one single component of an application could have on the overall composite application.
• Reducing the blast radius of any component is a security good practice. The blast radius concept is
used in Zero trust security model and Chaos engineering.
37. Kanban
In Kanban, there are two types of principles and six practices.
Kanban Principles
Change Management Principles Service Delivery Principles
Start With What You Do Now Focus on Customer’s Needs and Expectations
Agree to Pursue Incremental, Evolutionary
Change
Manage the Work, Not the Workers
Encourage Acts of Leadership at All Levels Regularly Review the Network of Services
Kanban Practices:
1. Visualize the workflow
2. Limit work in progress
3. Manage flow
4. Make process policies explicit
5. Implement feedback loops
6. Improve collaboratively
38. Kanban Practices
1. Visualize the workflow
• Map the workflow
• Put the workflow on the Kanban Board
2. Limit work in progress
• Juggling simultaneous work doesn’t make you more productive. It just makes you more
distracted
• Limiting WIP => shorter feedback loops within process => more flexibility to learn how
workflows through system allowing team to make ad hoc adjustments.
3. Manage flow
• Track the throughput number from week to week to see how changes made in your
Kanban system affect how much total work actually gets done.
4. Make process policies explicit yet flexible to change if required
5. Measure and Learn
• Implement feedback loops
• Improve collaboratively
39. Kanban Cadences
In Kanban, there are seven cadences.
Team Level Cadences
1. Team Kanban Meeting – daily
2. Replenishment & Commitment Meeting – daily to bi-
weekly
3. Team Retrospective – bi-weekly or monthly
Service-Oriented Cadences
1. Service Delivery Review – bi-weekly
2. Operations Review – monthly
3. Blocker Clustering – monthly
4. Strategy Review – quarterly
Some of the Kanban Cadences are focused on a single service or product team (Team Kanban
Meeting, Kanban Replenishment & Commitment) while others (Operations Reviews or Flow Review
Meetings) may bring more value when covering the work of many teams, streams, or even
departments.
40. Kanban Board – Workflow Mapping
Activity:
1. Each team member writes down the top three to five things that he or she has in process, using
one sticky note per work item. Be granular. Specifics help the whole team understand the details
of each work item.
2. Each team member picks a sticky note from their selection of current work items, sticks it to his
or her shirt and “becomes” that piece of work.
3. Make sure you’ve taken into account not only the work of your team members but also how
workflows into the team from leaders, customers and other parts of the organization.
4. Figure out where your piece of work is in your team’s process by asking the following three
questions:
• Where am I right now?
• Where did I come from?
• Where will I go next?
Prerequisites:
Whiteboard with dry-erase markers of different colours, pen/pencils and sticky notes for each
work item.
Block/Schedule a face-to-face meeting of at least 1 hour on each team member’s calendar.
Gather all team members around the whiteboard.
41. Kanban Board – Workflow Mapping
Where are you
right now?
Where did you
come from?
Where will you go
next?
In development Planning Test
The above defines three chronological steps by analyzing just one piece of work:
Planning > In Development > Test
Use each teammate’s answers to define more steps and/or validate the steps you’ve already
identified. In the end, you might produce a process like this:
Plan > Develop > Test > Deploy > Done
42. Kanban Board – Workflow Mapping
Activity:
1. Each team member writes down his or her work items at a high level on a separate sheet of
paper.
2. Post the lists and compare, looking for themes among the work.
a. Pick one person and analyze his or her list first. For each work item, ask, “What kind of work
is this?” (A development team, for example, might have these types of work: feature,
defect, user story or task.)
b. As your team members identify different types of work on the first list, they should label
their lists accordingly. This part of the exercise continues until a type of work has been
assigned to each work item on every list.
3. Designate a different color of sticky note to each type of work.
Note: The terms “card,” “sticky note” and “work item” are interchangeable.
Prerequisites:
Whiteboard with dry-erase markers of different colours, pen/pencils and sticky notes for each
work item.
Block/Schedule a face-to-face meeting of at least 1 hour on each team member’s calendar.
Gather all team members around the whiteboard.
43. Kanban Board – Workflow Mapping
Activity:
4. Each team member transfers his or her list of work items to individual sticky notes of the
appropriate color.
5. Team members post their sticky notes on the whiteboard in the lane that corresponds with the
work item’s current status.
6. Indicate who’s working on what by writing team member names on the flags/index tabs. Use
round stickers for blockers.
Note: instead of using card colour to indicate type of work, your team might prefer to use card
colour to indicate priority, source of demand or some other theme unique to your work
44. Sample Kanban Board
To Do Plan Develop Test (3/4) Deploy Done
Feature
Task
User Story
Defect
Expedite
45. Sample Kanban Card
Ticket ID #012
The week view of the new calendar
feature
6
Unique identifier
Activity name
Rough estimate of size of
work in hours or other
metric
Engineer1
Engineer2
Names of who’s
working on the card
Red sticker indicates
a blocker
46. Blockers
• A blocker typically signals an unfinished dependency, a defect or an unavailable skillset
• A blocked item can’t move to the next stage in your process because of an issue.
For example, a blocker may arise when you’ve sought information/material from an external source
and can’t complete further work until you receive a response
How to measure blockers:
• How often are items blocked?
• How long do they stay blocked?
• Where in the process do blockers happen?
In each daily standup, add “1” to the “blocked days” for that card and note where the block
occurred.
Start Date: May 08
Blocked Days: 1 2
Blocked Location: Testing
Completed Date: May 18
Lead Time: 10
47. Kanban Card
• Kanban card can be either physical or digital;
• Visual representation of a work item;
• Kanban card includes:
• Information about the task and its status;
• Summary of assignment;
• Person responsible;
• Deadline, etc.;
• Digital Kanban card has front and back side.
• The front side gives you basic information about the task, such as description, title,
assignee, cycle time, priority, and subtasks.
• The card's backside can be used for recording valuable metrics and information while it goes
through the workflow. Here, your team can leave comments, attach files and external links,
and check the card's historical data.
Example of physical Kanban card
51. Kanban Board
• Visualisation of workflow;
• Enhance productivity by limiting WiP;
• Kanban board components:
• Kanban Cards – Visual representation of tasks. Each card contains information about the task
and its status, such as deadline, assignee, description, etc.
• Kanban Columns – Each column on the board represents a different stage of your workflow.
The cards go through the workflow until their full completion.
• Work-in-Progress Limits – Restrict the maximum number of tasks in the different stages of
the workflow. Limiting WIP allows finishing work items faster by helping team focus only on
current tasks.
• Kanban Swim lanes – Horizontal lanes you can use to separate different activities, teams,
classes of service, and more.
• Commitment Point – A commitment marks a point in the work process where a work item is
ready to be pulled into the system.
• Delivery Point – The point in the workflow where work items are considered finished.
The following terms are interchangeable:
• board/whiteboard
• lane/a column on the board/a step in your process
• card/sticky note/work item
52. Kanban Board Example
Kanban boards can be used with the 5S methodology to maintain organization and efficiency and reduce waste at the
microlevel.
53. Kanban Board with 5S
Seiri (Sort):
• Get the team’s agreement on a simpler and shorter list
of board components and colours.
• Remove decorations from the board if they do not help
to manage flow.
• During long term use, remove any column, a card type,
automation, or any other element that no longer
serves the purpose for which it was created.
• Review the board frequently and ensure that team has
not forgotten why the elements were created in the
first place.
Utilise Kanban Board (physical/ digital) as a Virtual Workplace;
54. Kanban Board with 5S
Seiton (Set in Order):
• Review all the visualization settings to ensure that everything visible on the board without
additional manipulation serves to make decisions about how to manage the flow of work.
• If you display data but do not regularly use it, consider whether it might be better to use that
display space for something else.
Seiso (Shine):
• Archive cards that have status Done/ Completed/ Cancelled.
• Keep cards up to date, relative to the status of the work. Add blockers if necessary to ensure that
all cards are moved to done state only at the correct time.
• Maintain the integrity of all the data on the board.
Seikutsu (Standardise):
• If there are multiple teams with assorted boards, create a mapping of the different card names,
colours and blockers that are semantically similar .
• Ensure that information flows coherently into & out of the organisation’s boards.
Shitsuke (Sustain): Continuously monitor and improve the digital workspace
55. Optimisation of Kanban Board
• What kind of work is this? Bug? Feature? Task?
• Is it High/Medium/Low priority?
• Who requested for it? (Stakeholder management)
• How long did that card take to complete?
• How does the workflow? Or conversely: Where does the work get stuck?
• Spot any bottlenecks or other impediments to the flow of work
• What do we need to do to advance this piece of work?
• What do we need to do to complete this piece of work?
• Is anyone working on anything that’s not on the board? (Identify & Quantify all WIP)
• Is there any hidden work in process (WIP) that we haven’t gotten onto the board yet?
• What are we looking to finish, as a team?
• Look at business value, encroaching deadlines or your team’s chosen unit of value to reprioritize or reassign
work, as needed
• Are we tracking things at the right level of granularity?
• Are there queues or buffers in your workflow that aren’t represented on the board?
• A queue or buffer happens when work is in a holding pattern before it goes to the next step.
• When is a work item truly done?
• It should mean that a card will not move backwards after reaching “done.”
• If it does, add a verification, policy or definition of done to your process
• Is there a plan-for-every-part (PFEP) database? Is it integrated with ERP ?
56. Kanban Board Example
A Kanban board depicting procurement and assembly workflows for product development teams
59. Kanban Board – Limiting WIP
• Gather team around Kanban board
• Choose a card that several team members worked on while it moved through most of the
defined workflow on your board
• Ask: “How long did that card take to complete (reach “Done” lane)?” Or “What was the card’s
Cycle Time?”
• Ask each person who worked on the card how much time they spent actively working on it.
• Identify process time and delay time for each card’s cycle time.
• As a team, identify all the queues in your process. (Any place a handoff occurs is most likely a
hidden queue.) Now identify the largest queues
• Add a WIP limit to your board to try to reduce the size of one or more of the largest queues. You
may add the WIP limit to the lane that has the queue, or you may find that adding a WIP limit to
the lane before or after the queue reduces WIP better
• If certain team member is consistently responsible for too many work items, experiment with
personal WIP limits. E.g.: “TeamMember1 can only be assigned 4 work items at one time.”
60. Set up WiP Limits
• Conduct review of Service Delivery KPI’s, processes, and shortfalls (if any):
• Optimise the business processes to improve efficiency and productivity;
• Monitor & Govern the processes and make adjustments as required;
• Prevent accumulation of unfinished work. This can lead to overloading existing processes;
61. Set up WiP Limits
Identify Process Blockers / Roadblocks / Bottlenecks that prevent team members from regular context
switching between tasks.
62. Set up WiP Limits
• Prevent Multitasking;
• Deliver Value faster: Improve service delivery rate (throughput), so that team can continuously meet
or exceed customer expectations;
• Carefully monitor the KPIs when you increase or decrease your limits.
• If WiP limits are too high, the outcome will be unproductive and inefficient;
When team member hits a WIP limit, they should stop doing the kind of work that adds to that
queue.
• Instead, let the work continue to flow through the system.
• Help a teammate or work on a task that doesn’t add WIP on the board. Run some errands.
• But whatever they do, don’t pile on more WIP at this point.
65. BACKLOG ACTIVE
DEVELOPMENT TESTING
DEPLOYMENT COMPLETE
ACTIVE COMPLETE ACTIVE COMPLETE
100002
100001 100003 100004 100005 100006 100007 100008
100010
100009 100011 100012 100013 100014
100015 100016
TEAM
MEMBERS FL AL AK AR CO NM CA NY KA OH PA TX
FL AL AK AR
CO
NM CA
NY
KA
OH
PA
TX
FL AL AK AR
CO
NM
CA
NY
KA OH PA TX
Kanban Board
66. Andon (Paper Lantern)
Put a good person in a bad system, and the system will win every time (W. Edwards Deming)
• Andon system is a product of Jidoka & provides visual feedback to the plant floor.
• Alert workers and supervisors of abnormalities in the production process.
• Stopping work in the moment will save the organization from major and costly issues in the future.
Amazon Andon Cord:
1. Amazon customer service representative receives a call from a customer with a problem involving the
product they received from Amazon.
2. If it is a recurring issue, the customer service representative can pull the cord when they suspect a
problem with their inventory or to pause production.
3. Amazon then removes the product from the website until it fixes the issues. This stops all sales and
shipments before the issue spreads to more customers.
4. Amazon has installed automatic mechanisms to restart production / 3rd party shipments, as soon as it
resolves the defects.
5. Sophisticated processes at Amazon enable identification, tracking and correction of such errors.
Netflix Andon Cord: Netflix Chaos Monkey (Obsession with Failures)
https://netflixtechblog.com/netflix-chaos-monkey-upgraded-1d679429be5d
67. Andon (Paper Lantern)
Short-Term benefits:
• Visibility and transparency in the production process
• Increased productivity and efficiency
• Decreased waste
Long term benefits:
• Reduced costs and downtime
• Enhanced value to the customer because of better quality products
• Responsible operators who are accountable for the line running as efficiently and effectively as possible,
empowering them to act when problems arise, rather than waiting for management
• Long term improvements to production process
Note: The “Andon cord” itself doesn’t add value. Likewise, if action isn’t taken immediately when the
system is alerted, it defeats the purpose and can detract from the value you are targeting.
69. 5 Why’s
1. Form a team. Appoint a facilitator;
2. Define the problem;
3. Ask why did it happen;
4. The facilitator should ask “Why” as many times as needed until the team can identify the root cause
of the initial problem;
5. Don’t ask too many Why’s. Stay focused on context of problem.
6. Sometimes a problem may have more than one root cause. This may even help you detect and
eliminate organizational issues that have permanent negative effects on the overall performance.
70. Card Based Systems
Various card-based systems are used in Lean methodology to facilitate communication and control of the
production process. These card-based systems include:
• Kanban,
• Andon,
• Heijunka,
• Paired-cell Overlapping Loops of Cards with Authorization (POLCA),
• Constant Work In Progress (CONWIP), and
• Drum-Buffer-Rope (DBR).
All these systems aim to reduce waste, improve efficiency, and increase productivity.
In Lean Manufacturing, the three most commonly used card-based systems are: Kanban, Andon, Heijunka.
While they each have a different focus, they work together to help reduce waste, increase efficiency, and
improve quality in the manufacturing process.
All three card-based systems are designed to improve visibility, control, and coordination of production and
inventory management in lean manufacturing.
71. Card Based Systems
Title Kanban Andon Heijunka
Focus Material Flow Problem solving Levelling production
Purpose Manage inventory and
production.
Indicate the status of a production
line or process.
Balance production and ensure that
production is spread out evenly over
time.
Usage • A visual signal (the Kanban
card) indicates when
materials or components
are needed in the
production process.
• Pull-based system.
Production is initiated only
when there is demand
from customer.
• When a signal is received,
materials are then
replenished or delivered
to the production line.
• A visual &/or audio signal (the
Andon card) that alerts the
production team when there is
a problem or issue that needs
to be addressed.
• A scheduling card or board
indicates what products should be
produced, how many should be
produced, and when they should
be produced
72. Benefits of Card Based Systems
Kanban Andon Heijunka
• Reduce waste,
• Optimize inventory levels,
• Improve the flow of
materials and information,
and
• Improve the efficiency of
the production process by
ensuring that materials
are available where and
when they are needed.
• Visual management tool that
helps to improve
communication, teamwork,
and problem-solving
capabilities,
• Reduce downtime,
• Prevent defects, and
• Improve the overall quality of
the production process.
• Reduce waste,
• Reduce downtime,
• Improve customer satisfaction,
• Increase flexibility in responding to
changes in demand.
73. Heijunka
Factors allowing Buffer against Demand:
• Inventory and
• Production Lead-Time or Response time to the customer
Inventory :
• Hold finished goods inventory, ship to customer order, and
replenish the inventory while building to a level schedule, or
• Hold semi-finished inventory and make or customize to customer
order. This is useful for standard base product that can be easily
customized with a particular software or packaging or accessories
74. Heijunka
Lead-Time :
• Build on a level schedule by adding customer orders to the schedule each day.
• The “backlog” of orders would change daily, but the build-rate per day would remain
the same.
Product Unit Volume Product Category Production schedule Volume
Top 60% A Daily Small batches
Next 20% B Either daily or weekly Small batches
Bottom 20% C Weekly or Monthly Small batches
75. Heijunka Visual Management Tools
Plan Vs Actual Board Scheduling Board FIFO Lane
• The plan is to build 210 units
per day, 30 per hour.
• When plan does not meet
actual, we can adjust the plan
to add overtime or resources.
• Facilitate leveling product volume and mix.
• Dictate the sequence and timing of
product.
• Each blue “card” or magnet represents a
work order or build quantity.
• Length of the card corresponds to the time
it should take to build these units using
standardized work.
• A card is pulled when the next job is ready
to start. By looking at this board we can
observe whether or not our process
running on-time and whether or not we
need to add resources or work overtime.
• This is another example of utilizing the
concept of management time frame.
1. As Each Order arrives, place it in the time
window in which it arrives;
2. Enter orders in the order in which they
arrive (earliest order first);
3. Each hr check that all orders that have
arrived are entered within 2 hours of
their arrival. If not, take action to
redistribute work;
76. Recent Examples of Heijunka
• In 2019, Toyota Motor Corporation reduced lead times in their Takaoka plant in Japan. The CAPEX of Takaoka II was
half of Takaoka I.
• In 2020, Kawasaki's reduced lead times in their Akashi plant for its hydraulic pumps.
• In 2021, Boeing’s implemented Heijunka in their 737 MAX production facility in Renton, Washington.
• “PTQ” (Put Together Quickly)
77. Lean Thinking
The Lean Thinking thought process follows these 5 steps:
1. Specify value from the standpoint of the end customer;
2. Identify all the steps in the value stream;
3. Make the value creating steps flow towards the customer;
4. Let customers pull value (towards them) from the next upstream activity;
5. Pursue perfection;
78. Lean in Non-Automotive Supply Chains
Industry Examples
Lean Banking - “Chuck the Check”
• Faster check processing and lower capacity utilization, thus providing additional capacity to provide check
processing capacity for other banks.
• Capacity-related congestion converted to revenue opportunity
Healthcare/Hospitals – “Need for Speed”
• Reduce time required to transport patient undergoing surgery from general ward to operating room,
• Streamlined facility with smoothed flow,
• Reduced variability for surgery times, and
• Quick turnaround of bottleneck operating room resources.
Retail stores (7-Eleven, Japan) – “Just In Time”
• Just-in-time (JIT) inventory system to minimize waste and maximize efficiency.
• Collaborative relationships with suppliers
• Efficient transportation system
• Data-driven decision making
• Continuous improvement: 7 Eleven encourages its employees and suppliers to identify and eliminate waste
throughout the supply chain
• 7-Eleven beat Amazon when it came to who delivered orders first to its customers via drones
79. • The color of the twist tie on a bag of bread shows
how fresh the product is.
• Each colour indicates which day of the week
bread was baked on.
• The colors are in alphabetical order by day of the
week.
• The color coding makes it easier for employees to
remove stale loaves from the shelves.
Similarly, Coloured circles on food packages help
printers to colour match when they’re printing food
packaging and retain brand consistency all over the
world.
This way the different batches are easily identifiable
for the purpose of product rotation. The system is
especially useful in the food industry where rotation
of batches is very important because of hygiene
considerations.
80. References
• Rother, M., & Shook, J. (1998). Learning to see: value stream mapping to add value and eliminate muda. Lean Enterprise Institute.
• Osada, T. (1991). The 5S's: Five keys to a total quality environment. Asian productivity organization.
• Shingo, S. (1985). A revolution in manufacturing: the SMED system. Productivity Press.
• Shingo, S. (1985). A study of the Toyota production system: from an industrial engineering viewpoint. Productivity Press.
• Monden, Y. (1993). Toyota Production System: An Integrated Approach to Just-In-Time. Industrial Engineering and Management
Press.
• Womack, J. P., Jones, D. T., & Roos, D. (1990). The machine that changed the world: The story of lean production. Simon and
Schuster.
• Imai, M. (1986). Kaizen
• Nakajima, S. (1988). Introduction to TPM: Total Productive Maintenance. Cambridge, MA: Productivity Press.
• Hirano, H. (1995). 5 Pillars of the Visual Workplace: The Sourcebook for 5S Implementation. Productivity Press.
• Chiarini, A. (2011). Lean organization: from the tools of the Toyota production system to Lean Office. Journal of Manufacturing
• Kontio, J., Saarinen, L., Paronen, J., & Heiskanen, E. (2021). Single Minute Exchange of Die (SMED) in the COVID-19 era.
81. References
• Chalice R. Improving healthcare using Toyota lean production methods: 46 steps for improvement. Milwaukee, WI: ASQ
Quality Press; 2007.
• Marin, Iuliana & Monica, Marin & Nicolae, Carmen & Dinita, Georgeta & Ioan, Custura & Tudorache, Minodora. (2020).
FARM SUPPLY CHAIN MANAGEMENT IMPROVEMENT THROUGH THE USE OF LEAN, AGILE AND DEVOPS METHODOLOGIES.
Scientific Papers of the Research Institute for Fruit Growing. 63.
• https://produceprocessing.net/article/building-bonduelle/
• https://produceprocessing.net/news/bonduelle-to-merge-2-u-s-manufacturing-plants/
• https://www.lean.org/the-lean-post/articles/understanding-the-fundamentals-of-value-stream-mapping/
• Lin, Chien-Chung & Chueh, Jui-Wen & Chen, Hung-Ming & Chiu, Yao-Hui & Chu, Dachen. (2022). Frontiers in Medicine. 9.
1054583. 10.3389/fmed.2022.1054583
https://www.researchgate.net/publication/366106873_Applying_the_Toyota_production_system_to_decrease_the_time
_required_to_transport_patients_undergoing_surgery_from_the_general_ward_to_the_operating_room_and_reviewing
_the_essence_of_lean_thinking
• https://www.mckinsey.com/industries/financial-services/our-insights/first-national-toyota
• https://www.mckinsey.com/industries/healthcare/our-insights/hospitals-get-serious-about-operations
The history of Kaizen begins in the 1930s in Japan, more specifically with Sakichi Toyoda, founder of Toyota.
Logistics team followed a Kaizen approach in which both teams, manufacturer and freight forwarder (Logistics team) worked together to make small but significant improvements.
Note: In India there is usually Driver +Cleaner, but single driver => Cleaner cannot drive.