Download as PDF, PPTX


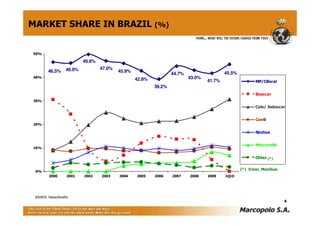
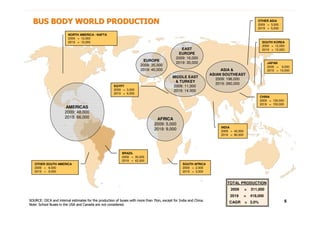


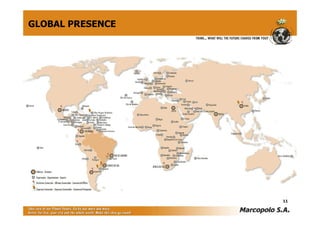


The document provides an agenda and overview for Marcopolo Day, which discusses Marcopolo as a leading bus manufacturer. It summarizes key information about the bus market and Marcopolo's position in it, including operating and financial highlights showing increased production, market share, sales, and profitability in recent years. Charts depict trends in areas like the Brazilian bus fleet size and average age.


