Download as PDF, PPTX


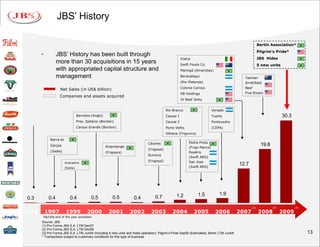


JBS S.A. is a global meat processing company headquartered in Brazil. It has the following key aspects of its business strategy: 1) Building a global production and distribution platform through acquisitions to access raw material supply and markets globally. 2) Integrating sales and distribution to efficiently serve local and external markets around the world. 3) Increasing value-added processed meat products and global brands to improve margins. The document provides an overview of JBS' history of acquisitions, production and sales platforms around the world, and strategies around sustainability and corporate governance.


