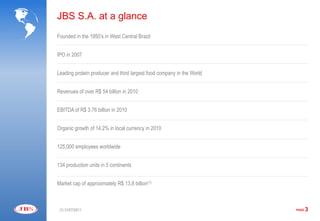
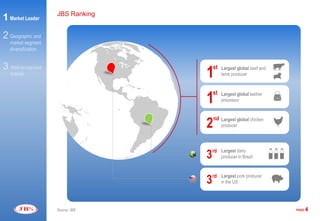
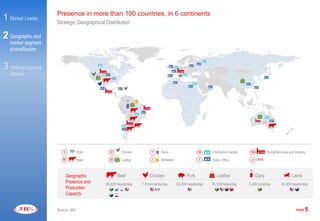
3. JBS S.A. at a glance
Founded in the 1950’s in West Central Brazil
IPO in 2007
Leading protein producer and third largest food company in the World
Revenues of over R$ 54 billion in 2010
EBITDA of R$ 3.76 billion in 2010
Organic growth of 14.2% in local currency in 2010
125,000 employees worldwide
134 production units in 5 continents
Market cap of approximately R$ 13.8 billion(1)
(1) 31/07/2011 PAGE 3
4. JBS Ranking
1 Market Leader
2 Geographic and
market segment
diversification
3 Well-recognized
1
st Largest global beef and
brands lamb producer
1
st Largest global leather
processor
2
nd Largest global chicken
producer
3rd Largest dairy
producer in Brazil
3 rd Largest pork producer
in the US
Source: JBS PAGE 4
5. Presence in more than 100 countries, in 6 continents
1 Market Leader Strategic Geographical Distribution
2 Geographic and
market segment
diversification
3 Well-recognized
brands
3 Pork 37 Chicken 7 Dairy 58 Distribution Center 134 Slaughterhouse and Industry
60 Beef 20 Leather 1 Biodiesel 7 Sales Office u Units
Geographic Beef Chicken Pork Leather Dairy Lamb
Presence and 85,825 heads/day 7.9 mm birds/day 50,000 heads/day 76,100 hides/day 5,400 tons/day 24,000 heads/day
Production
Capacity
Source: JBS PAGE 5
6. Well-recognized Brands, symbols of quality
1 Market Leader
2 Geographic and
market segment
diversification
Brazil
3 Well-recognized
brands
Argentina
EUA
Australia
PAGE 6
7. Brazil, Australia and the US continue to lead global beef exports
Brazil, Australia and US represent, respectively, 27%, 18% and 11% of global beef trade
Brazilian Beef Exports (tons)
1.400.000 5.500
5.000
1.200.000
+31.6% 4.500
1.000.000 4.000
3.500
800.000 3.000
600.000 2.500
-16.4% 2.000
400.000 1.500
1.000
200.000
500
0 0
2005 2006 2007 2008 2009 2010 1H10 1H11
Australian Beef Exports (tons) US Beef and Veal Exports (tons)
1.400.000 5.500 1.400.000 5.500
5.000 5.000
1.200.000 +13.0%
1.200.000 +4.3%
4.500
4.500
1.000.000 4.000 1.000.000 4.000
3.500 3.500
800.000 800.000 3.000
3.000
600.000 2.500 600.000 2.500
+3.5% 2.000 +25.8% 2.000
400.000 1.500 400.000 1.500
1.000 1.000
200.000 200.000
500 500
0 0 0 0
2005 2006 2007 2008 2009 2010 1H10 1H11 2005 2006 2007 2008 2009 2010 1H10 1H11
Beef Exports Average Price (US$/Ton)
Source: USDA, MLA and Secex PAGE 7
8. Chicken Exports Brazil vs US
Brazil and US represent, respectively, 39% and 34% of global chicken trade
Brazilian Chicken Exports (tons) US Chicken Exports (tons)
4.500.000 2.000 4.500.000 1.800
4.000.000 1.800 4.000.000 1.600
+21.4%
3.500.000 1.600 3.500.000 1.400
1.400
3.000.000 3.000.000 1.200
1.200 +10.2%
2.500.000 2.500.000 1.000
1.000
2.000.000 2.000.000 800
+6.4% 800
1.500.000 1.500.000 -1.7% 600
600
1.000.000 400 1.000.000 400
500.000 200 500.000 200
0 0 0 0
2005 2006 2007 2008 2009 2010 1H10 1H11 2005 2006 2007 2008 2009 2010 1H10 1H11
Chicken Exports Average Price (US$/Ton)
Source: USDA and Secex PAGE 8
9. Pork Exports US vs Brazil
US and Brazil represent, respectively, 32% and 11% of global pork trade
Brazilian Pork Exports (tons) US Pork Exports (tons)
3.000 3.000
1.400.000 1.400.000 +7.2%
+12.0%
2.500 2.500
1.200.000 1.200.000
1.000.000 2.000 1.000.000 2.000
800.000 800.000
1.500 1.500
+14.5%
600.000 600.000
1.000 1.000
400.000 400.000
-1.8% 500 500
200.000 200.000
0 0 0 0
2005 2006 2007 2008 2009 2010 1H10 1H11 2005 2006 2007 2008 2009 2010 1H10 1S11
Pork Exports Average Price (US$/Ton)
Source: USDA and Secex PAGE 9
11. 2Q11 Highlights
Net revenue in 2Q11 was R$14,621.8 million, 3.6% higher than 2Q10.
The Company ended the quarter with R$5.0 billion in cash more than a 100% of the short-term debt.
The Company raised US$2.0 billion in long-term debt.
JBS concluded the capitalization of the debentures in shares of JBS S.A. at R$7.04.
All the business units of JBS presented significant organic growth y-o-y.
The main operating highlights were:
JBS Mercosul presented EBITDA of JBS USA Pork presented EBITDA of
R$427.9 million, with a EBITDA margin of US$83.6 million, 71.7% greater than
11.8% 2Q10, with EBITDA margin of 9.9%.
PAGE 11
15. Revenue and EBITDA Distribution by Business Unit
Revenue
21.5% 25.4%
2Q11
9.6%
43.5%
EBITDA
-12.6%
73.4%
26.5%
2Q11
12.7%
Source: JBS PAGE 15
16. Organic Growth
Each business unit presented double digit organic growth in their local currency, for the period.
JBS USA Beef – Net Revenue (US$ million) JBS USA Chicken – Net Revenue (US$ million)
4.000 2.100
3.800
2.000
3.600
3.400 1.900
3.200 1.800
3.000
1.700
2.800
2.600 1.600
1Q09 2Q09 3Q09 4Q09 1Q10 2Q10 3Q10 4Q10 1Q11 2Q11 1Q10 2Q10 3Q10 4Q10 1Q11 2Q11
JBS USA Pork – Net Revenue (US$ million) JBS Mercosul – Net Revenue (R$ million)
850
3.600
800 3.500
750 3.400
700 3.300
3.200
650
3.100
600
3.000
550 2.900
500 2.800
1Q09 2Q09 3Q09 4Q09 1Q10 2Q10 3Q10 4Q10 1Q11 2Q11 1Q10 2Q10 3Q10 4Q10 1Q11 2Q11
Source: USDA PAGE 16
17. JBS Consolidated Exports Distribution
Others 16.0% Japan 13.7%
2Q11
Vietnam1.2%
Africa and Middle East 13.6%
Taiwan 2.7%
China 4.1%
US$ 2,363.6 million
Canada 4.8% Mexico 13.0%
Hong Kong 6.8%
E.U. 6.9%
Russia 9.5%
South Korea 7.7%
Others 14.0% Africa and Middle East 15.9%
1Q11 Philippines 1.3%
Mexico 14.4%
Taiwan 2.5%
China 4.0%
US$ 2,450.3 million
Canada 4.4% Japan 13.1%
E.U. 5.2%
Hong Kong 6.8%
Russia 8.4% South Korea 10.1%
Source: JBS PAGE 17
18. Debt Profile
Net debt to EBITDA, excluding Pilgrim’s Pride Corp. (PPC)*, went from 2.9x in 1Q11 to 3.2x in 2Q11
Net debt to EBITDA, including Pilgrim’s Pride Corp. (PPC)*, went from 3.1x in 1Q11 to 3.6x in 2Q11
The Company ended the quarter with R$5.0 billion in cash or cash equivalents, more than a 100% of the Company’s short-term debt
Leverage ST / LT Profile
2Q11 27% 73%
1500
3.6x
1300
3,1
1100
3 2,9 3 3 1Q11 30% 70%
900
4Q10 33% 67%
700 2
500 3Q10 33% 67%
300 1
100
2Q10 36% 64%
-100 2Q10 3Q10 4Q10 1Q11 2Q11 0
. Leverage EBITDA Short Term Long Term
Source: JBS PAGE 18
* non-recourse subsidiary controlled by JBS
19. Stock Market
In 2007, JBS was the first Company in the beef industry to trade its
shares on the stock market
21. $ Sell-side analyst recommendation
Institution Analyst Recommendation Target Price (R$)
Banco do Brasil Mariana Peringer Hold 10.20
Bradesco Ricardo Boiati / Alan Cardoso Market Perform 8.80
BTG Pactual Fábio Monteiro / Thiago Duarte Buy 9.30
Citi Carlos Albano Hold 7.40
Goldman Sachs Gustavo Wigman / Claudio Lensing Neutral 7.30
HSBC Pedro Herrera / Diego Maia Neutral 6.40
Merrill Lynch BofA Fernando Ferreira / Isabella Simonato Neutral 6.50
Santander Luis Miranda Hold 7.00
Safra Erick Guedes / Fernando Labes Outperform 10.35
UBS Gustavo Oliveira / Flavio Barcala Neutral 7.40
Source: Bloomberg and JBS PAGE 21
22. Mission
“To be best in what we set out to do, totally focused on
our business, ensuring the best products and services
for our customers, solidity for our suppliers,
satisfactory profitability for our shareholders and the
”
certainty of a better future to all our employees.