The document contains sales data for various countries in the first and second quarters of 2011. It shows that sales increased 24% in Latin American countries, 31% in Canada and the US, and 21% across European countries from the first to the second quarter.
The document shows sales figures for various countries in the first and second quarters of 2011. Sales increased across most countries, with sales in Latin American countries increasing 24% on average, Canada and the US increasing 31% on average, and European countries increasing 21% on average. The largest sales increases were seen in Austria, Belgium, Ireland, Italy, Norway, Poland, Sweden, and Switzerland.
- The document shows sales figures for various countries in the first and second quarters of 2011.
- Sales in Latin American countries like Argentina, Brazil, Mexico and Venezuela increased by an average of 24% quarter-over-quarter.
- Sales increased 31% in Canada and the United States between the two quarters.
- Sales grew 21% on average across European countries between the first and second quarters.
The document contains sales data for Victoria's Secret and Carolina Herrera brands globally for two quarters. Victoria's Secret had higher global sales than Carolina Herrera, with $18,056 for the US in the second quarter. Sales increased from the first to second quarter for both brands in most countries listed.
The document contains sales data for various products across multiple countries and time periods. It includes tables with product units in inventory, employee earnings by month, country sales by quarter, and charts showing country sales amounts. The data provides insights into inventory levels, compensation changes over time, and international sales performance across two quarters.
The document contains sales data by country for the first quarter of 2011. Sales ranged from $163.70 for Poland to $13,783.33 for the United States. The data is presented in a bar graph comparing sales amounts between the first and second quarters of 2011, with most countries showing an increase in the second quarter.
The document contains sales data by country for the first quarter of 2011. Sales ranged from $163.70 for Poland to $13,783.33 for the United States. The majority of countries had higher sales in the second quarter of 2011 compared to the first quarter.
Este documento describe el proceso de digestión y absorción de los alimentos en el aparato digestivo humano. Explica que la función del sistema digestivo es transformar los alimentos complejos en sustancias simples que el cuerpo puede utilizar fácilmente. Describe el trayecto de los alimentos desde la boca hasta el ano, pasando por la boca, esófago, estómago e intestinos, donde se descomponen químicamente y se reducen de tamaño para poder ser absorbidos en la sangre. Finalmente, define la ingestión como la introducción de alimentos
El documento habla sobre el calentamiento global, sus proyecciones a futuro y sus consecuencias, como la pérdida de biodiversidad. Recomienda que las instituciones gubernamentales concienticen a la población sobre su responsabilidad para mitigarlo, ya que de no hacerlo los esfuerzos aislados no serán suficientes. También propone nueve consejos sencillos para que las personas reduzcan su huella de carbono, como cambiar a bombillas LED, usar menos el auto, reciclar y ajustar el termostato.
La veterinaria Victoria ofrece servicios como vacunación, baños, venta de alimentos, corte de pelo y pastillas parasitarias. Los precios incluyen vacuna de la rabia por $35, pastillas parasitarias por $30, alimentos para gato por $30, alimentos para perro por $35, baños por $40 y corte de pelo por $35.
Google es una compañía tecnológica estadounidense que ofrece una variedad de servicios en línea, incluidos un motor de búsqueda, plataformas de redes sociales y servicios de alojamiento en la nube.
A poluição do ar, da água e do solo está prejudicando o meio ambiente e pode levar a consequências negativas se não for combatida. Manter os recursos naturais limpos e saudáveis é essencial para a sobrevivência de todos.
O documento discute como as pessoas valorizam coisas efêmeras e fúteis em vez de coisas com valor real e duradouro. Também critica a mídia por dar mais atenção a violência e celebridades vazias em vez de cientistas e filantropos que melhoram o mundo. Finalmente, encoraja as pessoas a refletirem sobre os valores que transmitem às próximas gerações.
O documento é um texto em homenagem ao Dia Internacional da Mulher que celebra a mulher que sonha, realiza projetos e conquistas, expressando sua luz interior e importância no mundo. É assinado por Luzia Gabriele em 8 de março de 2010.
- The document shows sales figures for various countries in the first and second quarters of 2011.
- Sales in Latin American countries like Argentina, Brazil, Mexico and Venezuela increased by an average of 24% quarter-over-quarter.
- Sales increased 31% in Canada and the United States between the two quarters.
- Sales grew 21% on average across European countries between the first and second quarters.
The third document compares sales figures between the first and second quarters of 2011 across different countries. Sales increased the most in Austria (over 100% increase) and Belgium (over 650% increase
The document contains sales data for two quarters in 2011 broken down by country. It shows that sales in Latin American countries increased 24% between the two quarters, while sales increased 31% in Canada and the US. Sales increased 21% across European countries between the two periods.
The document contains data on inventory levels of various product categories at a company. Pescado/Marisco (Fish/Seafood) has the highest inventory at 701 units, representing 22% of total inventory. Bebidas (Beverages) has the second highest at 559 units or 18% of total. The categories with the lowest inventories are Frutas/Verduras (Fruits/Vegetables) at 100 units and 3% and Carnes (Meats) at 165 units and 5%.
The document contains sales data for various countries in the first and second quarters of 2011. Sales increased across most regions, with Latin American countries seeing a 24% rise, Canada and the US up 31%, and European nations growing 21%. Germany had a significant decrease in sales compared to other European markets.
The document shows inventory levels of various product categories. Beverages have the highest inventory at 559 units, while fruits/vegetables have the lowest at 100 units. Seafood/shellfish and dairy have the second and third highest inventories. The pie chart shows that seafood/shellfish make up 23% of total inventory, while beverages account for 18% and dairy 13%.
The document contains sales data by country for the first quarter of 2011. Sales ranged from $163.70 for Poland to $13,783.33 for the United States. The data is presented in a bar graph comparing sales amounts between the first and second quarters of 2011, with most countries showing an increase in the second quarter.
The document contains sales data by country for the first quarter of 2011. Sales ranged from $163.70 for Poland to $13,783.33 for the United States. The majority of countries had higher sales in the second quarter of 2011 compared to the first quarter.
The document contains sales data by country for the first quarter of 2011. Sales ranged from $163.70 for Poland to $13,783.33 for the United States. The data is presented in a bar graph comparing sales amounts between the first and second quarters of 2011, with most countries showing an increase in the second quarter.
The document is a pie chart showing the inventory levels of different product categories at a company. It shows that Pescado/Marisco (Fish/Seafood) has the highest inventory level at 701 units, followed by Repostería (Bakery) at 386 units, and Lácteos (Dairy) at 393 units. The categories with the lowest inventory levels are Frutas/Verduras (Fruits/Vegetables) at 100 units and Carnes (Meats) at 165 units.
I Am Playr grew from 0 to 3 million global players in 6 months. Key metrics include 48 minutes per user per day, 1.1 million monthly active users with 130k daily active users playing 65,000 matches per day. The core audience is 16-34 year old males, with 30-34 year old UK males spending the most time. Lessons learned include focusing on science over art, metrics, virality, social/organic growth, advertising, and localization.
Similar to Se gwwwwwwwww unda actividad excel1 (18)
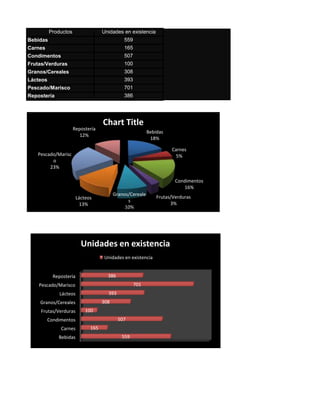
El documento proporciona información sobre los clientes, contactos y productos de una compañía. Detalla el número de clientes por país, los cargos de los contactos y las existencias de productos por categoría. En total hay 91 clientes generales de diferentes países y cargos. Los productos se dividen en 12 categorías como bebidas, carnes, etc. Se especifica la cantidad en existencia y pedida de cada producto.
La factura enumera varios artículos vendidos a Ganaderos Productores de Leche Pura S.A. de C.V., incluyendo alternadores, computadoras, acumuladores, solenoides de presión y bujes. El subtotal de la factura es de $31,000 pesos y con un IVA del 16% el total adeudado es de $35,960 pesos.
El documento compara las especificaciones y características de cuatro tablets populares: el iPad 2, el Motorola Xoom, el Samsung Galaxy Tab y el HP Touchpad. Todos tienen pantallas de alrededor de 10 pulgadas, procesadores de doble núcleo, cámaras y capacidades de almacenamiento similares. Se diferencian principalmente por su sistema operativo, siendo el iPad el único con iOS y los demás con variantes de Android o webOS.
Garden's envió cartas idénticas a varios clientes en diferentes países agradeciendo su elección. Informa que la información adjunta les ayudará a sacar el máximo provecho de los servicios. Proporciona detalles de contacto de los directores de contabilidad y los números de cliente para cada uno. Indica que evalúen nuevas necesidades para ofrecer servicios que ayuden a alcanzar nuevos objetivos.
B2B payments are rapidly changing. Find out the 5 key questions you need to be asking yourself to be sure you are mastering B2B payments today. Learn more at www.BlueSnap.com.
How to Implement a Real Estate CRM SoftwareSalesTown
To implement a CRM for real estate, set clear goals, choose a CRM with key real estate features, and customize it to your needs. Migrate your data, train your team, and use automation to save time. Monitor performance, ensure data security, and use the CRM to enhance marketing. Regularly check its effectiveness to improve your business.
Unveiling the Dynamic Personalities, Key Dates, and Horoscope Insights: Gemin...my Pandit
Explore the fascinating world of the Gemini Zodiac Sign. Discover the unique personality traits, key dates, and horoscope insights of Gemini individuals. Learn how their sociable, communicative nature and boundless curiosity make them the dynamic explorers of the zodiac. Dive into the duality of the Gemini sign and understand their intellectual and adventurous spirit.
Company Valuation webinar series - Tuesday, 4 June 2024FelixPerez547899
This session provided an update as to the latest valuation data in the UK and then delved into a discussion on the upcoming election and the impacts on valuation. We finished, as always with a Q&A
The Genesis of BriansClub.cm Famous Dark WEb PlatformSabaaSudozai
BriansClub.cm, a famous platform on the dark web, has become one of the most infamous carding marketplaces, specializing in the sale of stolen credit card data.
HOW TO START UP A COMPANY A STEP-BY-STEP GUIDE.pdf46adnanshahzad
How to Start Up a Company: A Step-by-Step Guide Starting a company is an exciting adventure that combines creativity, strategy, and hard work. It can seem overwhelming at first, but with the right guidance, anyone can transform a great idea into a successful business. Let's dive into how to start up a company, from the initial spark of an idea to securing funding and launching your startup.
Introduction
Have you ever dreamed of turning your innovative idea into a thriving business? Starting a company involves numerous steps and decisions, but don't worry—we're here to help. Whether you're exploring how to start a startup company or wondering how to start up a small business, this guide will walk you through the process, step by step.
❼❷⓿❺❻❷❽❷❼❽ Dpboss Matka Result Satta Matka Guessing Satta Fix jodi Kalyan Final ank Satta Matka Dpbos Final ank Satta Matta Matka 143 Kalyan Matka Guessing Final Matka Final ank Today Matka 420 Satta Batta Satta 143 Kalyan Chart Main Bazar Chart vip Matka Guessing Dpboss 143 Guessing Kalyan night
Navigating the world of forex trading can be challenging, especially for beginners. To help you make an informed decision, we have comprehensively compared the best forex brokers in India for 2024. This article, reviewed by Top Forex Brokers Review, will cover featured award winners, the best forex brokers, featured offers, the best copy trading platforms, the best forex brokers for beginners, the best MetaTrader brokers, and recently updated reviews. We will focus on FP Markets, Black Bull, EightCap, IC Markets, and Octa.
The APCO Geopolitical Radar - Q3 2024 The Global Operating Environment for Bu...APCO
The Radar reflects input from APCO’s teams located around the world. It distils a host of interconnected events and trends into insights to inform operational and strategic decisions. Issues covered in this edition include:
Digital Marketing with a Focus on Sustainabilitysssourabhsharma
Digital Marketing best practices including influencer marketing, content creators, and omnichannel marketing for Sustainable Brands at the Sustainable Cosmetics Summit 2024 in New York
Part 2 Deep Dive: Navigating the 2024 Slowdownjeffkluth1
Introduction
The global retail industry has weathered numerous storms, with the financial crisis of 2008 serving as a poignant reminder of the sector's resilience and adaptability. However, as we navigate the complex landscape of 2024, retailers face a unique set of challenges that demand innovative strategies and a fundamental shift in mindset. This white paper contrasts the impact of the 2008 recession on the retail sector with the current headwinds retailers are grappling with, while offering a comprehensive roadmap for success in this new paradigm.
Top mailing list providers in the USA.pptxJeremyPeirce1
Discover the top mailing list providers in the USA, offering targeted lists, segmentation, and analytics to optimize your marketing campaigns and drive engagement.
2. PAIS CLIENTES
ALEMANIA 11
ARGENTINA 3
AUSTRIA 2
BELGICA 2
BRASIL 9
CANADA 3
DINAMARCA 2
ESPAÑA 5
ESTADOS UNIDOS 13
FINLANDIA 2
FRANCIA 11
IRLANDA 1
ITALIA 3
MEXICO 5
NORUEGA 1
POLONIA 1
PORTUGAL 2
REINO UNIDO 7
SUECIA 2
SUIZA 2
VENEZUELA 4
4. PAIS CLIENTES
ALEMANIA 11
ARGENTINA 3
AUSTRIA 2
BELGICA 2
BRASIL 9
CANADA 3
DINAMARCA 2
ESPAÑA 5
ESTADOS UNIDOS 13
FINLANDIA 2
FRANCIA 11
IRLANDA 1
ITALIA 3
MEXICO 5
NORUEGA 1
POLONIA 1
PORTUGAL 2
REINO UNIDO 7
SUECIA 2
SUIZA 2
VENEZUELA 4
5. CLIENTES
REINO UNIDO
SUECIA SUIZA VENEZUELA ARGENTINA
8% 2% 4%
2% 3%
PORTUGAL AUSTRIA
ALEMANIA
2% 2%
12%
POLONIA
NORUEGA1% BELGICA
1% BRASIL 2%
MEXICO 10%
5%
ITALIA FRANCIA
3% 12% CANADA
IRLANDA ESTADOS UNIDOS 3%
1% 14%
DINAMARCA
2%
ESPAÑA
5%
FINLANDIA
2%
6. Empleado Abril Mayo Junio
Buchanan, Steven $3,918.71 $4,937.57 $6,418.85
Callahan, Laura $7,487.88 $9,434.73 $12,265.15
Davolio, Nancy $8,836.64 $11,134.17 $14,474.42
Dodsworth, Anne $3,326.26 $3,958.25 $5,145.72
Fuller, Andrew $8,696.41 $10,348.73 $13,453.35
King, Robert $6,665.44 $7,931.87 $10,311.44
Leverling, Janet $10,884.74 $12,299.76 $15,989.68
Peacock, Margaret $11,346.14 $12,821.14 $16,667.48
Suyama, Michael $3,780.47 $4,271.93 $5,553.51
14
12
10
8
6
4
2
0 CLIENTES
14
12
10
8
6 CLIENTES
4
2
0
7. País Trimestre 1 2011 Trimestre 2 2011
Argentina $598.58 $742.24
Brasil $4,880.19 $6,051.44
México $1,122.78 $1,392.25
Venezuela $2,735.18 $3,391.62
España $861.89 $3,583.09
Alemania $11,283.28 $1,129.08
Austria $7,391.50 $14,781.10
Bélgica $1,280.14 $9,682.87
Dinamarca $1,396.19 $1,676.98
Finlandia $943.27 $1,829.01
Francia $4,205.46 $1,235.68
Irlanda $2,755.24 $5,509.15
Italia $864.44 $3,609.36
Noruega $275.50 $1,132.42
Polonia $163.70 $360.91
Portugal $643.53 $214.45
Reino Unido $2,943.31 $843.02
Suecia $3,248.56 $3,855.74
Suiza $1,368.53 $4,255.61
Canadá $2,198.09 $2,659.69
EstadosUnidos $13,783.33 $16,677.83
- Las ventas en los países de América Latina se incrementaron en un 24%
- Canadá y EEUU un 31%
- Países de Europa 21%