Download to read offline
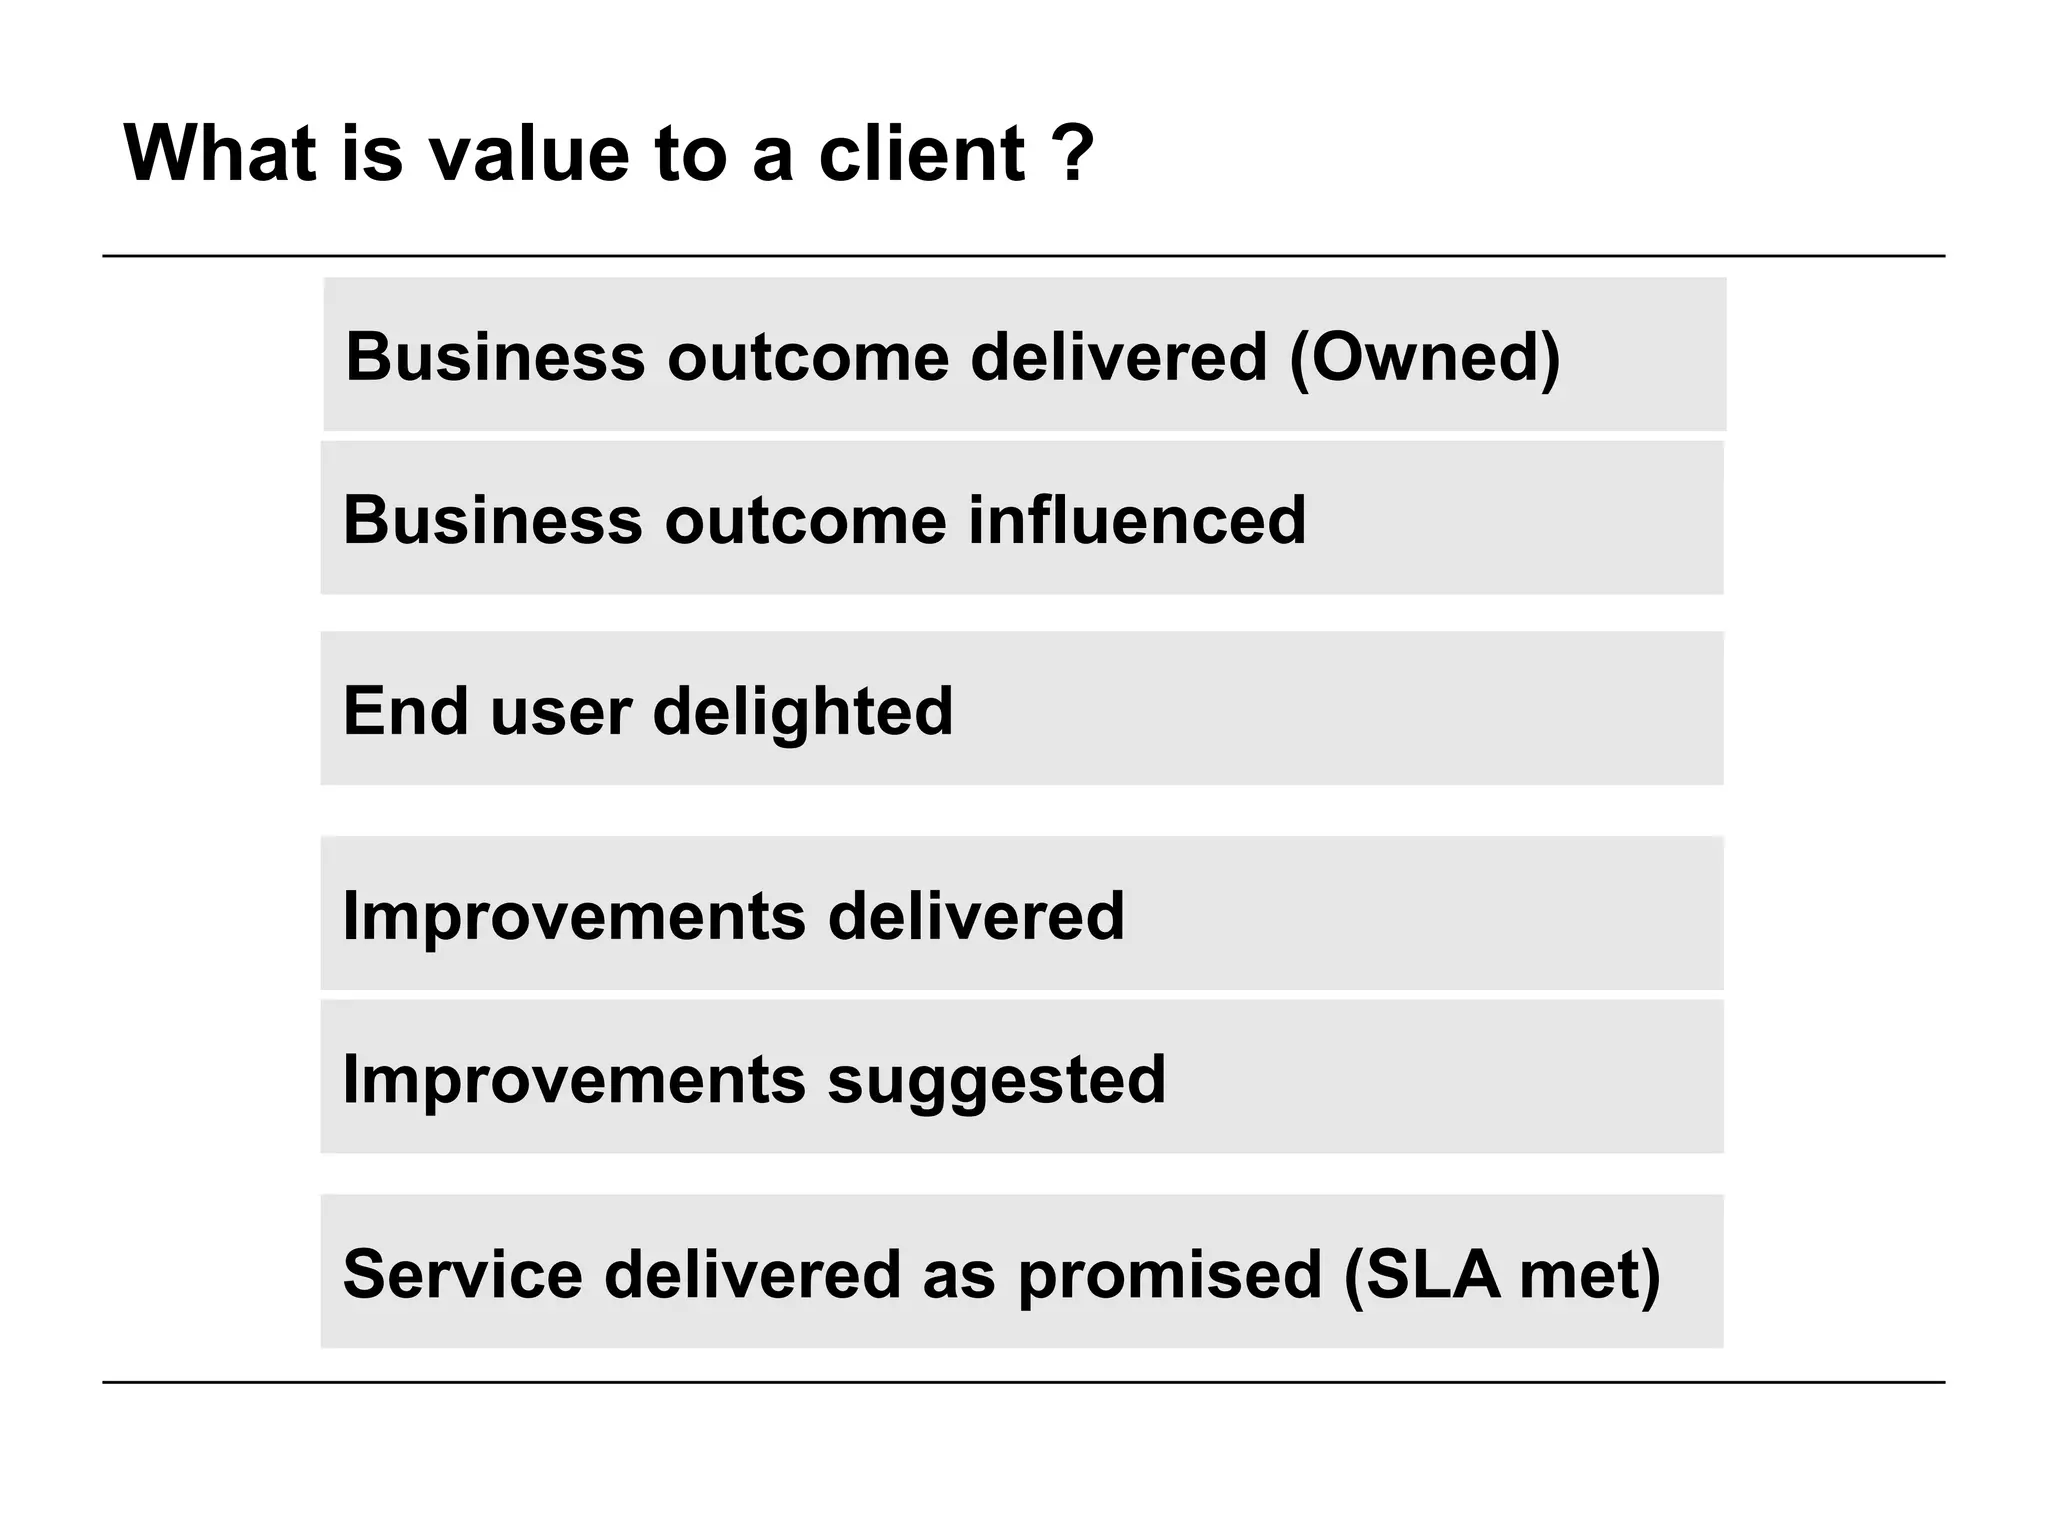
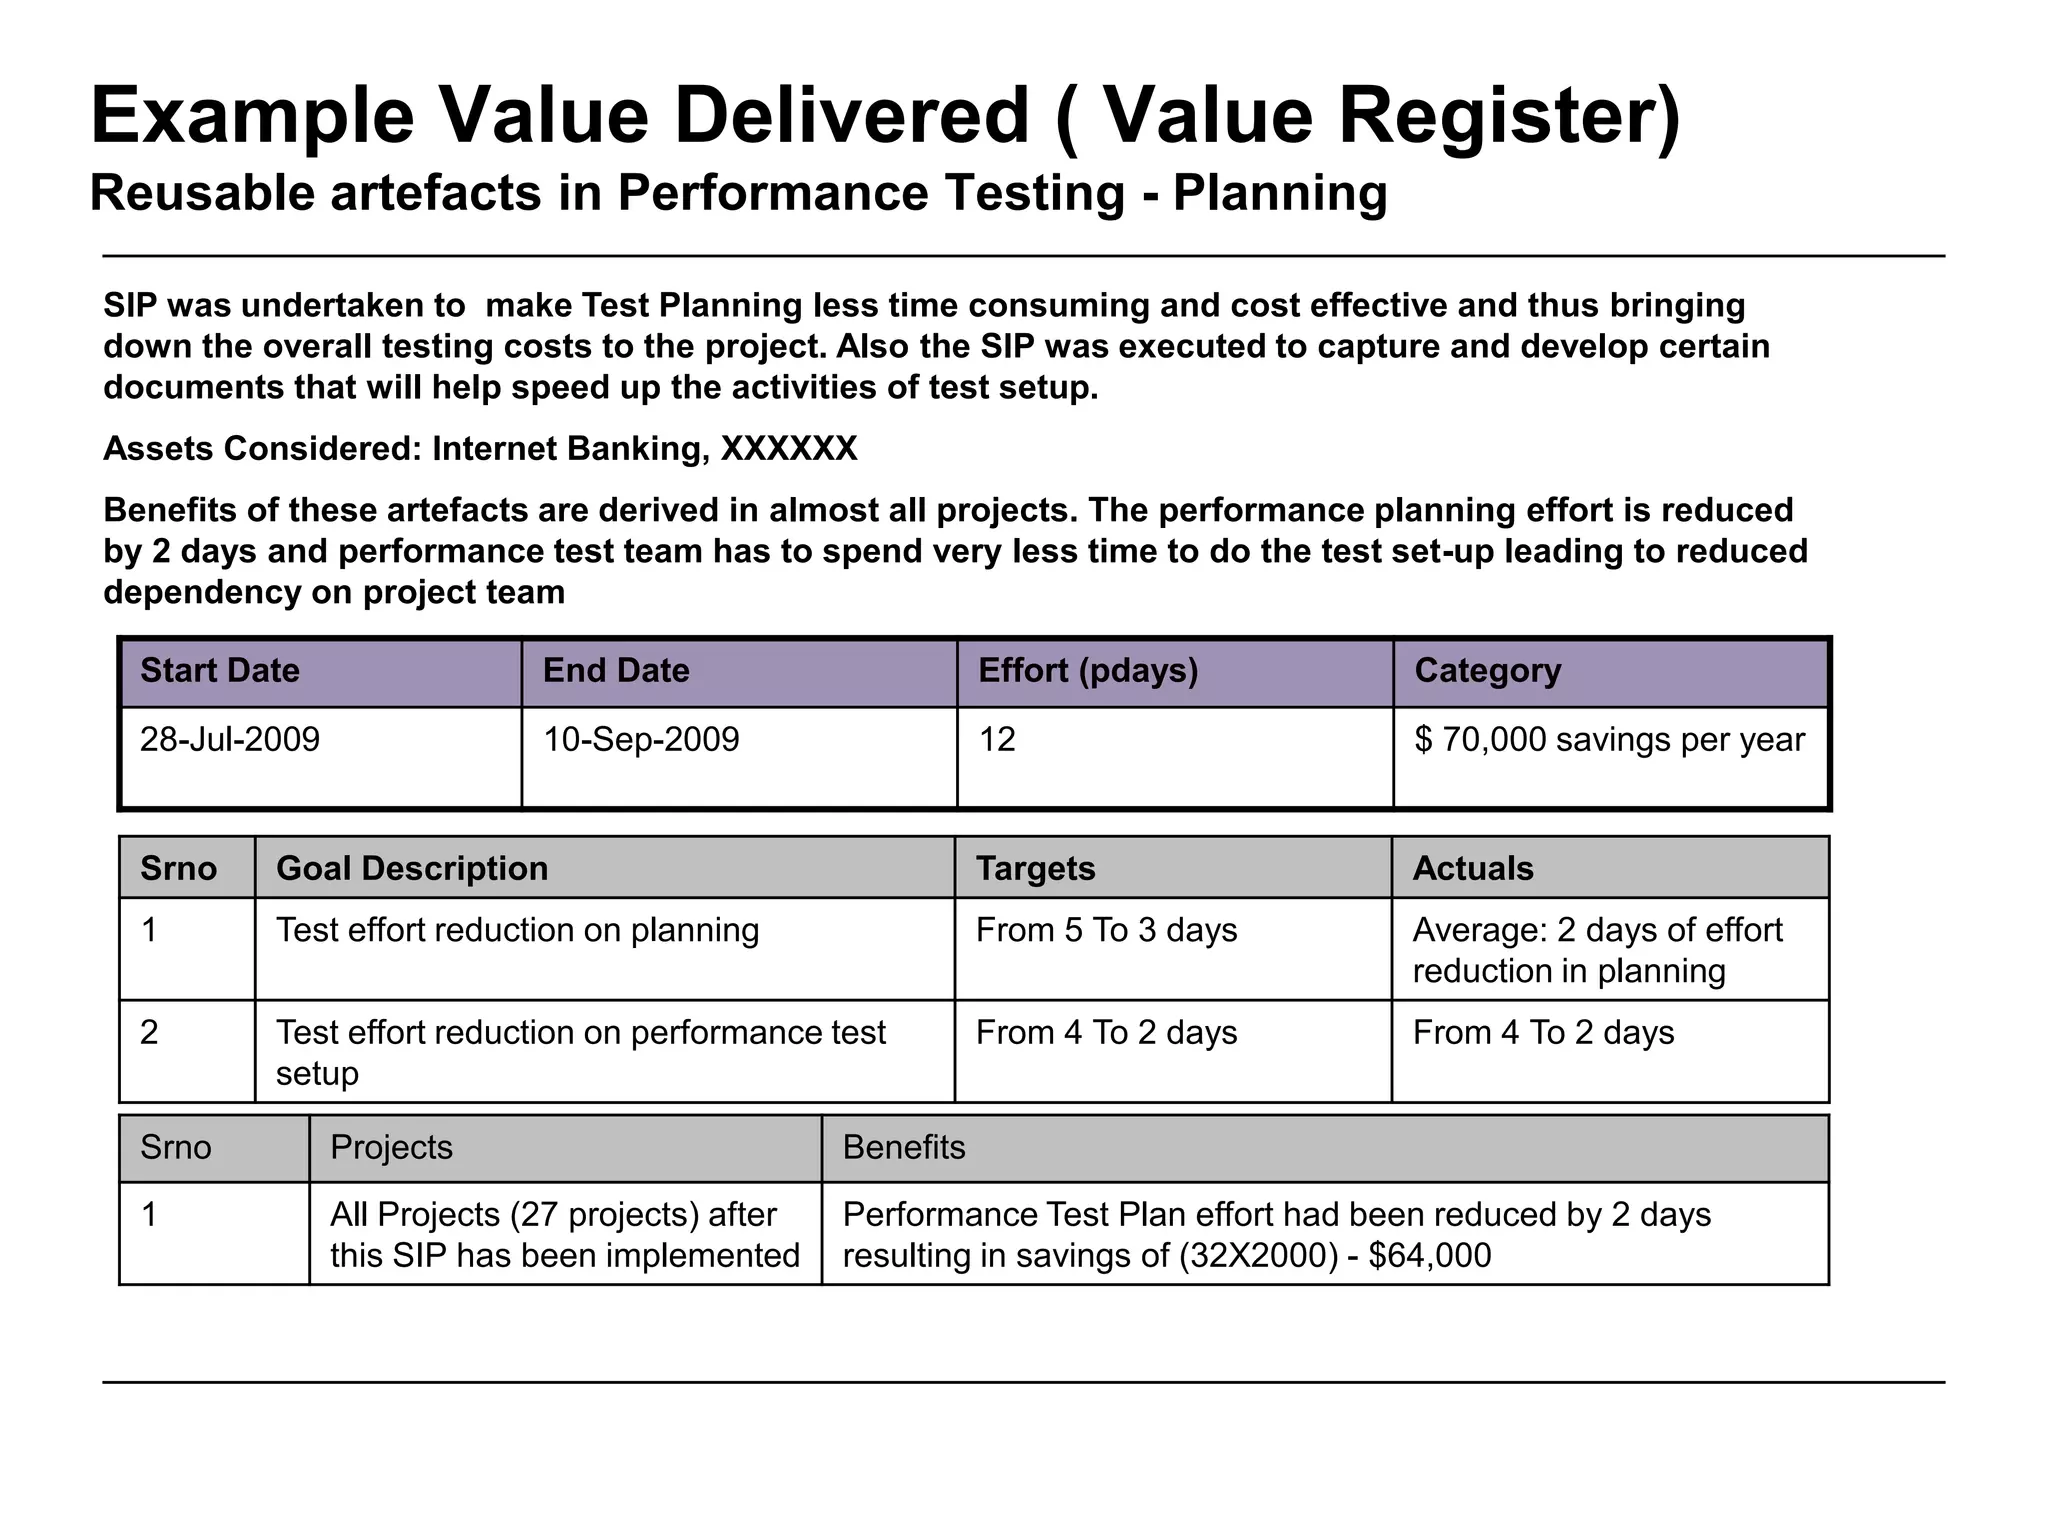
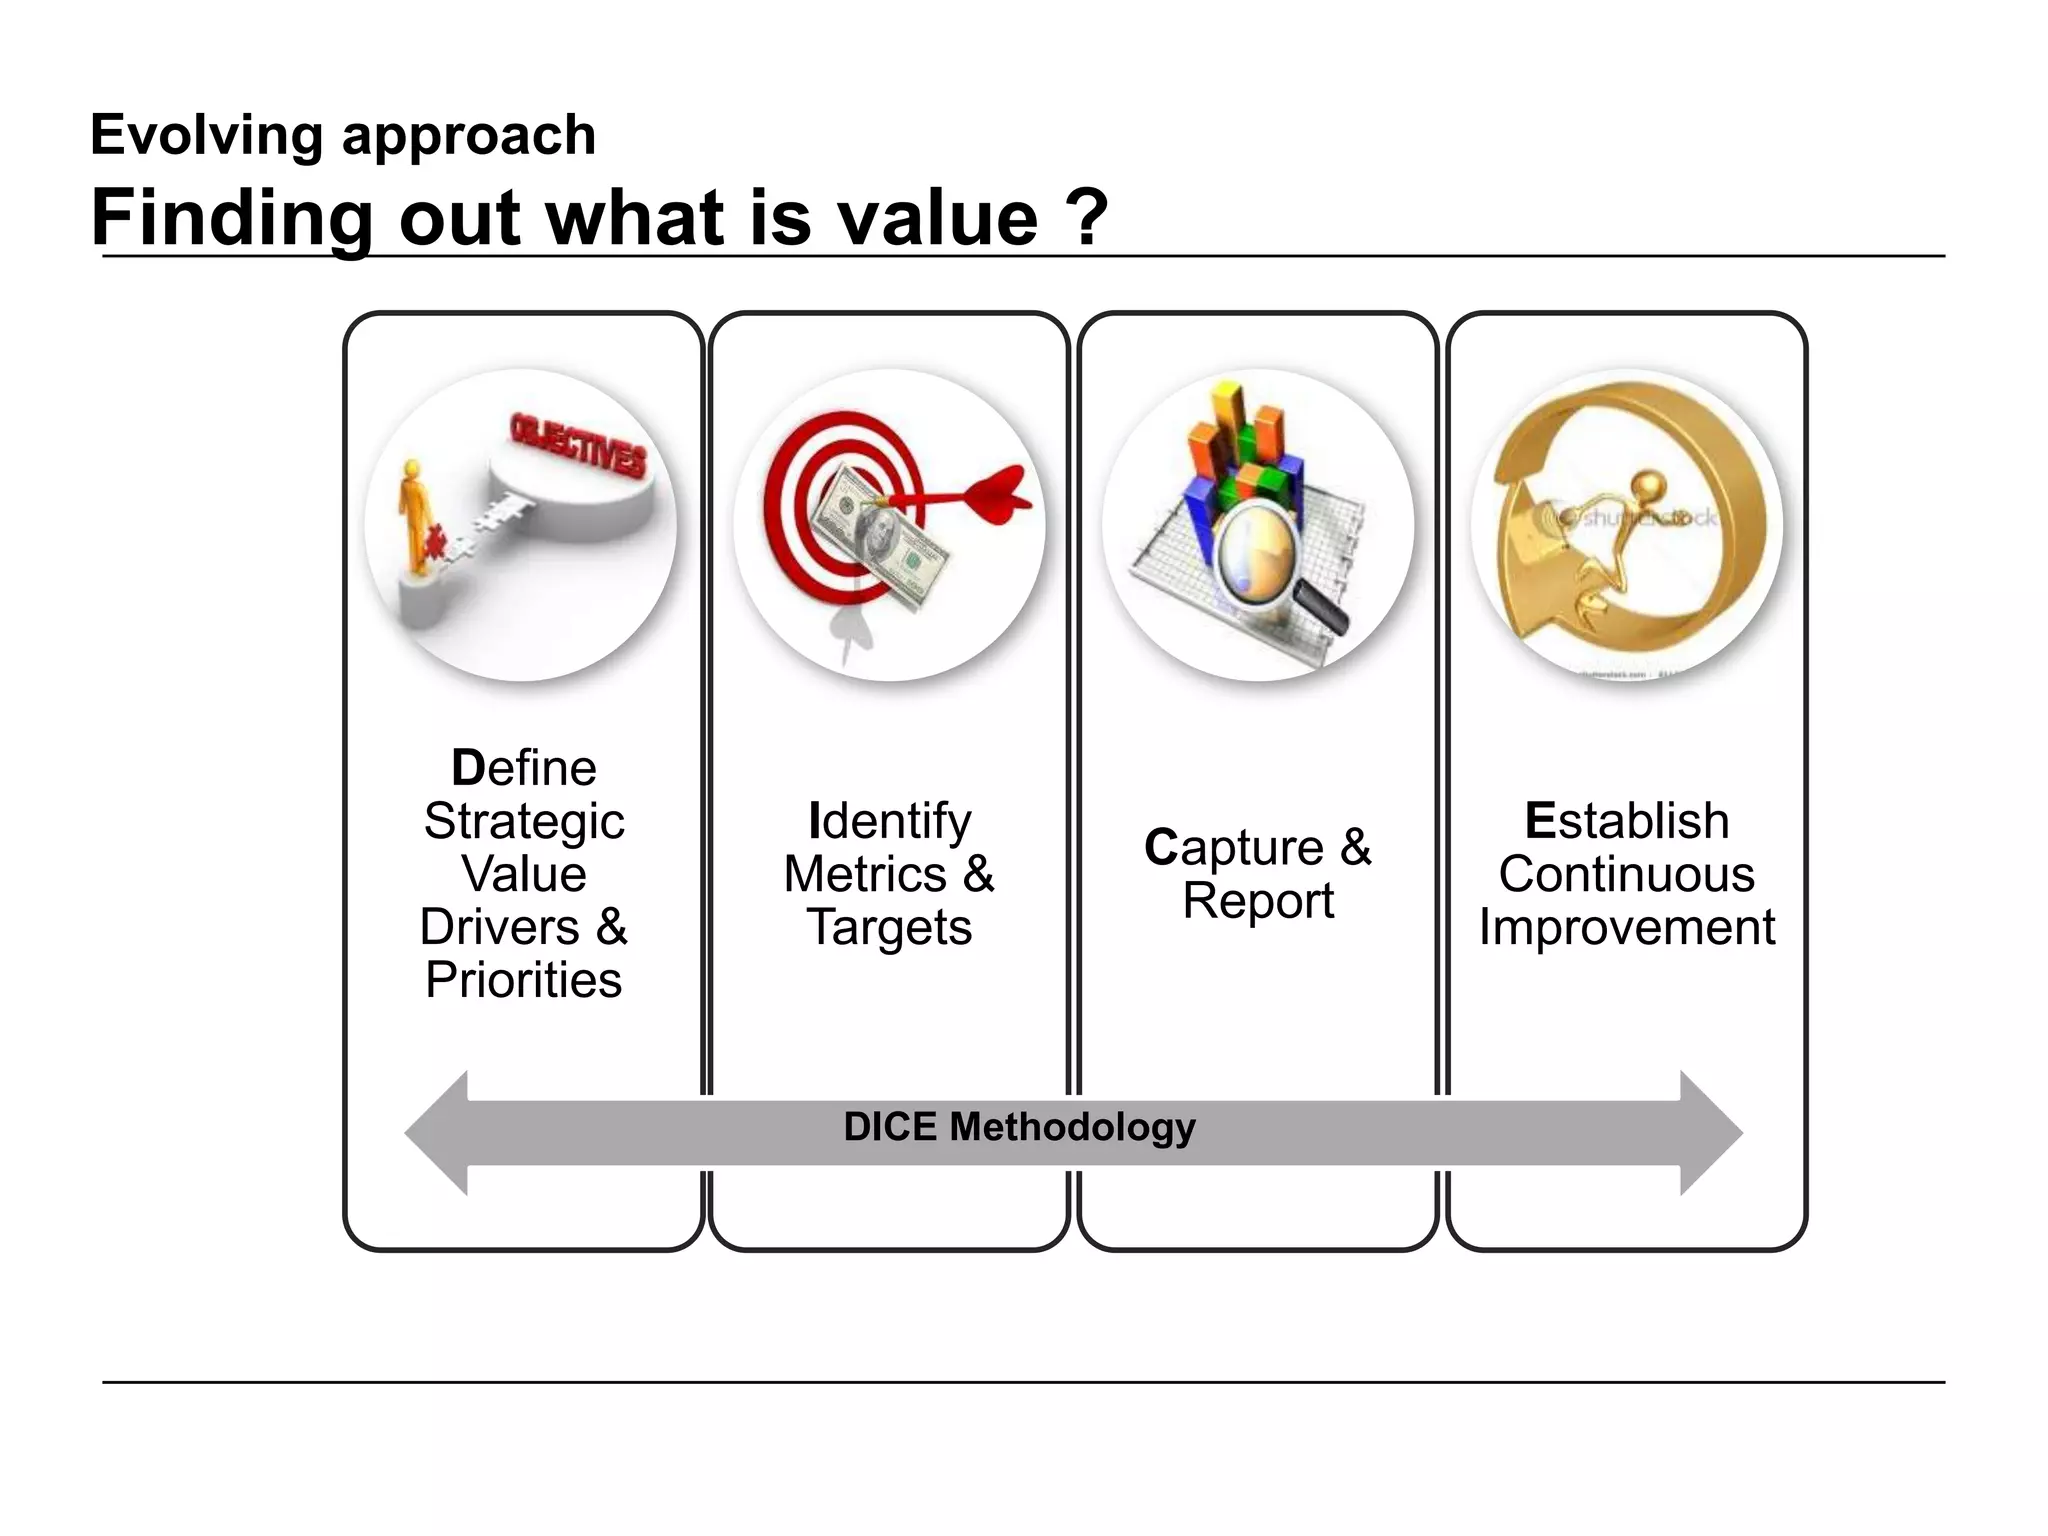


This document discusses the importance of measuring value delivered to clients, rather than just metrics. It provides examples of defining strategic value drivers and priorities and aligning metrics and targets to those priorities. Value is defined as things like improvements suggested and delivered, business outcomes achieved, and how much the service delighted the end user. The document advocates adopting a methodology to continuously identify value, define metrics, capture results, and improve.


