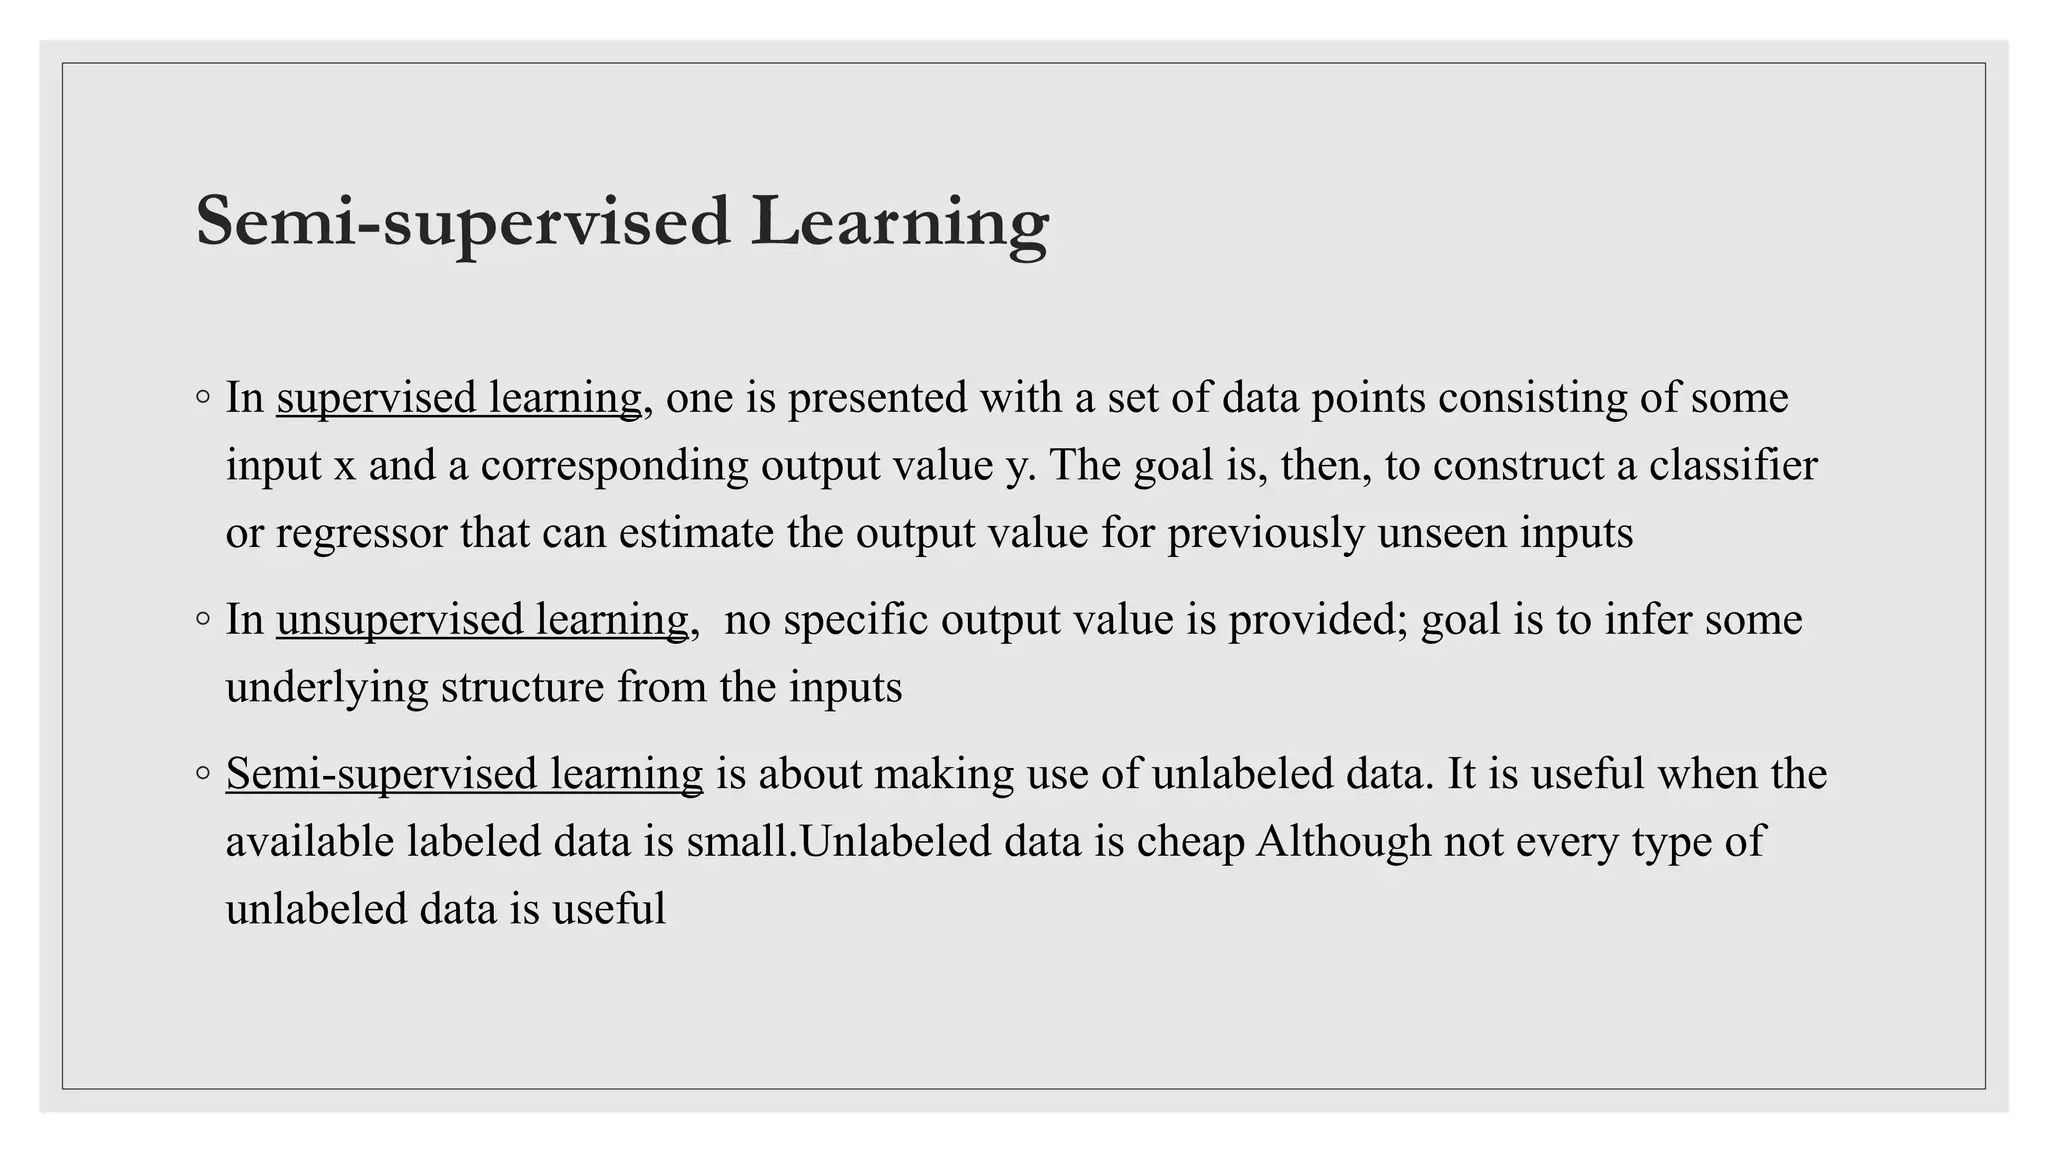
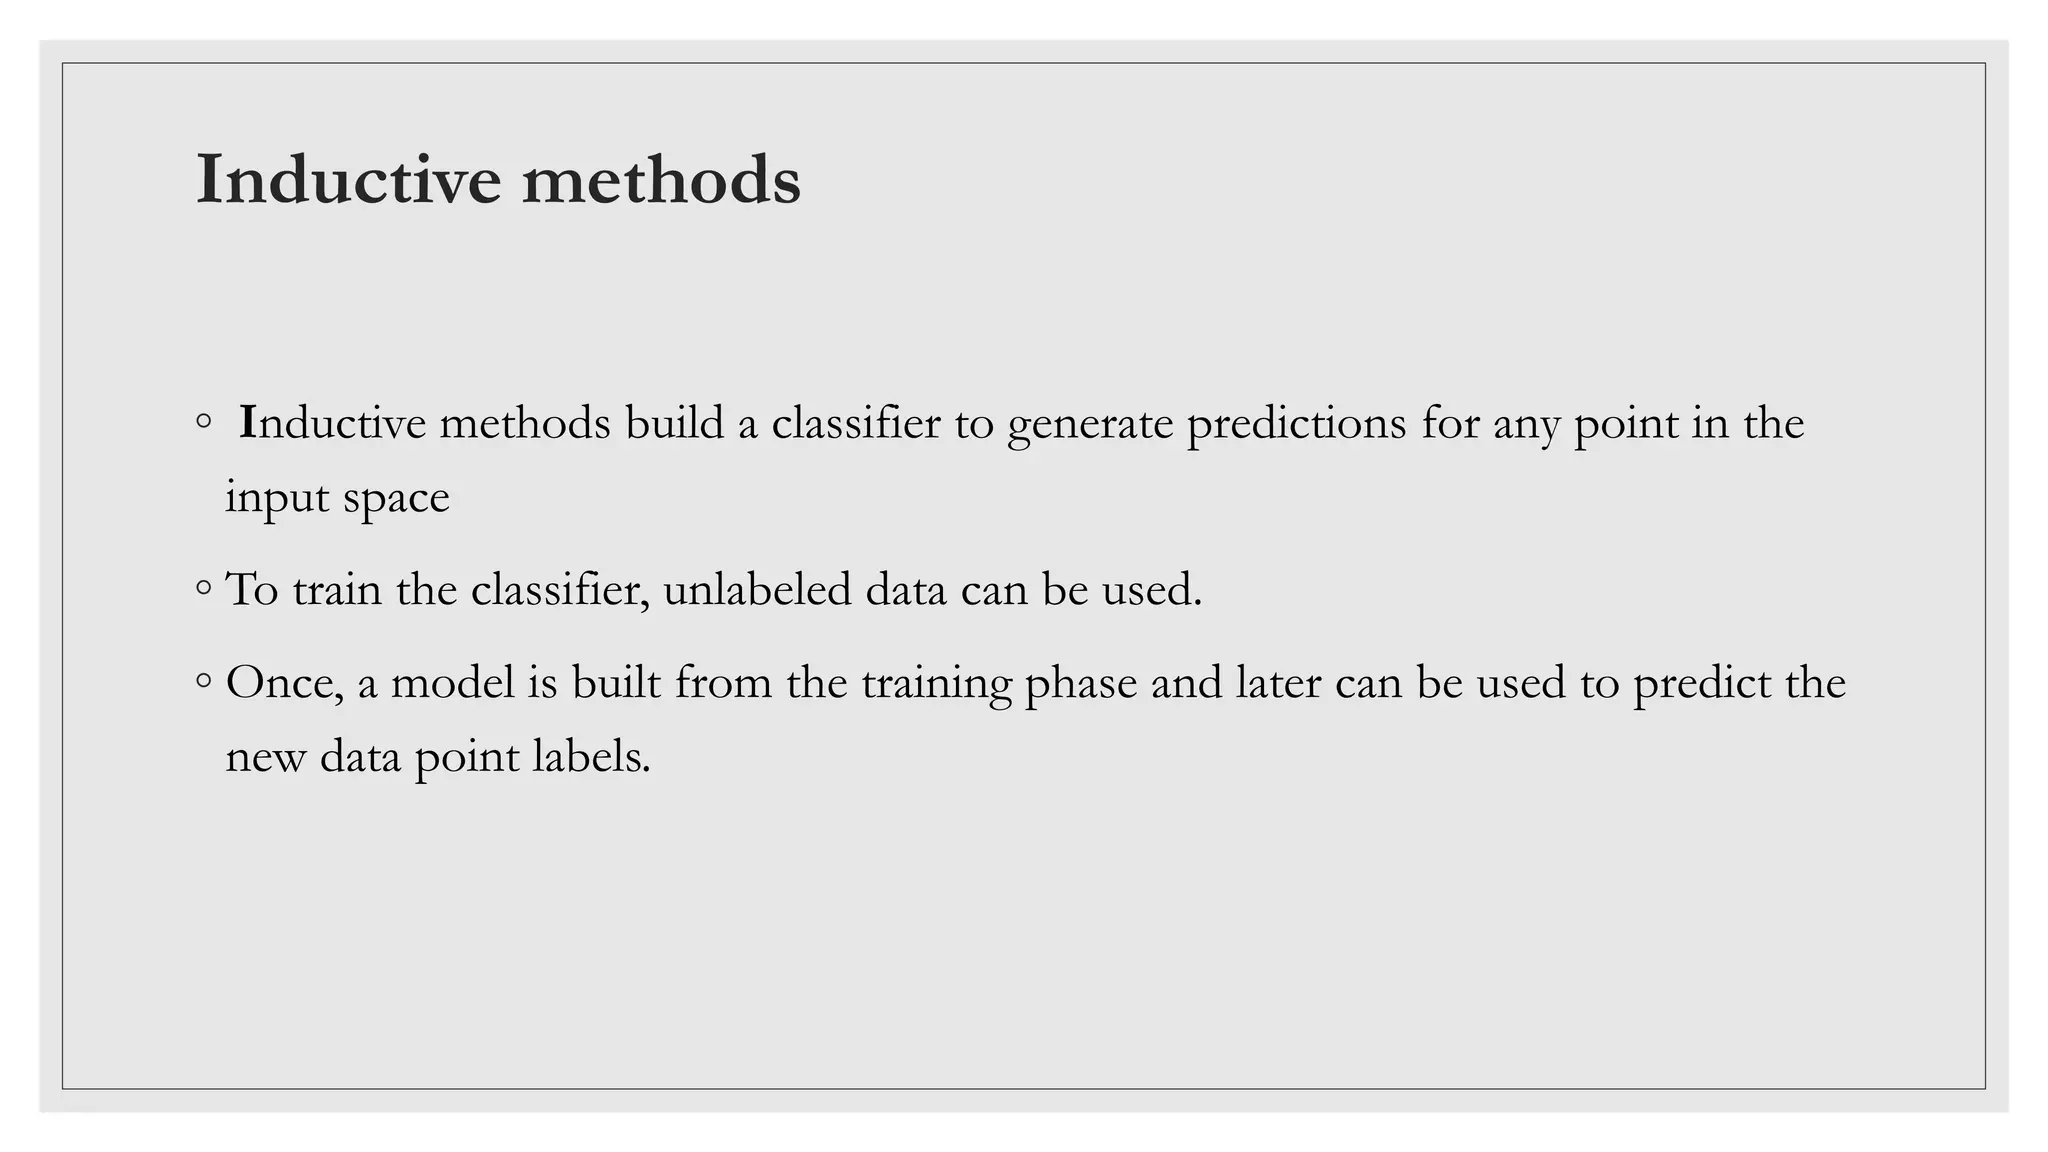
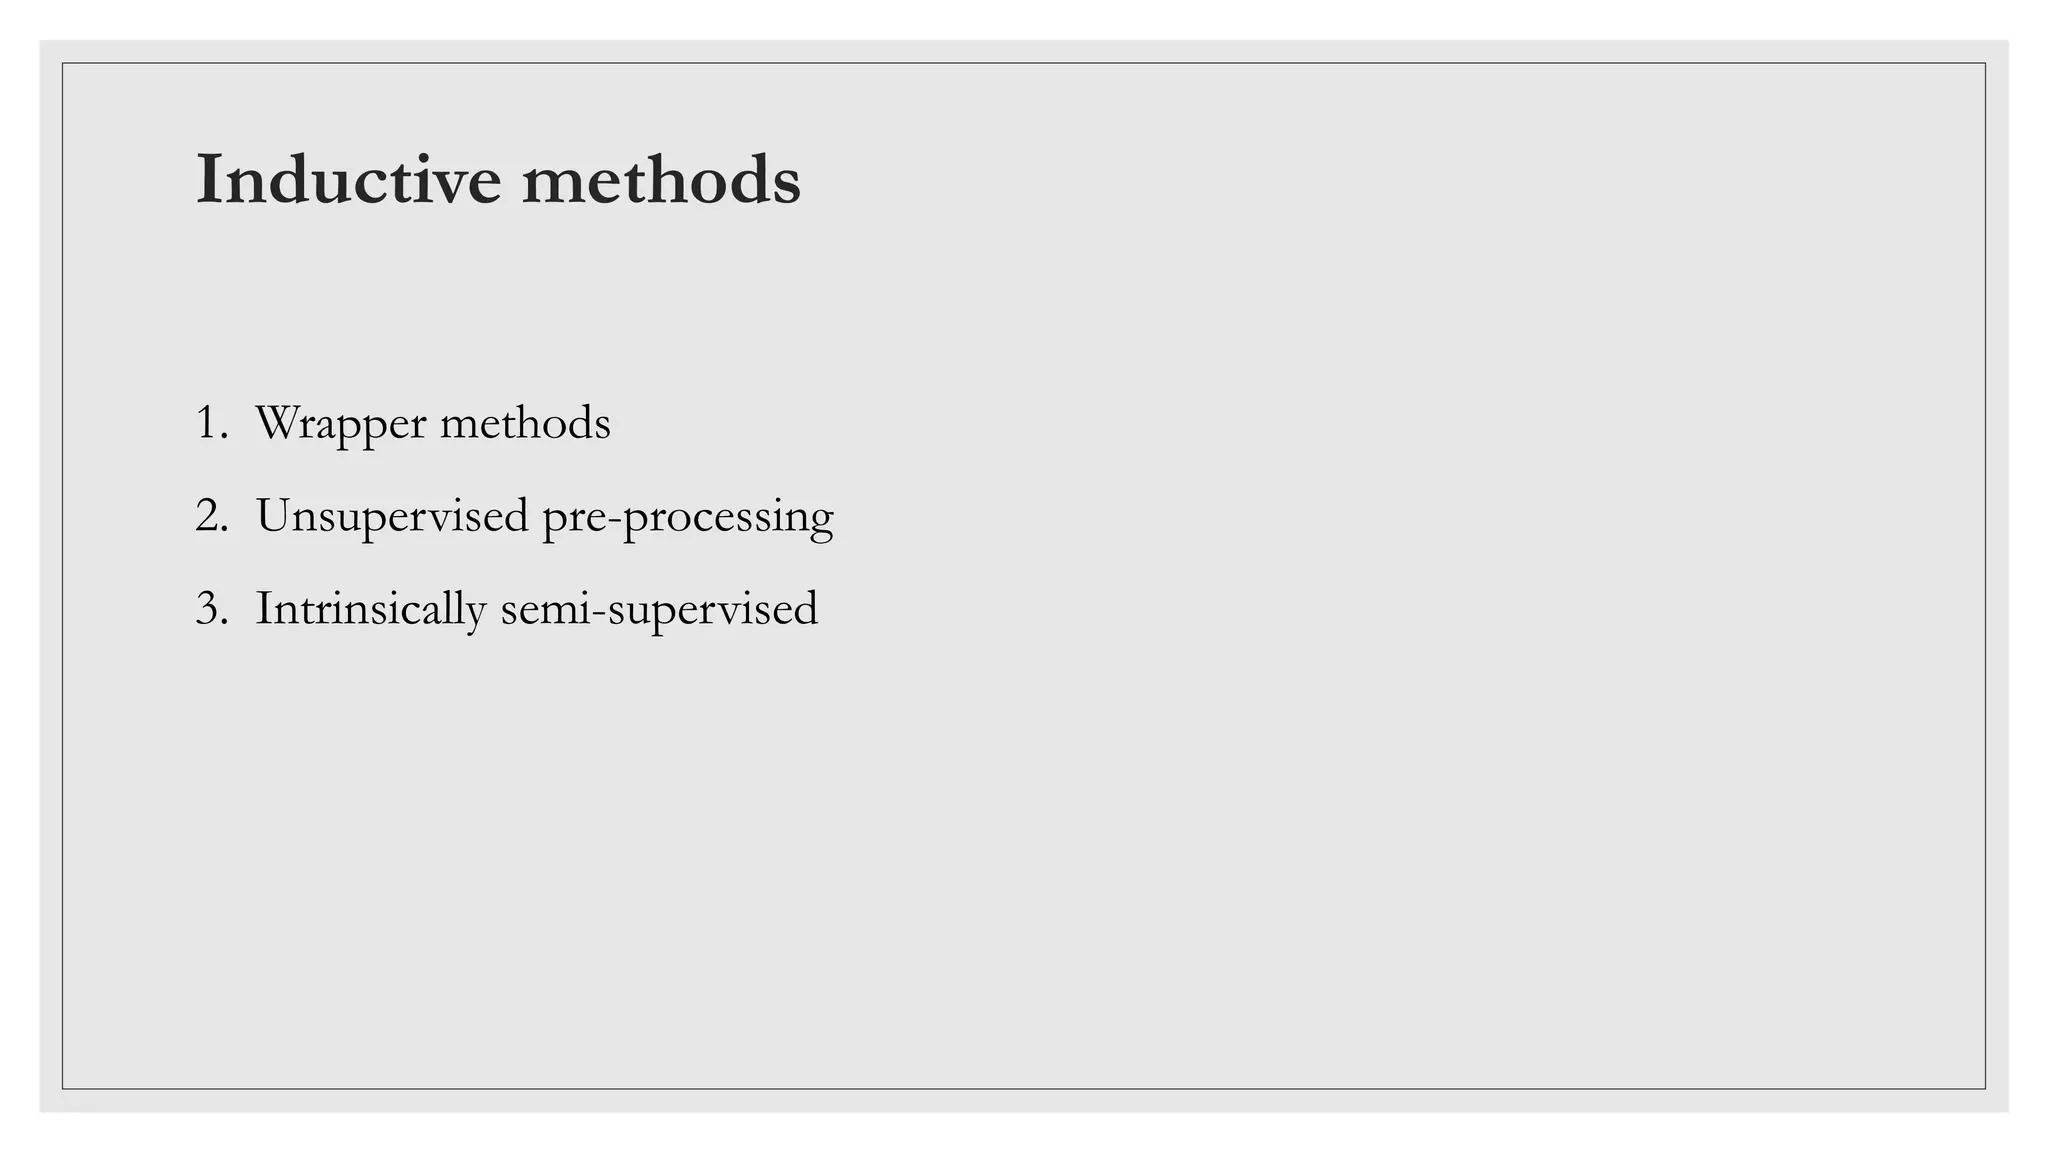
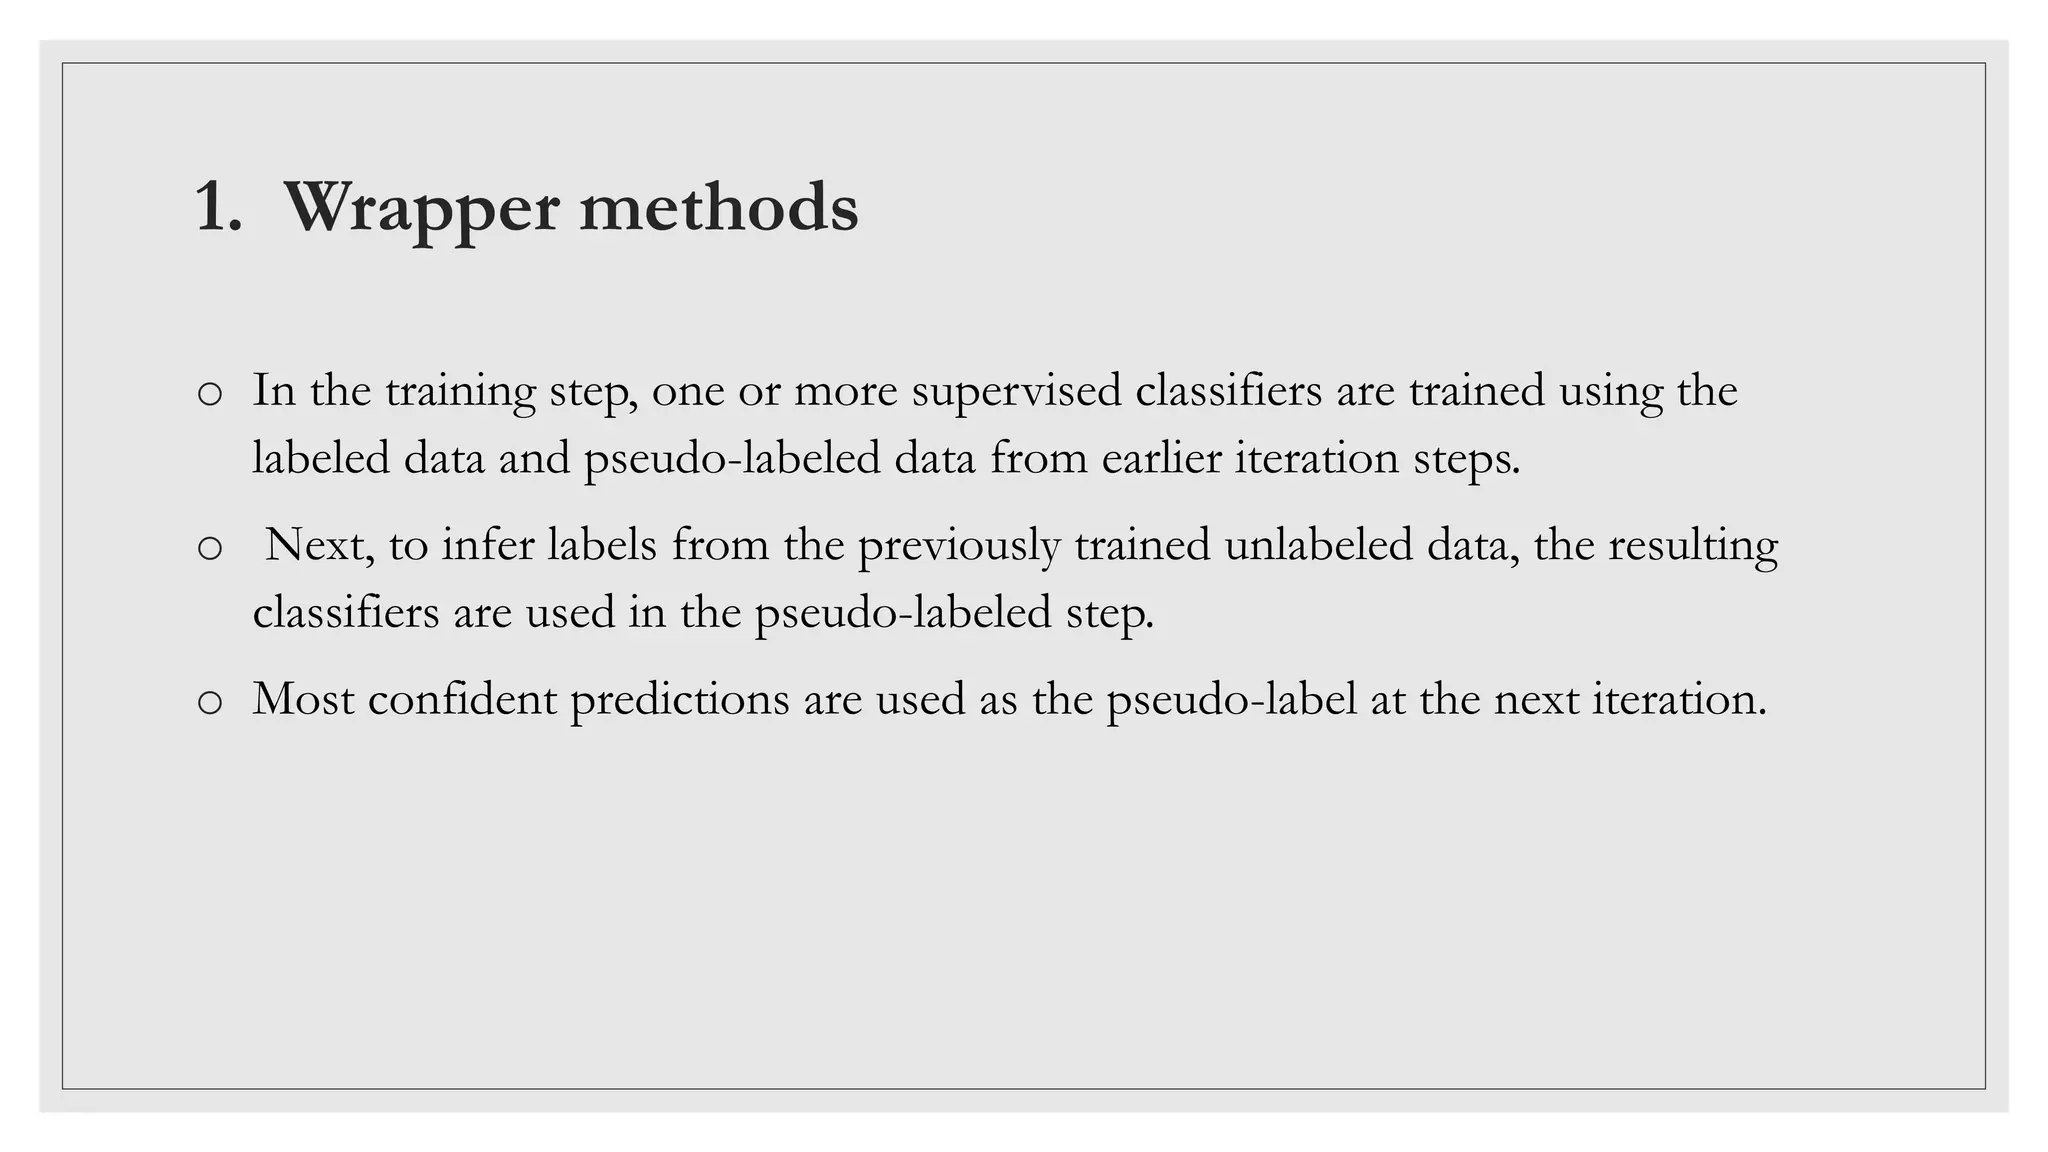
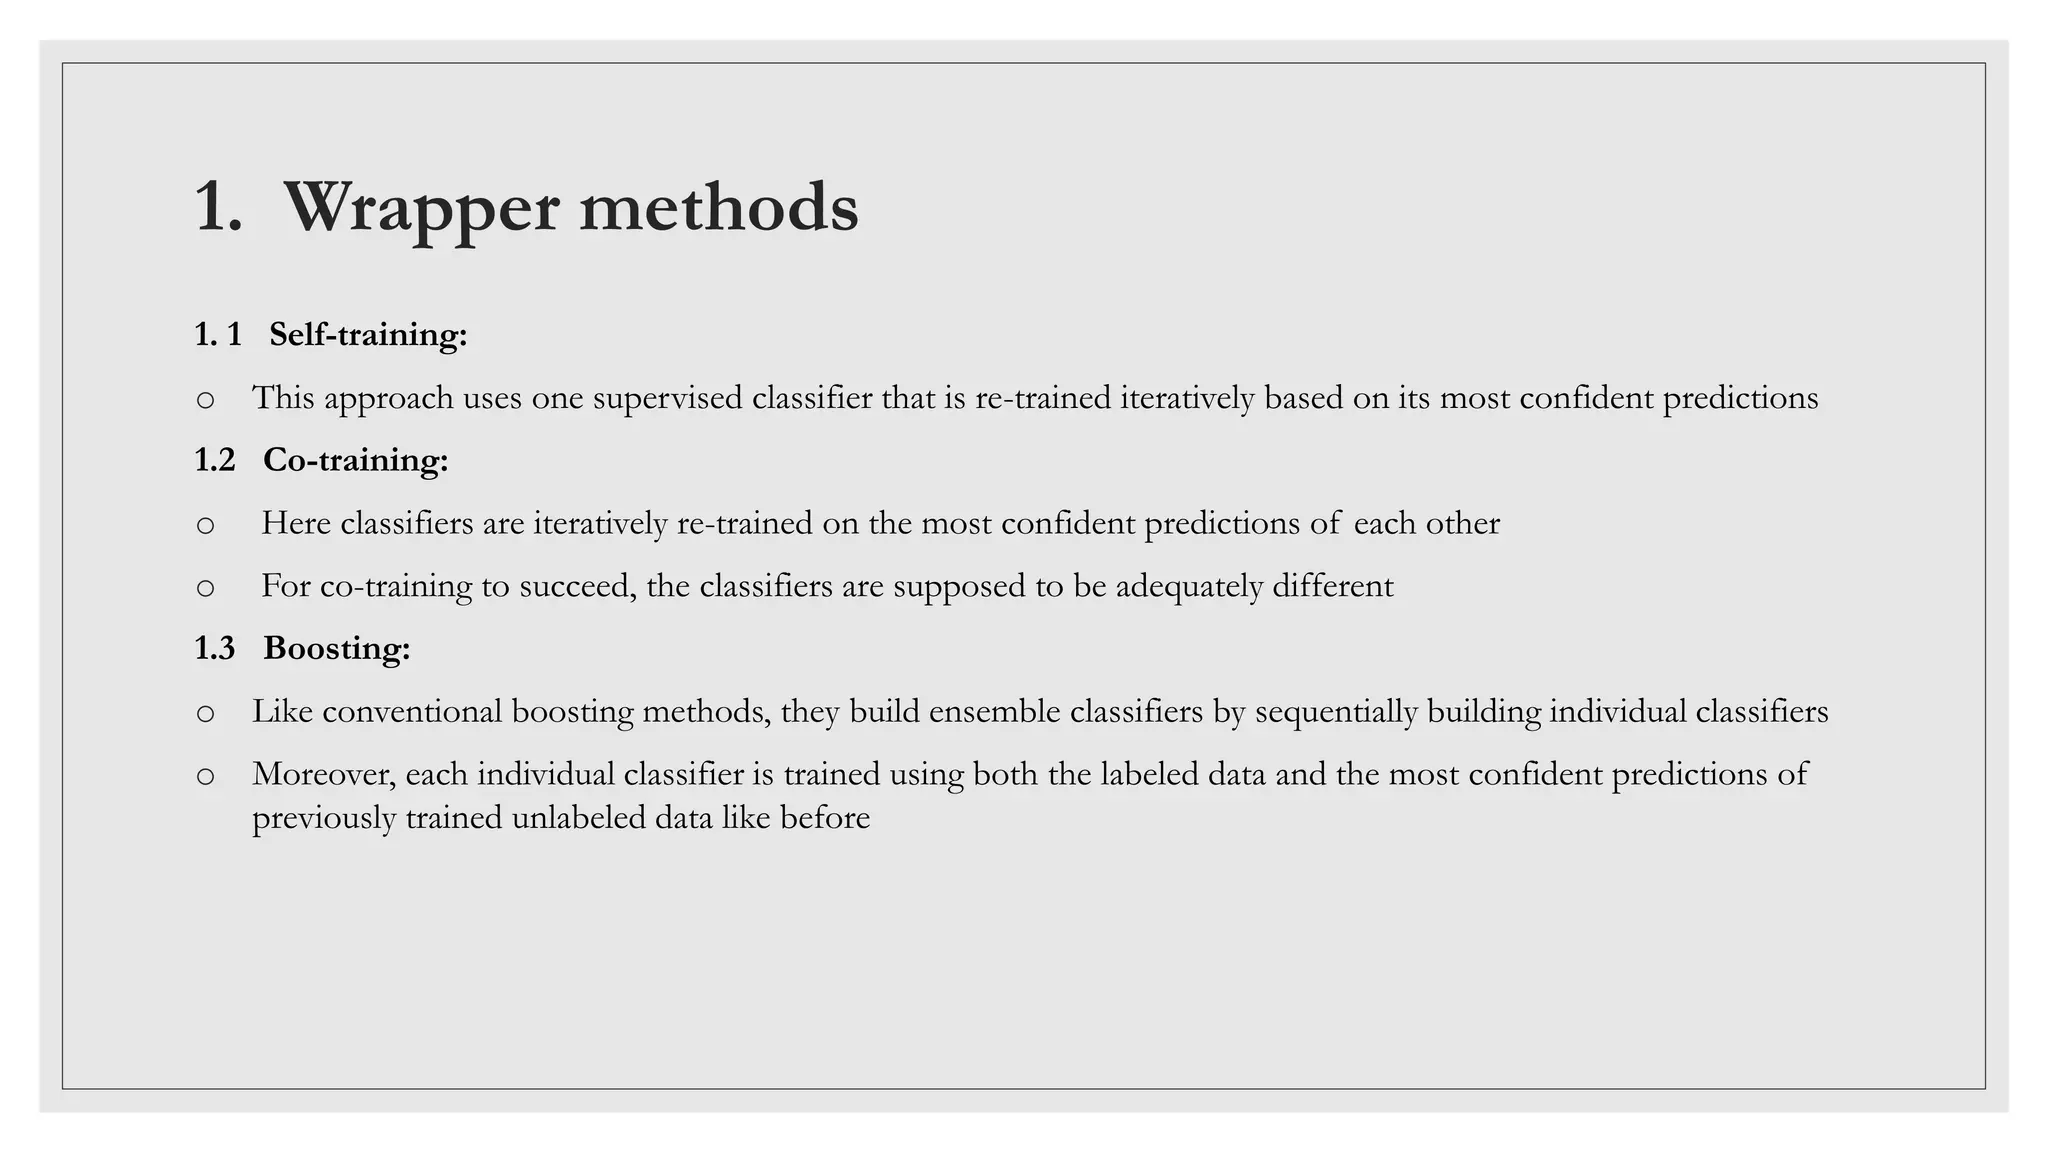
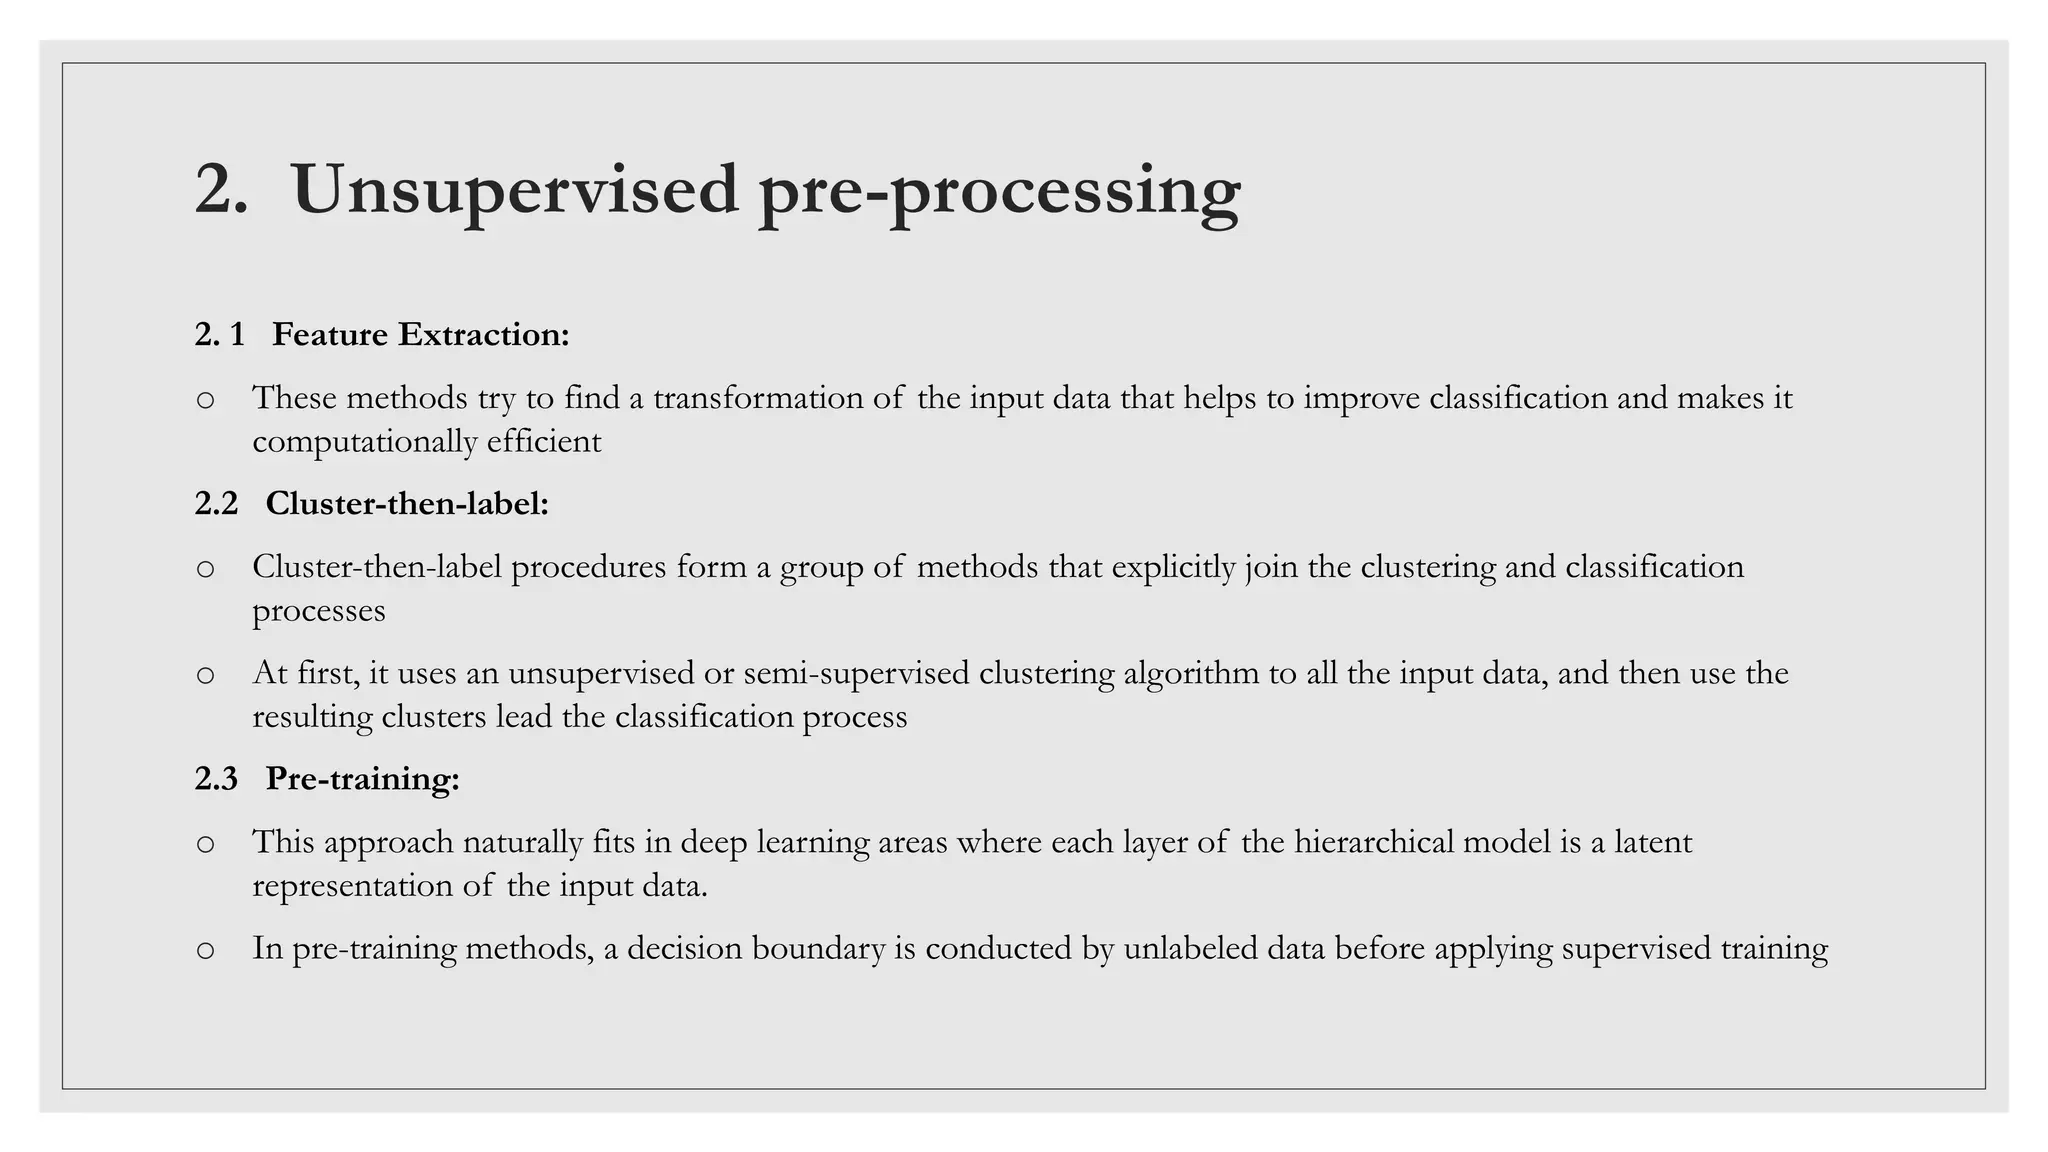
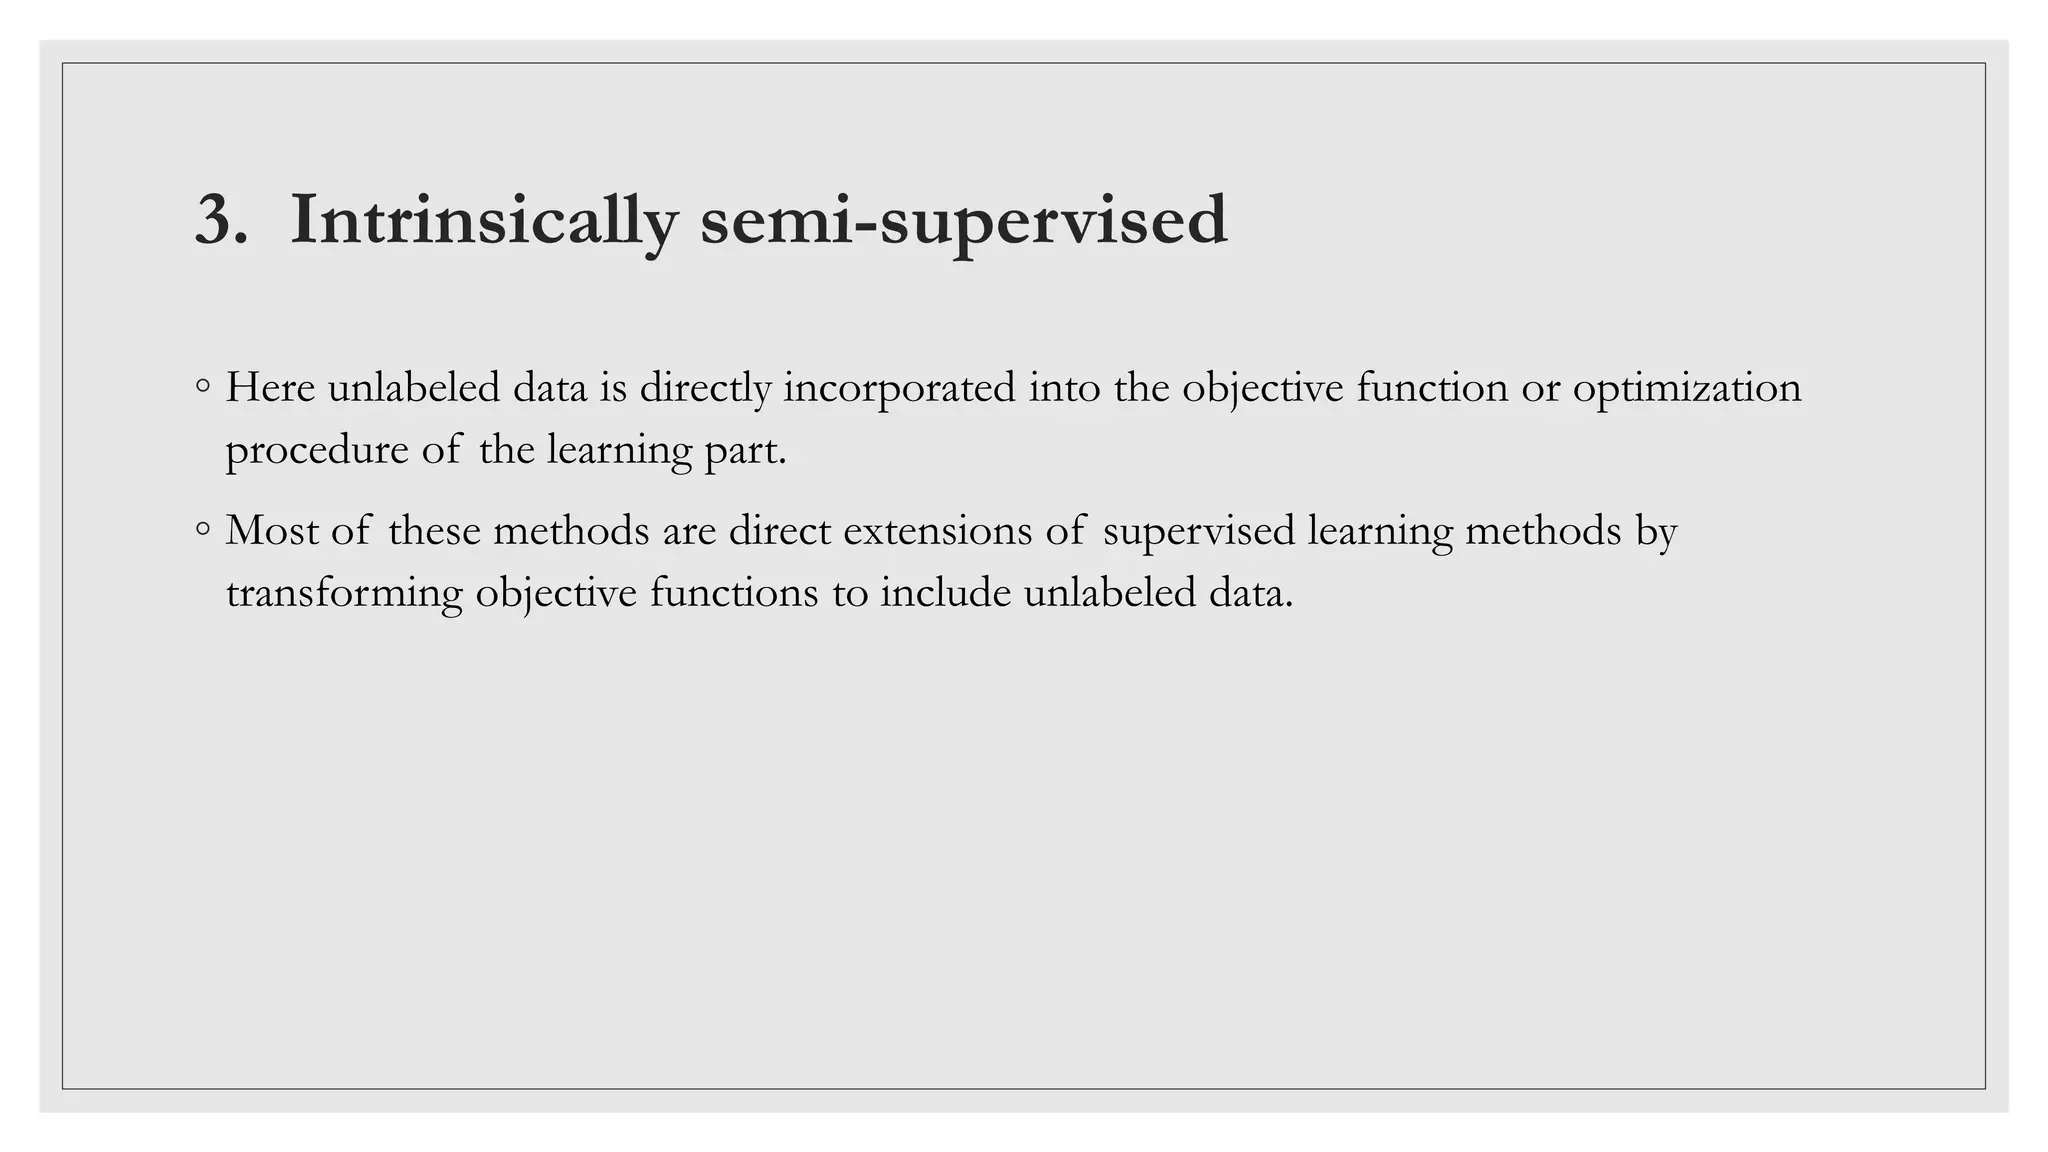
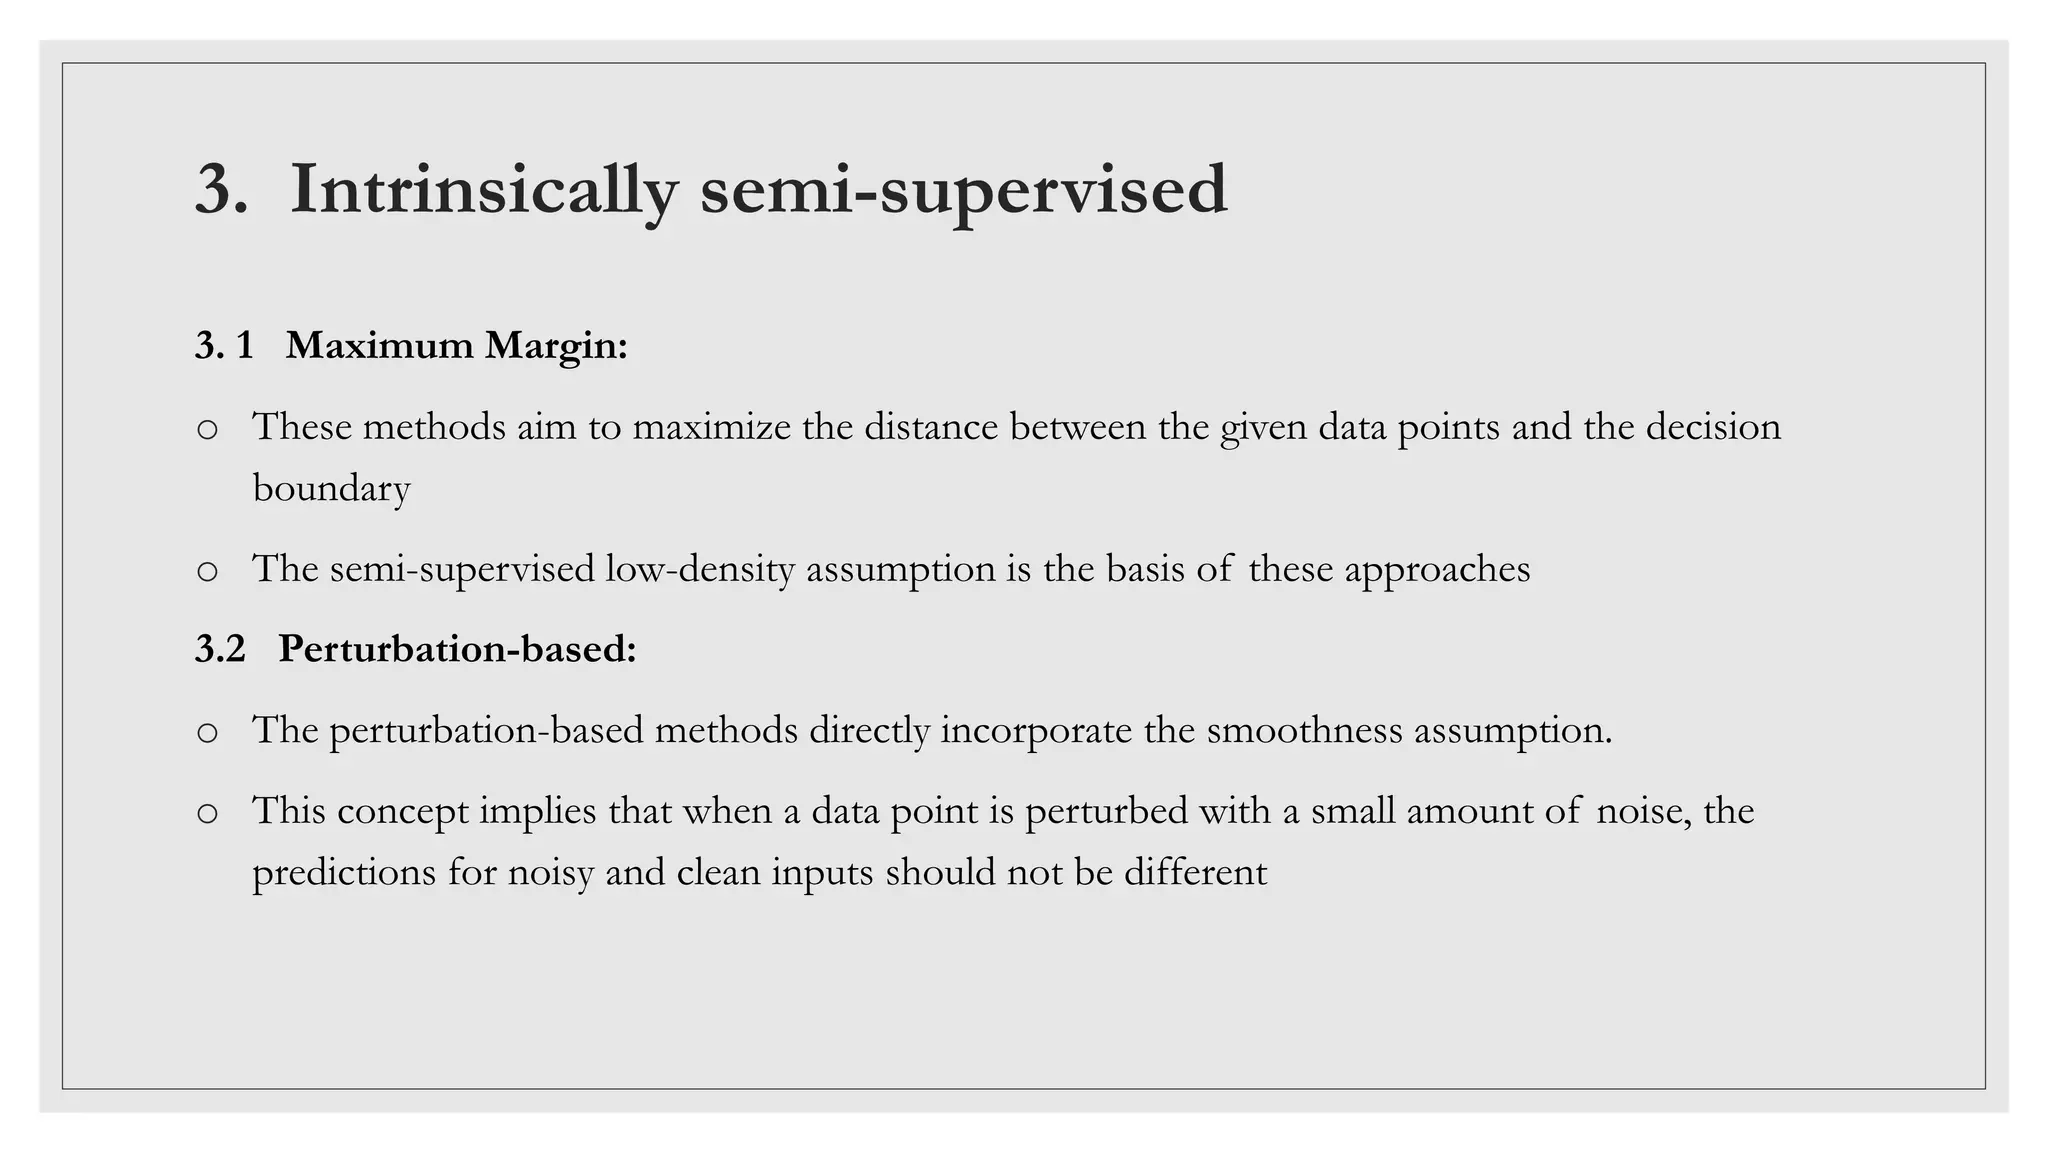
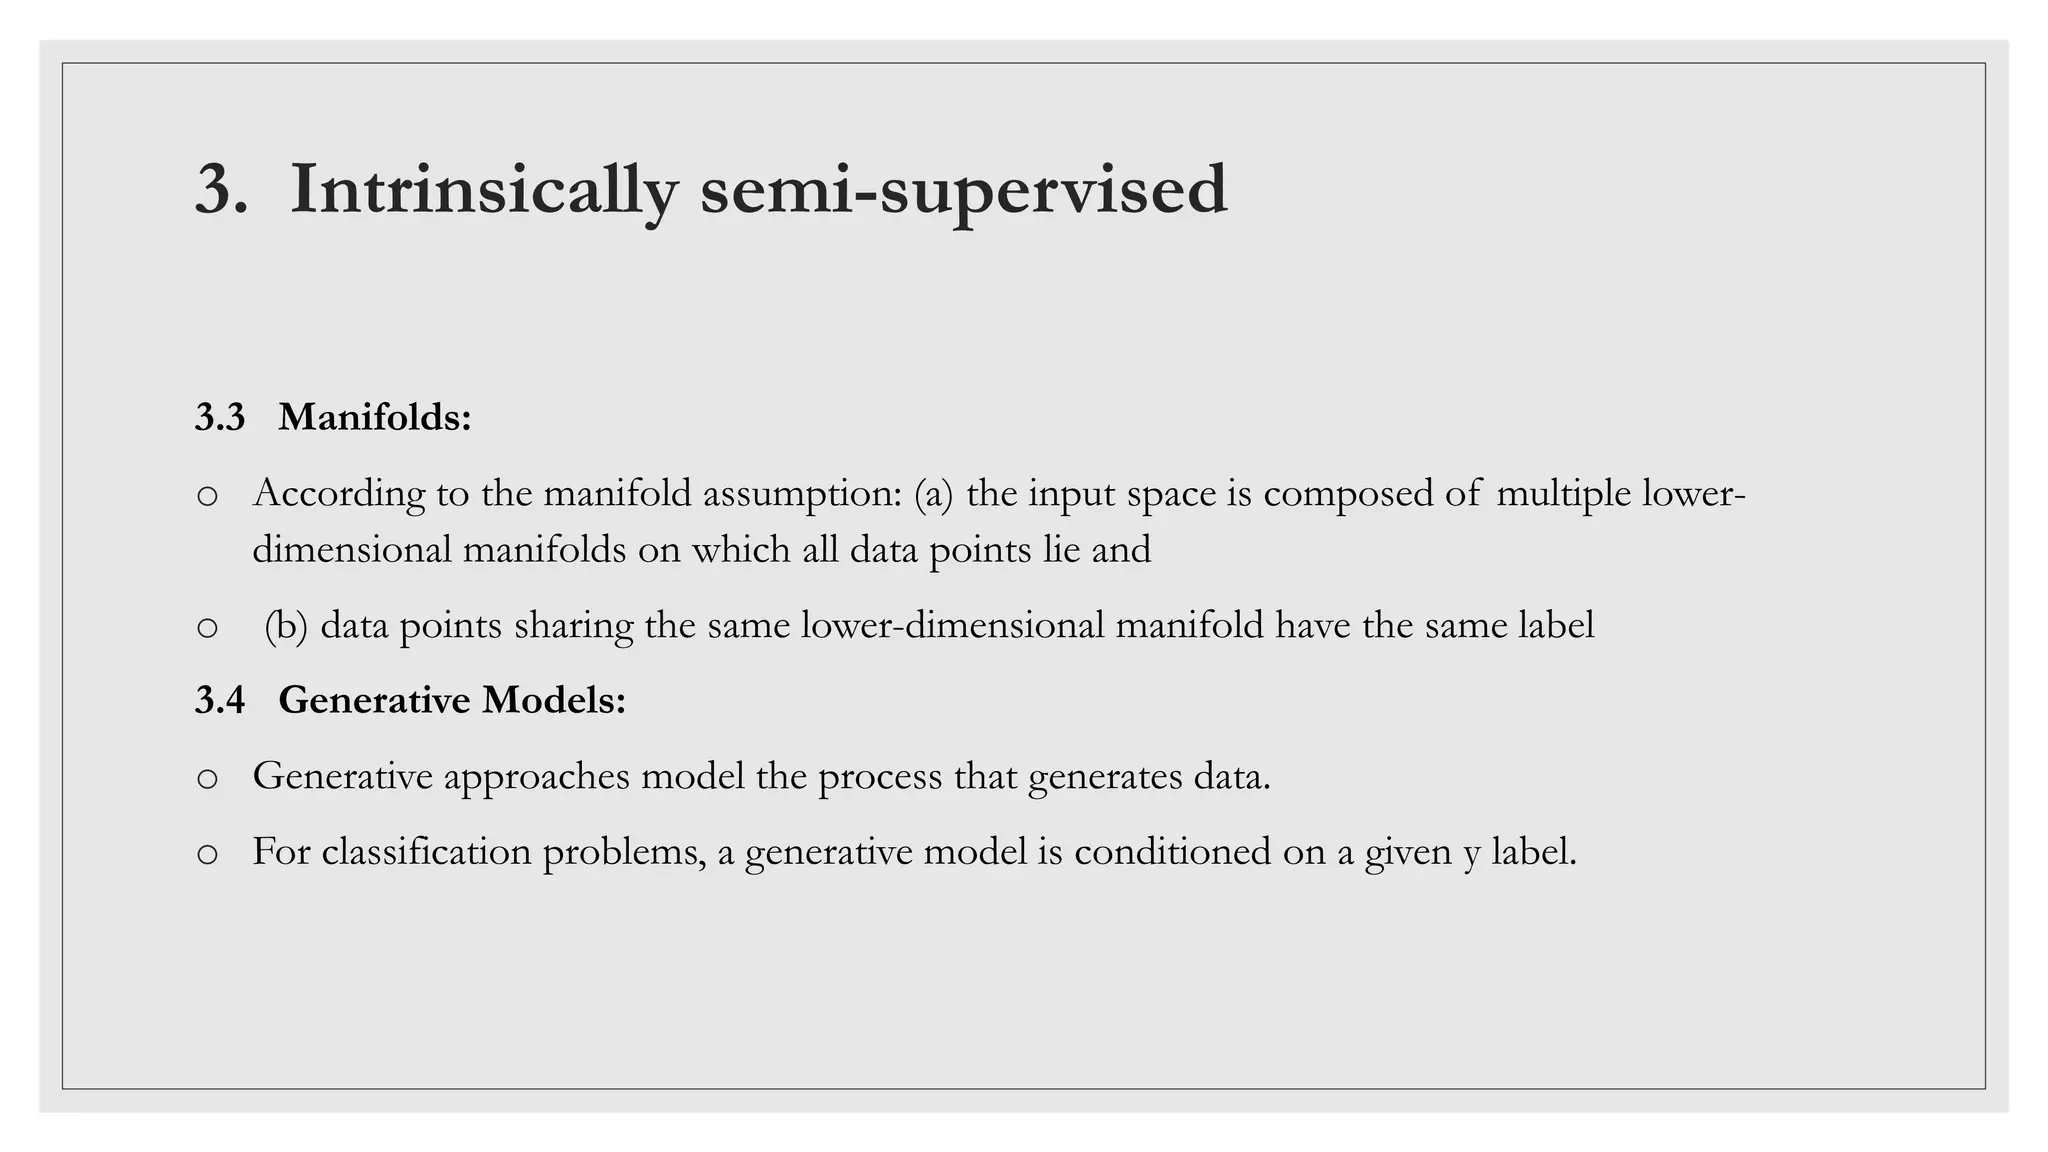
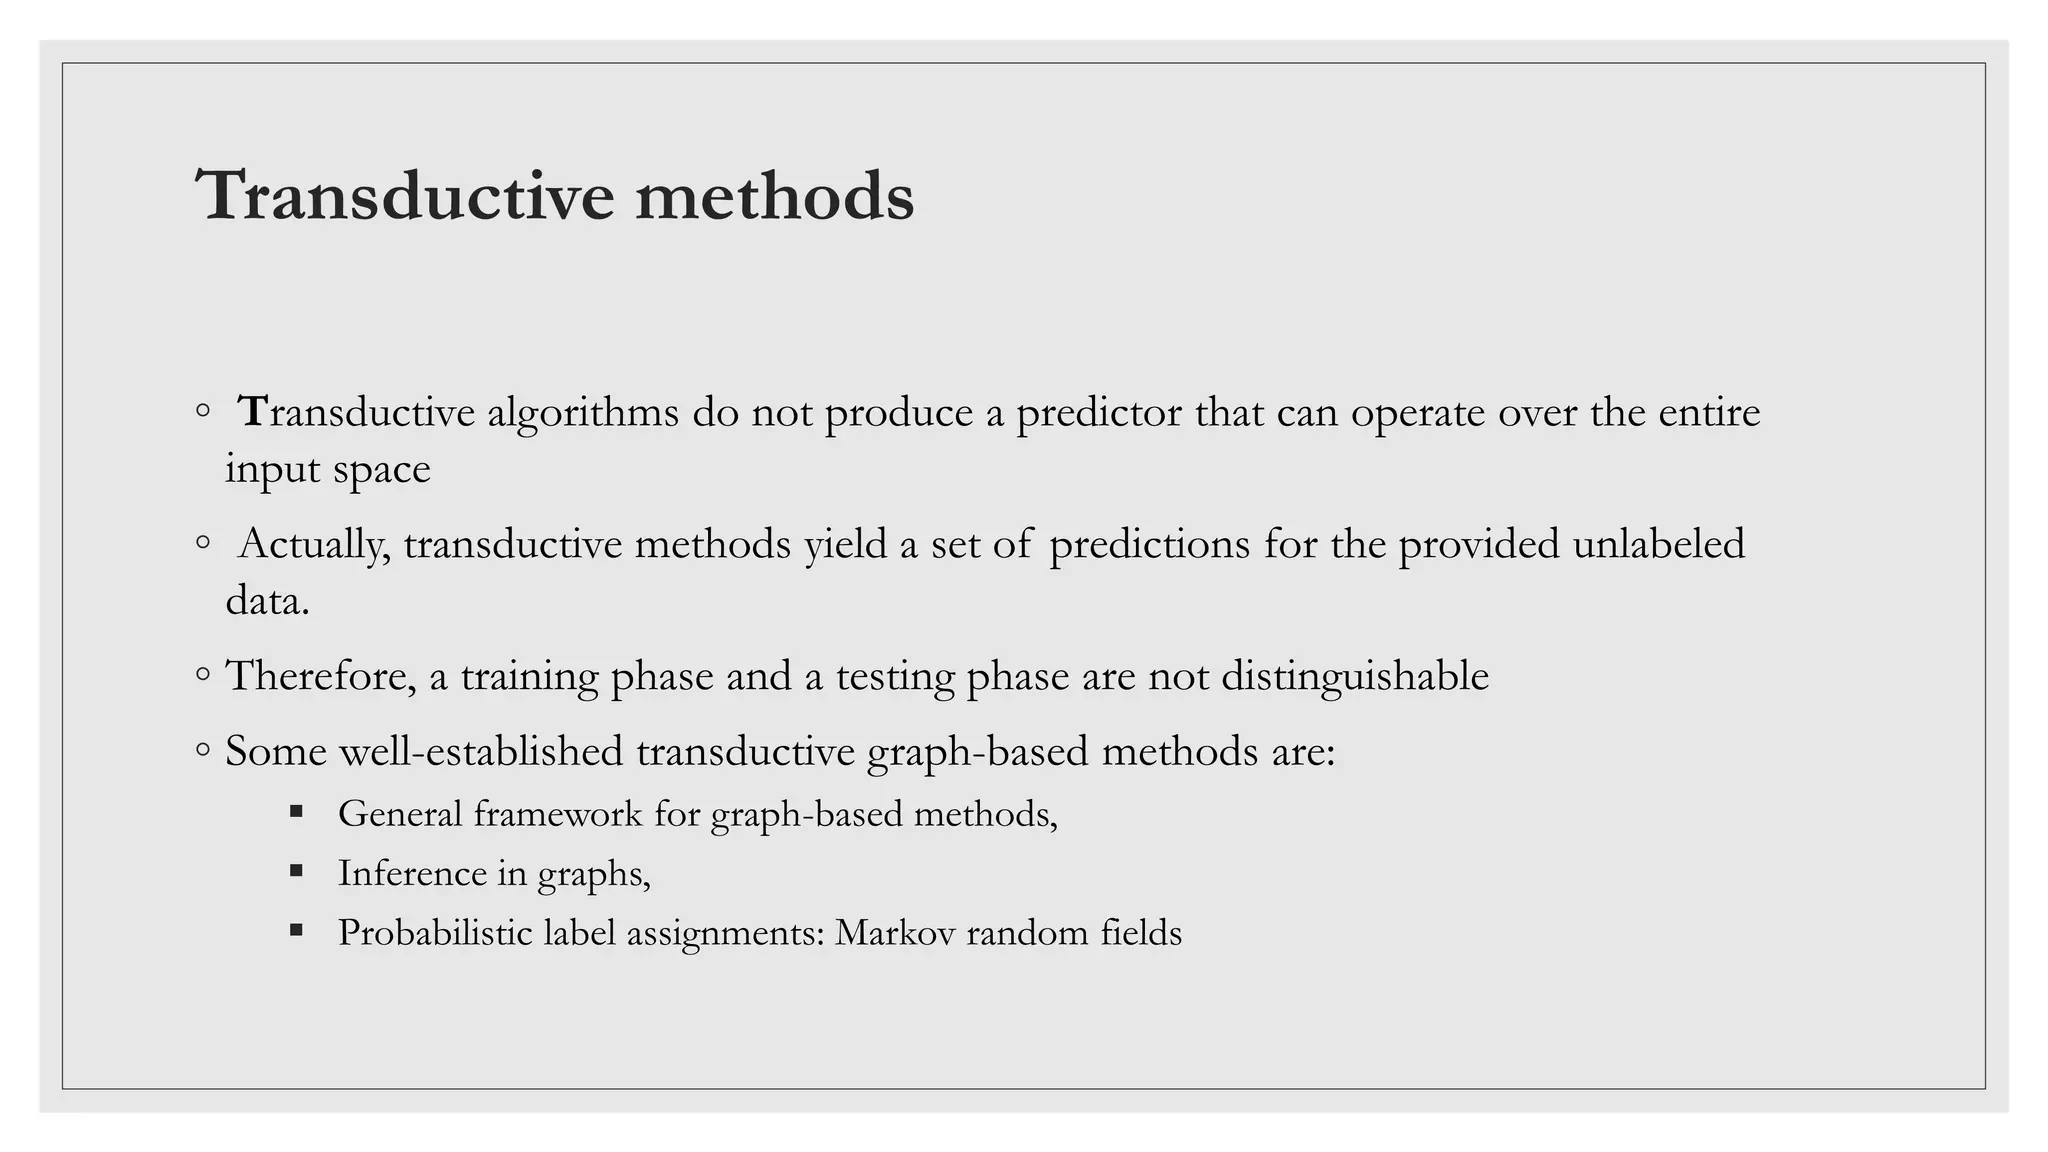
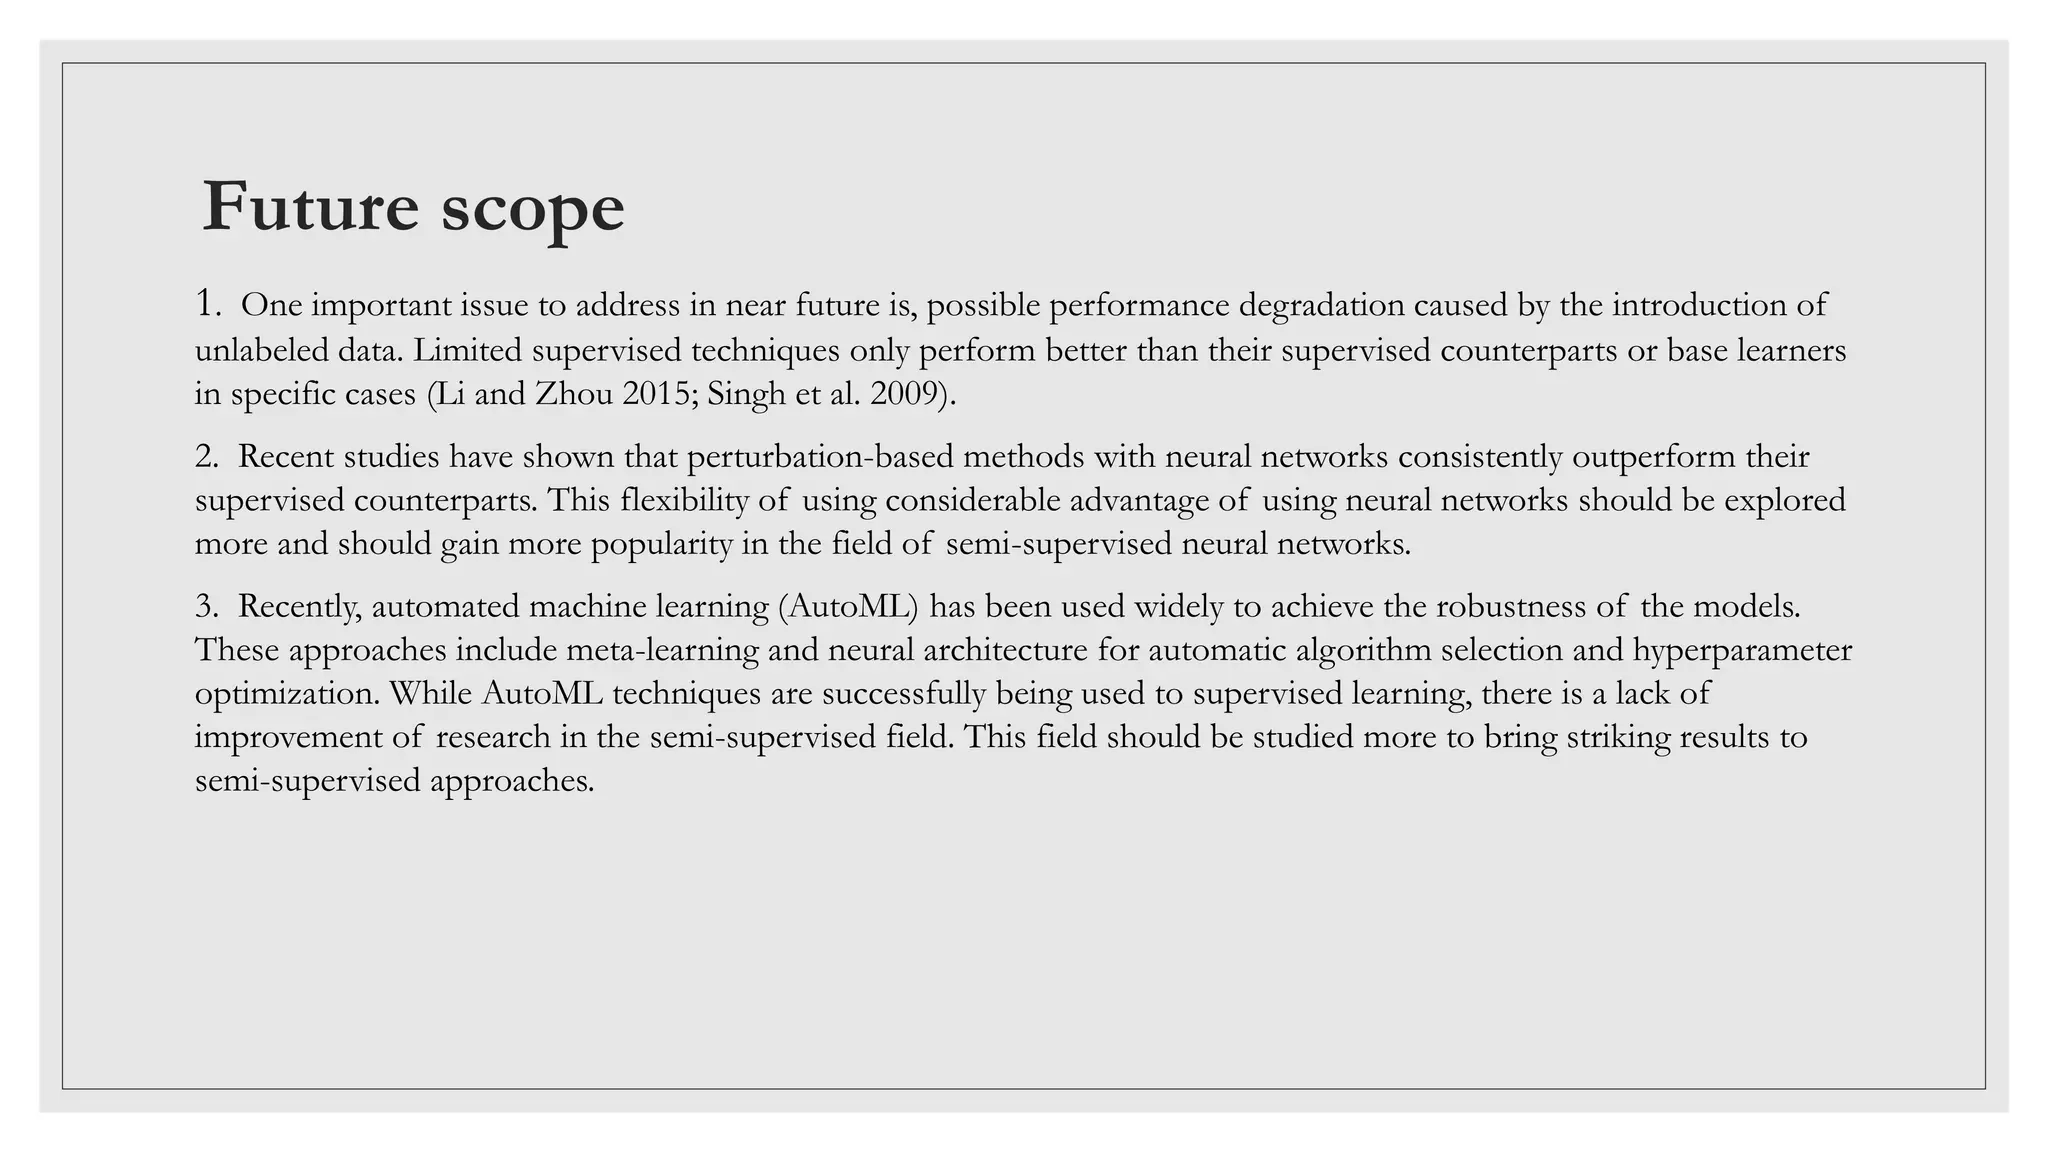
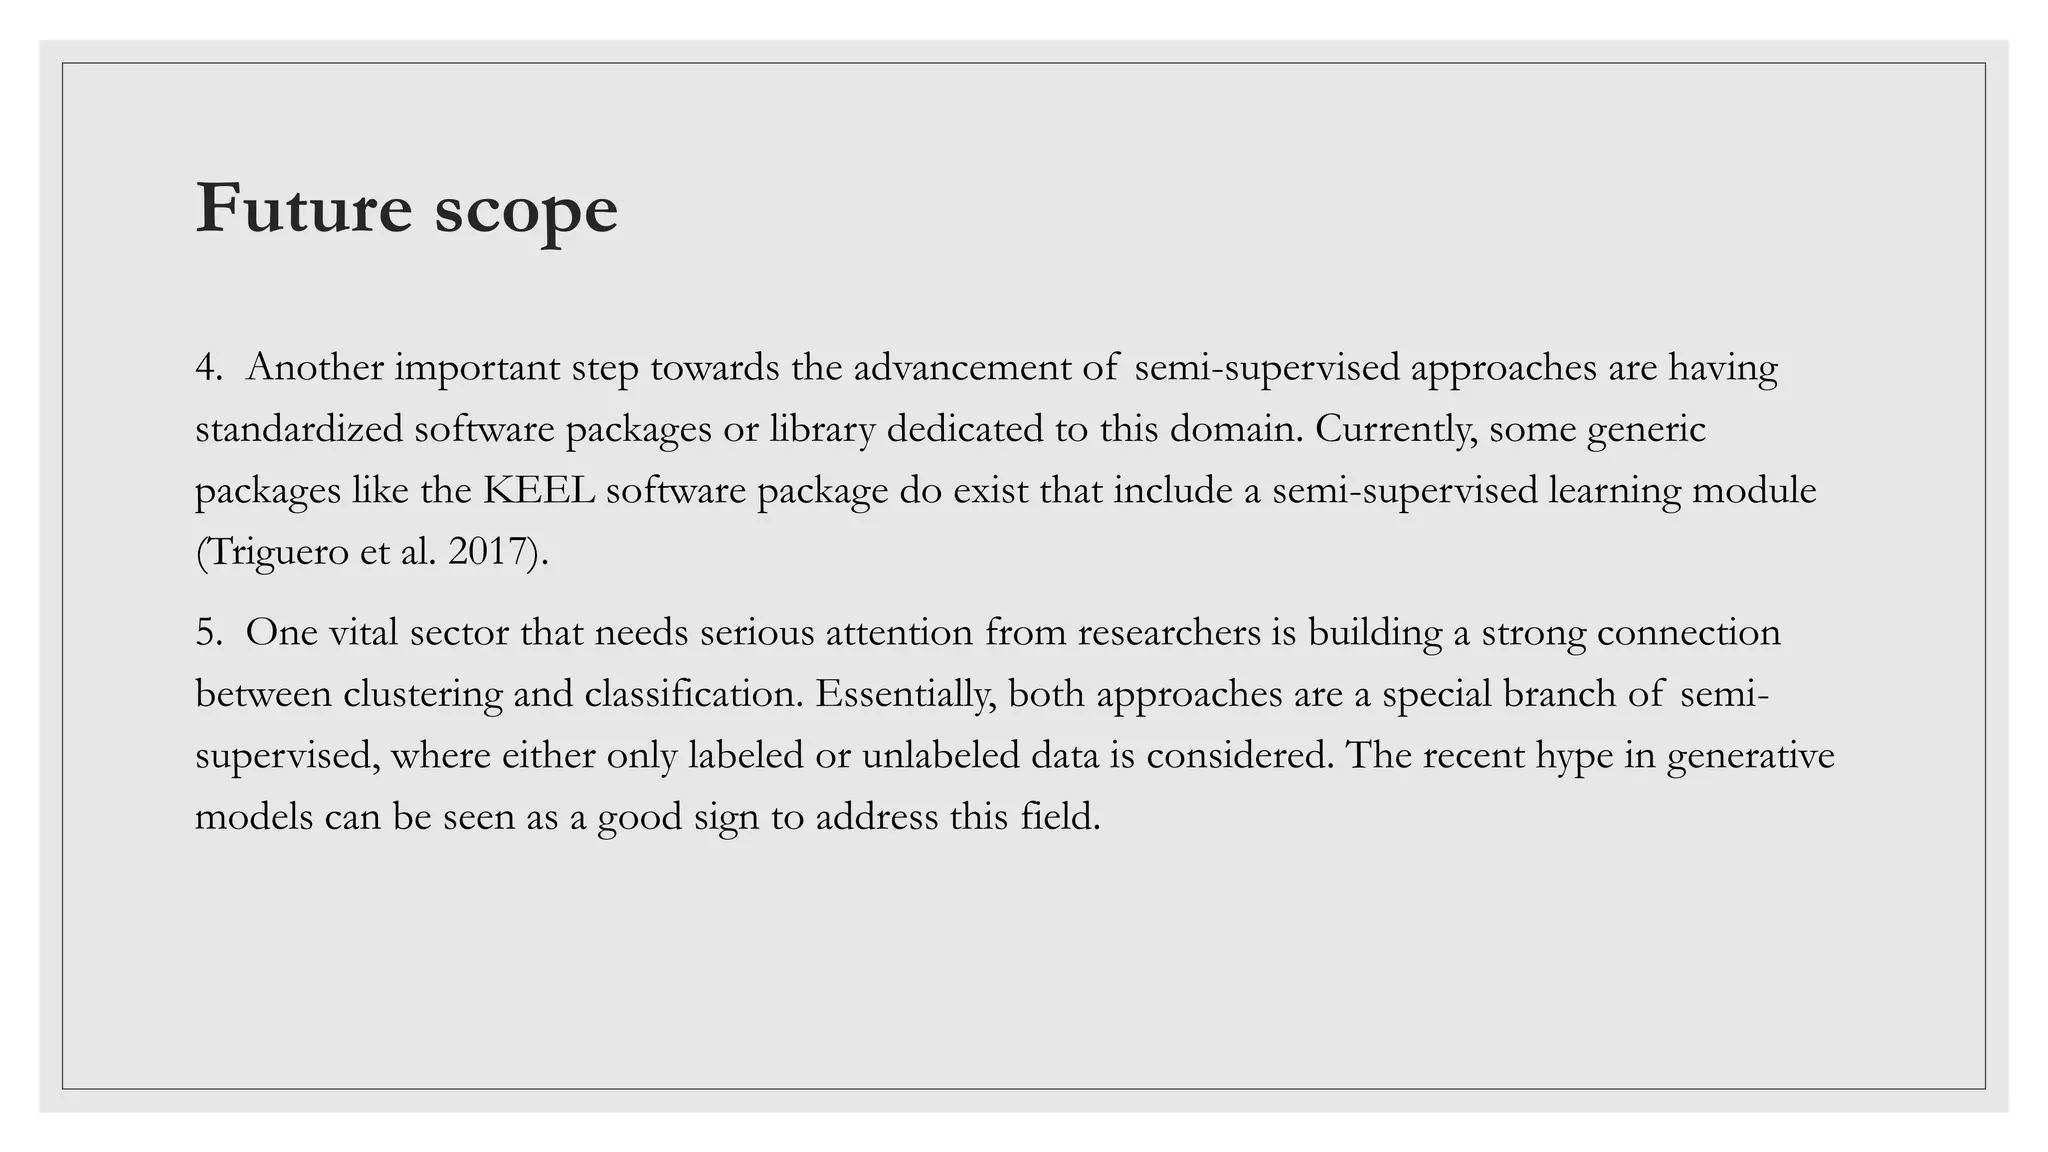
An Evaluation of Feature Selection Methods for Positive - Unlabeled Learning ...Editor IJCATR
Feature Selection is important in the processing of data in domains such
as text because such data can be of very high
dimension. Because in positive
-
unlabeled (PU) learning problems, there are no labeled negative data for training, we need
unsupervised feature selection methods that do not use the class information in the trai
ning documents when selecting features for the
classifier. There are few feature selection methods that are available for use in document classification with PU learning. I
n this paper
we evaluate four unsupervised methods including, collection frequency (
CF), document frequency (DF), collection frequency
-
inverse
document frequency (CF
-
IDF) and term frequency
-
document frequency (TF
-
DF). We found DF most effective in our experiments.
Construction of composite index: process & methodsgopichandbalusu
The document discusses the steps involved in constructing a composite index. It begins with developing a theoretical framework to define the phenomenon and relevant dimensions/indicators. Next, appropriate data is selected and missing data is imputed. Variables are then normalized to make them comparable. Weighting and aggregation methods are used to combine the normalized indicators into a composite index. Uncertainty and sensitivity analysis ensure robustness. The final index is interpreted in relation to the original data and framework.
STUDENT PERFORMANCE ANALYSIS USING DECISION TREEAkshay Jain
This document describes a student performance analysis project that uses decision trees. It introduces decision trees and their use for classification problems. The project aims to use decision tree methodology to analyze student performance data, including attendance, test scores, seminar marks, and assignment marks to predict exam performance. It discusses the existing manual system and proposes a computerized system using decision tree induction. The key modules described are the calling class for data insertion, binary nodes to represent attribute values, and the decision tree module to build the tree from training data and classify new data.
Students academic performance using clustering techniquesaniacorreya
This document summarizes a study analyzing students' academic performance data. The study collected internal and external marks for 45 students over 5 semesters. It cleaned the data, transforming the marks into sums, and used k-means clustering to group students into 4 categories (excellent, good, fair, poor) for each semester based on their internal and external marks. The analysis found the clusters followed the same performance pattern each semester, with students scoring higher internally also scoring higher externally, indicating a direct relationship between internal and external marks. The study concluded a student's university exam performance can generally be predicted from their internal marks.
This document describes a Computer Aided Testing System (CATS) designed to provide insight into students' reasoning patterns. CATS administers online tests and tracks students' responses, including response times and notes made on questions. It aims to emulate paper test-taking strategies. Test questions are randomly selected from pools of various difficulty levels. Student and teacher reports link performance to patterns in students' reasoning to support reflection and improve instruction.
Predicting students performance in final examinationRashid Ansari
The document discusses predicting student performance in final examinations. It examines using linear regression and multilayer perceptron algorithms on attributes of student postings in discussion forums and attendance scores. The case study involved 50 students, and the multilayer perceptron model produced slightly more accurate results based on correlation coefficients and error rates. Specifically, the multilayer perceptron model had a higher correlation coefficient of 0.84 compared to 0.82 for linear regression, and lower mean absolute and root mean squared errors.
Slides presenting preliminary overview of thesis work presented at the International Conference on Electronic Learning in the Workplace at Columbia University on June 11, 2010.
Technological persuasive pedagogy a new way to persuade students in the compu...Alexander Decker
This document introduces a new pedagogical approach called "technological persuasive pedagogy" to more effectively persuade students in computer-based mathematics learning. It discusses prior models and theories of persuasion and identifies 16 principles that can be used to 1) improve negative attitudes, 2) increase positive attitudes, or 3) prevent declines in positive attitudes. The document outlines the content analysis method used to extract these principles from literature on persuasion in education. It describes coding and reliability testing of the principles to develop a codebook for applying them in computer-based mathematics classrooms.
The document describes a student profiling system that uses fuzzy logic and neural networks. It proposes using Fuzzy C-means clustering and Adaptive Neuro Fuzzy Inference Systems (ANFIS) on survey data from students to understand their learning capabilities and create rules for a more personalized learning approach. A survey was conducted with 30 students which formed a dataset for the system. Fuzzy C-means clustering and ANFIS were used to analyze the data and generate inferences. The system aims to improve learning effectiveness through customizing learning based on students' cognitive states and skills.
Seminar Proposal Tugas Akhir - SPK Pemilihan tema Tugas Akhir menggunakan Ana...Dila Nurlaila
Slide ini berisikan materi seminar proposal tugas akhir/skripsi mengenai sistem pendukung keputusan pemilihan tema tugas akhir Menggunakan metode Analytic Network Process
jangan lupa sitasi
1. The document provides an assignment for a research methodology course. It includes 6 questions assessing different aspects of research methodology.
2. The questions cover topics such as the steps in the research process, primary and secondary data collection methods, measurement scales, questionnaire design, analysis of variance techniques, and research ethics.
3. Students are instructed to answer all questions, with some questions requiring approximately 400 words and others involving calculations or data analysis.
This document provides information about an MBA course on research methodology. It includes 6 questions related to key concepts in research such as problem identification, data collection methods, sampling, data analysis, chi-square test, and analysis of variance. Contact information is provided at the top for students to get fully solved assignments or send their course details.
Using the Students Performance in Exams Dataset we will try to understand what affects the exam scores. The data is limited, but it will present a good visualization to spot the relations. First of all, we explore our data and after that we apply Naive Bayes Classification technique for evaluation purpose.
This document outlines the key steps in the data preparation process:
1. Check questionnaires for completeness and logical responses
2. Edit data to ensure consistency, correct errors, and fill in missing values
3. Code data by assigning numerical values to question responses
4. Clean data by identifying outliers and inconsistencies to improve data quality
Active learning aims to improve machine learning models using less training data by strategically selecting the most informative data points to be labeled. It is important because manually labeling data can be time-consuming and expensive. The core problem is how to actively select the most informative training points to query labels for. Different active learning methods, such as using neural networks, Bayesian models, and support vector machines, aim to query points that the current model is most uncertain about. Combining active learning with expectation maximization using a large pool of unlabeled data can improve text classification when only a small amount of labeled training data is available.
A cluster-based analysis to diagnose students’ learning achievementsMiguel R. Artacho
The document describes a proposed methodology for diagnosing students' learning achievements using cluster-based analysis. The methodology involves using item response theory to assess students' skill levels on concepts, identifying weaknesses and misconceptions, and clustering students based on similar disabilities. The methodology aims to provide adaptive feedback to help students improve and inform teaching strategies. A software tool was developed to implement the diagnostic assessment and clustering.
The document proposes a new framework called Quasi Framework to detect disengagement in online learning. It analyzes log file data from an online learning system to identify attributes related to disengagement. The framework merges log file information with student database information and uses it to predict disengagement. Experimental results on a real student dataset show the Quasi Framework achieves higher accuracy than an existing system called iHelp, particularly for predicting disengaged students. The study suggests considering both reading and assessment attributes are important for accurate disengagement detection.
This document provides an overview and template for conducting independent research. It discusses key aspects of the research process such as defining the research problem, identifying independent and dependent variables, developing hypotheses, choosing an appropriate research methodology, collecting and analyzing data, and presenting conclusions. Sample topics are provided to illustrate each step, such as examining factors that could contribute to an university's internet server crashing each July. The document concludes by listing references that were consulted in creating the research overview and template.
Quantitative data analysis - Attitudes Towards ResearchLee Cox
This presentation aims to analyze survey data on attitudes towards research. However, the data set has limitations like missing key demographic details and being an opportunistic sample of 50 respondents. While the data could still be analyzed, issues are identified like ambiguous questions and a lack of raw data. Better approaches for analysis include categorizing roles, formatting questions clearly, and applying statistical tests to check for significance. Presenting findings would require directly answering the research question, conclusions, and validating interpretations with supporting data and considering alternatives.
This document summarizes a study on developing an expert system called W-CAT (Witty Cat) to analyze educational data and generate rules to provide feedback to instructors. It describes collecting student survey data on exam preparation activities and results. Association rule learning was used to generate rules from the data, such as students who viewed review videos performed poorly on exams. The study found the rules provided useful insights for instructors. Further development of W-CAT is ongoing to automate rule generation and provide human-readable explanations of results.
This document provides an overview of the CSE 591: Machine Learning and Applications course taught by Dr. Jieping Ye at Arizona State University. The following key points are discussed:
- Course information including instructor, time/location, prerequisites, objectives to provide an understanding of machine learning methods and applications.
- Topics covered include clustering, classification, dimensionality reduction, semi-supervised learning, and kernel learning.
- The grading breakdown includes homework, a group project, and an exam. Students are required to participate in class discussions.
- An introduction to machine learning is provided including definitions of supervised vs. unsupervised learning and applications in domains like bioinformatics.
The document discusses using data mining techniques to model and predict outcomes for freshmen students. It compares several data mining methods and finds that gradient boosting and classification and regression trees (CART) performed best in predicting GPA based on high school and college academic factors. Specifically, it selected the CART method to build a decision tree model. The model found high school GPA, scholarship aid, AP credits, and LMS course logins to be most important in predicting freshmen GPA.
Big shadow test
Big-Shadow-Test Method is used to solve a large simultaneous problem as a sequence of smaller simultaneous problems.
Shadow tests are no regular tests; their items are always returned to the pool. They are only assembled to balance the selection of items between current and future tests. Because of their presence, they neutralize the greedy character inherent in sequential test-assembly methods. In doing so, they prevent the best items from being assigned only to earlier tests and keep the later test-assembly problems feasible.
Student Performance Evaluation in Education Sector Using Prediction and Clust...IJSRD
Data mining is the crucial steps to find out previously unknown information from large relational database. various technique and algorithm are their used in data mining such as association rules, clustering and classification and prediction techniques. Ease of the techniques contains particular characteristics and behaviour. In this paper the prime focus on clustering technique and prediction technique. Now a days large amount of data stored in educational database increasing rapidly. The database for particular set of student was collected. The clustering and prediction is made on some detailed manner and the results were produce. The K-means clustering algorithm is used here. To find nearest possible a cluster a similar group the turning point India is the performance in higher education for all students. This academic performance is influenced by various factor, therefore to identify the difference between high learners and slow learner students it is important for student performance to develop predictive data mining model.
Knowledge Management in the Cloud: Benefits and RisksEditor IJCATR
The success of organizations largely depends on continual investment in learning and acquiring new knowledge that creates
new businesses and improve existing performance. So, using Knowledge management must result in better achieving, or even
exceeding, organizations objectives. The purpose of knowledge management must not be to just become more knowledgeable, but to
be able to create, transfer and apply knowledge with the purpose of better achieving objectives. As new technologies and paradigms
emerge, businesses have to make new efforts to properly get aligned with them, especially in knowledge management area. Today the
Cloud Computing paradigm is becoming more and more popular, due to the vast decrease in time, cost and effort for meeting software
development needs. It also provides a great means for gathering and redistributing knowledge. In this paper, we will discuss the
benefits and risks of using cloud computing in knowledge management systems.
An Evaluation of Feature Selection Methods for Positive- Unlabeled Learning i...Editor IJCATR
This document evaluates four unsupervised feature selection methods for positive-unlabeled learning in text classification. It compares Collection Frequency (CF), Document Frequency (DF), Collection Frequency-Inverse Document Frequency (CF-IDF), and Term Frequency-Document Frequency (TF-DF). The document collected a dataset of positive diabetes webpages and unlabeled webpages to test the feature selection methods. It found that the DF (Document Frequency) method, which selects features based on the number of documents a feature appears in, was the most effective at feature selection for positive-unlabeled learning based on the experiments.
When deep learners change their mind learning dynamics for active learningDevansh16
Abstract:
Active learning aims to select samples to be annotated that yield the largest performance improvement for the learning algorithm. Many methods approach this problem by measuring the informativeness of samples and do this based on the certainty of the network predictions for samples. However, it is well-known that neural networks are overly confident about their prediction and are therefore an untrustworthy source to assess sample informativeness. In this paper, we propose a new informativeness-based active learning method. Our measure is derived from the learning dynamics of a neural network. More precisely we track the label assignment of the unlabeled data pool during the training of the algorithm. We capture the learning dynamics with a metric called label-dispersion, which is low when the network consistently assigns the same label to the sample during the training of the network and high when the assigned label changes frequently. We show that label-dispersion is a promising predictor of the uncertainty of the network, and show on two benchmark datasets that an active learning algorithm based on label-dispersion obtains excellent results.
A Survey on the Classification Techniques In Educational Data MiningEditor IJCATR
Due to increasing interest in data mining and educational system, educational data mining is the emerging topic for research
community. educational data mining means to extract the hidden knowledge from large repositories of data with the use of technique
and tools. educational data mining develops new methods to discover knowledge from educational database and used for decision
making in educational system. The various techniques of data mining like classification. clustering can be applied to bring out hidden
knowledge from the educational data.
In this paper, we focus on the educational data mining and classification techniques. In this study we analyze attributes for the
prediction of student's behavior and academic performance by using WEKA open source data mining tool and various classification
methods like decision trees, C4.5 algorithm, ID3 algorithm etc.
This document analyzes and compares the performance of various classification algorithms (J48, Random Forest, Multilayer Perceptron, IB1, Decision Table) in predicting student performance using data from 260 students. Random Forest performed the best with 89.23% accuracy, taking the least time to build the model and having the lowest error rates compared to the other algorithms. Attributes like attendance, economic status, and parental education were found to be most important factors influencing student results. The analysis provides insight into how different factors impact student performance.
In a world of data explosion, the rate of data generation and consumption is on the increasing side,
there comes the buzzword - Big Data.
Big Data is the concept of fast-moving, large-volume data in varying dimensions (sources) and
highly unpredicted sources.
The 4Vs of Big Data
● Volume - Scale of Data
● Velocity - Analysis of Streaming Data
● Variety - Different forms of Data
● Veracity - Uncertainty of Data
With increasing data availability, the new trend in the industry demands not just data collection but making an ample sense of acquired data - thereby, the concept of Data Analytics.
Taking it a step further to further make futuristic prediction and realistic inferences - the concept
of Machine Learning.
A blend of both gives a robust analysis of data for the past, now and the future.
There is a thin line between data analytics and Machine learning which becomes very obvious
when you dig deep.
This document summarizes a study on developing an expert system called WittyCat to provide dynamic assessments of student exam quality. Survey data and course materials were collected and analyzed using association rule learning. Rules generated from a pilot study provided insights that helped instructors improve their teaching. The current state of WittyCat automates rule generation and seeks to explain conclusions. Contributions from additional course data and feedback are requested to evaluate WittyCat's assessments.
This document discusses learning components and types of learning in artificial intelligence. It will differentiate between supervised, unsupervised and reinforcement learning, and implement applications of each. Students will learn and implement perceptron and neural networks, as well as ensemble learning techniques like bagging and boosting. The objective is to discuss learning components, types of learning in AI, and implement algorithms for supervised, unsupervised and reinforcement learning.
Week 4 advanced labeling, augmentation and data preprocessingAjay Taneja
This document provides an overview of advanced machine learning techniques for data labeling, augmentation, and preprocessing. It discusses semi-supervised learning, active learning, weak supervision, and various data augmentation strategies. For data labeling, it describes how semi-supervised learning leverages both labeled and unlabeled data, while active learning intelligently samples data and weak supervision uses noisy labels from experts. For data augmentation, it explains how existing data can be modified through techniques like flipping, cropping, and padding to generate more training examples. The document also introduces the concepts of time series data and how time ordering is important for modeling sequential data.
Detection of Online Learning Activity ScopesSyeda Sana
This document outlines a methodology for detecting online learning activities through enrichment, clustering, and cluster selection/labeling. It begins by introducing the challenges of analyzing online learning activities and related work in learning analytics. The methodology is then described in detail, including using named entity recognition to enrich resource profiles, hierarchical clustering of resources, and selecting clusters to label based on coverage. The method is applied in case studies on the Didactalia platform and analyzing a learner's browsing history. Future work includes evaluating benefits for learners and expanding the methodology to other languages.
In a world of data explosion, the rate of data generation and consumption is on the increasing side, there comes the buzzword - Big Data.
Big Data is the concept of fast-moving, large-volume data in varying dimensions (sources) and
highly unpredicted sources.
The 4Vs of Big Data
● Volume - Scale of Data
● Velocity - Analysis of Streaming Data
● Variety - Different forms of Data
● Veracity - Uncertainty of Data
With increasing data availability, the new trend in the industry demands not just data collection,
but making ample sense of acquired data - thereby, the concept of Data Analytics.
Taking it a step further to further make a futuristic prediction and realistic inferences - the concept
of Machine Learning.
A blend of both gives a robust analysis of data for the past, now and the future.
There is a thin line between data analytics and Machine learning which becomes very obvious
when you dig deep.
Educational Data Mining to Analyze Students Performance – Concept PlanIRJET Journal
This document discusses using data mining techniques to analyze student performance data from educational institutions. It proposes using clustering and classification algorithms like K-means and Naive Bayesian on data collected from sources like learning management systems and surveys. The goals are to classify students into performance levels, identify factors affecting performance, and make recommendations to help students improve. Clustering could group students and classification could predict performance based on attributes. Analyzing the data may provide insights to enhance guidance and outcomes. The paper presents this as a conceptual plan to apply data mining in education.
This document describes an academic performance analysis system that uses educational data mining techniques. It analyzes student and teacher performance data collected from an engineering college. The system applies the Apriori algorithm and decision tree algorithm to mine patterns in academic data. The Apriori algorithm is used to generate rules based on support, confidence and lift to analyze student performance in different courses. The decision tree algorithm is used to analyze and visualize results for individual students, student groups, and indirectly for teachers. The goal is to identify existing patterns in past student performance data and use it to improve future student and teacher performance.
Review: Semi-Supervised Learning Methods for Word Sense DisambiguationIOSR Journals
This document provides a review of semi-supervised learning methods for word sense disambiguation. It discusses how semi-supervised learning uses both labeled and unlabeled data, requiring only a small amount of labeled data. The document outlines several semi-supervised learning techniques for word sense disambiguation, including bootstrapping algorithms like Yarowsky's algorithm, and graph-based approaches like label propagation. It provides details on Yarowsky's bootstrapping algorithm and how it is able to generalize to label new examples through exploiting properties like one-sense-per-collocation and language redundancy.
Prognostication of the placement of students applying machine learning algori...BIJIAM Journal
Placement is the process of connecting the selected candidate with the employer. Every student might have adream of having a job offer when he or she is about to complete her course. All educational institutions aim athaving their students well placed in good organizations. The reputation of any institution depends on the placementof its students. Hence, many institutions try hard to have a good placement cell. Classification using machinelearning may be utilized to retrieve data from the student-databases. A prediction model that can foretell theeligibility of the students based on their academic and extracurricular achievements is proposed. Related data wascollected from many institutions for which the placement-prediction is made. This paradigm is being weighed upwith the existing algorithms, and findings have been made regarding the accuracy of predictions. It was found thatthe proposed algorithm performed significantly better and yielded good results.
Effective Feature Selection for Feature Possessing Group Structurerahulmonikasharma
This document proposes a new method called efficient group variable selection (EGVS) for feature selection when features have a group structure. EGVS has two stages: 1) within-group variable selection evaluates each feature individually to select discriminative features within each group. 2) Between-group variable selection re-evaluates all features to remove redundancy and obtain an optimal subset by considering relationships between groups. The method is demonstrated on benchmark datasets, showing it increases classification accuracy by leveraging the group structure during feature selection.
This document provides an overview of unsupervised learning techniques. It begins with introductions to unsupervised learning and clustering as a machine learning task. It then describes different types of clustering techniques including partitioning methods like k-means and k-medoids, hierarchical clustering, and density-based methods. Applications of clustering like customer segmentation and anomaly detection are also discussed. Key aspects of clustering algorithms like determining the optimal number of clusters using the elbow method are explained through examples.
This document discusses using data mining techniques to analyze faculty performance at an engineering college in India. It proposes analyzing 4 parameters - student complaints, feedback, results, and reviews - to evaluate faculty instead of just 2 parameters (feedback and results) used previously. It will use opinion mining to analyze faculty performance and calculate scores. The system will collect data, preprocess it, apply a KNN algorithm to the 4 parameters to calculate scores for each faculty, sum the scores, classify results using rule-based classification, and analyze outcomes by subject and class. It reviews related work applying educational data mining and concludes the multiple classifier approach is better, and future work could consider more parameters and expand to all college branches and departments.
Similar to Semi-supervised Learning Survey - 20 years of evaluation (20)
HCL Notes und Domino Lizenzkostenreduzierung in der Welt von DLAUpanagenda
Webinar Recording: https://www.panagenda.com/webinars/hcl-notes-und-domino-lizenzkostenreduzierung-in-der-welt-von-dlau/
DLAU und die Lizenzen nach dem CCB- und CCX-Modell sind für viele in der HCL-Community seit letztem Jahr ein heißes Thema. Als Notes- oder Domino-Kunde haben Sie vielleicht mit unerwartet hohen Benutzerzahlen und Lizenzgebühren zu kämpfen. Sie fragen sich vielleicht, wie diese neue Art der Lizenzierung funktioniert und welchen Nutzen sie Ihnen bringt. Vor allem wollen Sie sicherlich Ihr Budget einhalten und Kosten sparen, wo immer möglich. Das verstehen wir und wir möchten Ihnen dabei helfen!
Wir erklären Ihnen, wie Sie häufige Konfigurationsprobleme lösen können, die dazu führen können, dass mehr Benutzer gezählt werden als nötig, und wie Sie überflüssige oder ungenutzte Konten identifizieren und entfernen können, um Geld zu sparen. Es gibt auch einige Ansätze, die zu unnötigen Ausgaben führen können, z. B. wenn ein Personendokument anstelle eines Mail-Ins für geteilte Mailboxen verwendet wird. Wir zeigen Ihnen solche Fälle und deren Lösungen. Und natürlich erklären wir Ihnen das neue Lizenzmodell.
Nehmen Sie an diesem Webinar teil, bei dem HCL-Ambassador Marc Thomas und Gastredner Franz Walder Ihnen diese neue Welt näherbringen. Es vermittelt Ihnen die Tools und das Know-how, um den Überblick zu bewahren. Sie werden in der Lage sein, Ihre Kosten durch eine optimierte Domino-Konfiguration zu reduzieren und auch in Zukunft gering zu halten.
Diese Themen werden behandelt
- Reduzierung der Lizenzkosten durch Auffinden und Beheben von Fehlkonfigurationen und überflüssigen Konten
- Wie funktionieren CCB- und CCX-Lizenzen wirklich?
- Verstehen des DLAU-Tools und wie man es am besten nutzt
- Tipps für häufige Problembereiche, wie z. B. Team-Postfächer, Funktions-/Testbenutzer usw.
- Praxisbeispiele und Best Practices zum sofortigen Umsetzen
Climate Impact of Software Testing at Nordic Testing DaysKari Kakkonen
My slides at Nordic Testing Days 6.6.2024
Climate impact / sustainability of software testing discussed on the talk. ICT and testing must carry their part of global responsibility to help with the climat warming. We can minimize the carbon footprint but we can also have a carbon handprint, a positive impact on the climate. Quality characteristics can be added with sustainability, and then measured continuously. Test environments can be used less, and in smaller scale and on demand. Test techniques can be used in optimizing or minimizing number of tests. Test automation can be used to speed up testing.
TrustArc Webinar - 2024 Global Privacy SurveyTrustArc
How does your privacy program stack up against your peers? What challenges are privacy teams tackling and prioritizing in 2024?
In the fifth annual Global Privacy Benchmarks Survey, we asked over 1,800 global privacy professionals and business executives to share their perspectives on the current state of privacy inside and outside of their organizations. This year’s report focused on emerging areas of importance for privacy and compliance professionals, including considerations and implications of Artificial Intelligence (AI) technologies, building brand trust, and different approaches for achieving higher privacy competence scores.
See how organizational priorities and strategic approaches to data security and privacy are evolving around the globe.
This webinar will review:
- The top 10 privacy insights from the fifth annual Global Privacy Benchmarks Survey
- The top challenges for privacy leaders, practitioners, and organizations in 2024
- Key themes to consider in developing and maintaining your privacy program
Unlocking Productivity: Leveraging the Potential of Copilot in Microsoft 365, a presentation by Christoforos Vlachos, Senior Solutions Manager – Modern Workplace, Uni Systems
Dr. Sean Tan, Head of Data Science, Changi Airport Group
Discover how Changi Airport Group (CAG) leverages graph technologies and generative AI to revolutionize their search capabilities. This session delves into the unique search needs of CAG’s diverse passengers and customers, showcasing how graph data structures enhance the accuracy and relevance of AI-generated search results, mitigating the risk of “hallucinations” and improving the overall customer journey.
GraphSummit Singapore | The Future of Agility: Supercharging Digital Transfor...Neo4j
Leonard Jayamohan, Partner & Generative AI Lead, Deloitte
This keynote will reveal how Deloitte leverages Neo4j’s graph power for groundbreaking digital twin solutions, achieving a staggering 100x performance boost. Discover the essential role knowledge graphs play in successful generative AI implementations. Plus, get an exclusive look at an innovative Neo4j + Generative AI solution Deloitte is developing in-house.
How to Get CNIC Information System with Paksim Ga.pptxdanishmna97
Pakdata Cf is a groundbreaking system designed to streamline and facilitate access to CNIC information. This innovative platform leverages advanced technology to provide users with efficient and secure access to their CNIC details.
Communications Mining Series - Zero to Hero - Session 1DianaGray10
This session provides introduction to UiPath Communication Mining, importance and platform overview. You will acquire a good understand of the phases in Communication Mining as we go over the platform with you. Topics covered:
• Communication Mining Overview
• Why is it important?
• How can it help today’s business and the benefits
• Phases in Communication Mining
• Demo on Platform overview
• Q/A
Sudheer Mechineni, Head of Application Frameworks, Standard Chartered Bank
Discover how Standard Chartered Bank harnessed the power of Neo4j to transform complex data access challenges into a dynamic, scalable graph database solution. This keynote will cover their journey from initial adoption to deploying a fully automated, enterprise-grade causal cluster, highlighting key strategies for modelling organisational changes and ensuring robust disaster recovery. Learn how these innovations have not only enhanced Standard Chartered Bank’s data infrastructure but also positioned them as pioneers in the banking sector’s adoption of graph technology.
Let's Integrate MuleSoft RPA, COMPOSER, APM with AWS IDP along with Slackshyamraj55
Discover the seamless integration of RPA (Robotic Process Automation), COMPOSER, and APM with AWS IDP enhanced with Slack notifications. Explore how these technologies converge to streamline workflows, optimize performance, and ensure secure access, all while leveraging the power of AWS IDP and real-time communication via Slack notifications.
Why You Should Replace Windows 11 with Nitrux Linux 3.5.0 for enhanced perfor...SOFTTECHHUB
The choice of an operating system plays a pivotal role in shaping our computing experience. For decades, Microsoft's Windows has dominated the market, offering a familiar and widely adopted platform for personal and professional use. However, as technological advancements continue to push the boundaries of innovation, alternative operating systems have emerged, challenging the status quo and offering users a fresh perspective on computing.
One such alternative that has garnered significant attention and acclaim is Nitrux Linux 3.5.0, a sleek, powerful, and user-friendly Linux distribution that promises to redefine the way we interact with our devices. With its focus on performance, security, and customization, Nitrux Linux presents a compelling case for those seeking to break free from the constraints of proprietary software and embrace the freedom and flexibility of open-source computing.
AI 101: An Introduction to the Basics and Impact of Artificial IntelligenceIndexBug
Imagine a world where machines not only perform tasks but also learn, adapt, and make decisions. This is the promise of Artificial Intelligence (AI), a technology that's not just enhancing our lives but revolutionizing entire industries.
UiPath Test Automation using UiPath Test Suite series, part 5DianaGray10
Welcome to UiPath Test Automation using UiPath Test Suite series part 5. In this session, we will cover CI/CD with devops.
Topics covered:
CI/CD with in UiPath
End-to-end overview of CI/CD pipeline with Azure devops
Speaker:
Lyndsey Byblow, Test Suite Sales Engineer @ UiPath, Inc.
2. Paper
A survey on semi-supervised learning
◦ Jesper E. van Engelen &Holger H. Hoos
◦ Received: 3 December 2018 / Revised: 20 September 2019 / Accepted: 29
September 2019 /
◦ Published online: 15 November 2019
3. Overview
Semi-supervised learning
Basic Concepts and Assumptions
Taxonomy of Semi-supervised learning methods
Semi-supervised learning methods
Conclusions and future scope
4. Semi-supervised Learning
◦ In supervised learning, one is presented with a set of data points consisting of some
input x and a corresponding output value y. The goal is, then, to construct a classifier
or regressor that can estimate the output value for previously unseen inputs
◦ In unsupervised learning, no specific output value is provided; goal is to infer some
underlying structure from the inputs
◦ Semi-supervised learning is about making use of unlabeled data. It is useful when the
available labeled data is small.Unlabeled data is cheap Although not every type of
unlabeled data is useful
5. Basic Concepts and Assumptions
Assumptions of semi-supervised learning
◦ An important pre-condition of semi-supervised learning is that the underlying data distribution, p(x), contains
information about the posterior distribution p(y|x). Considering this condition, we can use unlabeled data to
gain information about p(x), and thereby about p(y|x).
◦ The smoothness assumption : if two samples x and x1 are close in the input space, their labels y and
y1 should be the same
◦ The low-density assumption : the decision boundary should not pass through high-density areas in
the input space
◦ The manifold assumption : same low-dimensional manifold datapoints should have the same label
7. Basic Concepts and Assumptions
Connection to Clustering
◦ According to Chapelle et al. 2006b, data points that belong to the same cluster come
from the same class. This assumption is called the semi-supervised learning assumption
of clusters.
9. Inductive methods
◦ Inductive methods build a classifier to generate predictions for any point in the
input space
◦ To train the classifier, unlabeled data can be used.
◦ Once, a model is built from the training phase and later can be used to predict the
new data point labels.
11. 1. Wrapper methods
o In the training step, one or more supervised classifiers are trained using the
labeled data and pseudo-labeled data from earlier iteration steps.
o Next, to infer labels from the previously trained unlabeled data, the resulting
classifiers are used in the pseudo-labeled step.
o Most confident predictions are used as the pseudo-label at the next iteration.
12. 1. Wrapper methods
1. 1 Self-training:
o This approach uses one supervised classifier that is re-trained iteratively based on its most confident predictions
1.2 Co-training:
o Here classifiers are iteratively re-trained on the most confident predictions of each other
o For co-training to succeed, the classifiers are supposed to be adequately different
1.3 Boosting:
o Like conventional boosting methods, they build ensemble classifiers by sequentially building individual classifiers
o Moreover, each individual classifier is trained using both the labeled data and the most confident predictions of
previously trained unlabeled data like before
13. 2. Unsupervised pre-processing
◦ Unsupervised preprocessing, either extract useful features from unlabeled data,
pre-cluster the data or use an unsupervised manner to compute the initial
parameters of a supervised learning procedure
14. 2. Unsupervised pre-processing
2. 1 Feature Extraction:
o These methods try to find a transformation of the input data that helps to improve classification and makes it
computationally efficient
2.2 Cluster-then-label:
o Cluster-then-label procedures form a group of methods that explicitly join the clustering and classification
processes
o At first, it uses an unsupervised or semi-supervised clustering algorithm to all the input data, and then use the
resulting clusters lead the classification process
2.3 Pre-training:
o This approach naturally fits in deep learning areas where each layer of the hierarchical model is a latent
representation of the input data.
o In pre-training methods, a decision boundary is conducted by unlabeled data before applying supervised training
15. 3. Intrinsically semi-supervised
◦ Here unlabeled data is directly incorporated into the objective function or optimization
procedure of the learning part.
◦ Most of these methods are direct extensions of supervised learning methods by
transforming objective functions to include unlabeled data.
16. 3. Intrinsically semi-supervised
3. 1 Maximum Margin:
o These methods aim to maximize the distance between the given data points and the decision
boundary
o The semi-supervised low-density assumption is the basis of these approaches
3.2 Perturbation-based:
o The perturbation-based methods directly incorporate the smoothness assumption.
o This concept implies that when a data point is perturbed with a small amount of noise, the
predictions for noisy and clean inputs should not be different
17. 3. Intrinsically semi-supervised
3.3 Manifolds:
o According to the manifold assumption: (a) the input space is composed of multiple lower-
dimensional manifolds on which all data points lie and
o (b) data points sharing the same lower-dimensional manifold have the same label
3.4 Generative Models:
o Generative approaches model the process that generates data.
o For classification problems, a generative model is conditioned on a given y label.
18. Transductive methods
◦ Transductive algorithms do not produce a predictor that can operate over the entire
input space
◦ Actually, transductive methods yield a set of predictions for the provided unlabeled
data.
◦ Therefore, a training phase and a testing phase are not distinguishable
◦ Some well-established transductive graph-based methods are:
General framework for graph-based methods,
Inference in graphs,
Probabilistic label assignments: Markov random fields
19. Future scope
1. One important issue to address in near future is, possible performance degradation caused by the introduction of
unlabeled data. Limited supervised techniques only perform better than their supervised counterparts or base learners
in specific cases (Li and Zhou 2015; Singh et al. 2009).
2. Recent studies have shown that perturbation-based methods with neural networks consistently outperform their
supervised counterparts. This flexibility of using considerable advantage of using neural networks should be explored
more and should gain more popularity in the field of semi-supervised neural networks.
3. Recently, automated machine learning (AutoML) has been used widely to achieve the robustness of the models.
These approaches include meta-learning and neural architecture for automatic algorithm selection and hyperparameter
optimization. While AutoML techniques are successfully being used to supervised learning, there is a lack of
improvement of research in the semi-supervised field. This field should be studied more to bring striking results to
semi-supervised approaches.
20. Future scope
4. Another important step towards the advancement of semi-supervised approaches are having
standardized software packages or library dedicated to this domain. Currently, some generic
packages like the KEEL software package do exist that include a semi-supervised learning module
(Triguero et al. 2017).
5. One vital sector that needs serious attention from researchers is building a strong connection
between clustering and classification. Essentially, both approaches are a special branch of semi-
supervised, where either only labeled or unlabeled data is considered. The recent hype in generative
models can be seen as a good sign to address this field.
21. Key References:
◦ J. E. van Engelen and H. H. Hoos, “A survey on semi-supervised learning,” Machine Learning, vol. 109, no. 2, pp. 373–440,
feb 2020.
◦ Bengio, Y., Delalleau, O., & Le Roux, N. (2006). Chapter 11. Label propagation and quadratic criterion. In O. Chapelle, B.
Schölkopf, & A. Zien (Eds.), Semi-supervised learning (pp. 193–216). Cambridge: The
MIT Press.
◦ Bengio, Y., Delalleau, O., & Le Roux, N. (2006). Chapter 11. Label propagation and quadratic criterion. In O. Chapelle, B.
Schölkopf, & A. Zien (Eds.), Semi-supervised learning (pp. 193–216). Cambridge: The MIT Press.
◦ Goldberg, A. B., Zhu, X., Singh, A., Xu, Z.,&Nowak, R. D. (2009).Multi-manifold semi-supervised learning. In Proceedings
of the 12th international conference on artificial intelligence and statistics (pp. 169–176).
◦ Haffari, G. R., & Sarkar, A. (2007). Analysis of semi-supervised learning with the Yarowsky algorithm. In Proceedings of
the 23rd conference on uncertainty in artificial intelligence (pp. 159–166).